Abstract
Most structural design codes use elastic analysis to calculate and distribute seismic base shear over the height. This may lead to unsuitable design and may cause undesirable damages to the struc-ture. To solve this problem, in recent years the Performance-based Plastic Design (PBPD) method which considers the plastic behav-ior of the structure, has been proposed. In this study, the PBPD method is extended to the dual system of moment and eccentrically braced frames. As a code requirement, in dual systems the moment frame must be able to resist at least 25 percent of the base shear. In the proposed PBPD method, the shear resistance of each system is selected at the beginning of design process and this criterion can be contributed to the design process directly. In this regard, three 6, 12 and 20 story structures are designed based on PBPD and conventional method. To assess the behavior of each system, non-linear pushover and time history analysis are conducted. Results show that dual frames that are designed by PBPD method have less stiffness and strength than frames that are designed by ordi-nary method. However the yield mechanism is controllable and plastic deformation capacity of structures are better conducted to design in PBPD method. The results also show that the collapse probability of frames that are designed by PBPD method is ac-ceptable.
Keywords
PBPD (Performance-based Plastic Design), Dual systems, Plastic hinge, Story drift, Plastic rotation of the links
Seismic Design and Performance of Dual Moment and Eccentrically
Braced Frame System Using PBPD Method
1 INTRODUCTION
Most structural design codes use elastic behavior of structures to calculate seismic base shear based on many parameters such as structural system, geometry and site location. The base shear is then distributed over the high of the structure. The distribution of base shear over the high is also based on elastic behavior of the structure. The nonlinear behavior of structures under severe earthquakes
A. Karamodin a A. Zanganeh b
a Assistance professor. engineering facul-ty. Ferdowsi University of Mashhad., PO Box 41778-1111, Vakil abad. Mashhad., [email protected]
b PHD student of structural engineering. Engineering faculty. Ferdowsi University of Mashhad., PO Box 41778-1111, Vakil abad., Mashhad.,
http://dx.doi.org/10.1590/1679-78253425
is conducted to the calculation of base shear indirectly by many parameters such as Response modi-fication factor (R) Over-strength coefficient (Ω) and displacement amplification factor (Cd).
Usually nonlinear behavior of structures appears on specific parts of structural members such as end of beams and columns in moment frames and diagonal members in concentrically braced frames. These elements are called fuse. Fuse elements are designed based on the seismic loads. Fuse ele-ments must also have enough ductility to dissipate seismic energy. Design of other members is per-formed based on the maximum force produced by the fuse elements. This method is called the Ca-pacity Design Method. In this method, which is not in compliance with the real behavior of the structure, undesired and unpredictable damages may be imposed to the structure.
To solve this problem, the performance-based plastic design (PBPD) method has been intro-duced [Leelataviwat S et al. (1999), Leelataviwat S et al. (2007), Lee SS and Goel SC (2001), Das-gupta P et al. (2004), Chao SH and Goel SC (2006a,b), Chao SH et al. (2007), (Chao SH and Goel SC (2008) ]. The PBPD method is based on the energy method (Housner GW, 1956). In this meth-od, target drift and yield mechanism of the structure are used as performance parameters. As an example, the ideal yield mechanism in moment frames, MRF, is the flexural yielding at the two ends of the beams and end of columns on the base. In eccentrically braced frames the ideal yield mechanism is shear or flexural yielding of links, and ultimately, flexural yielding at the column base at the first floor. The concept of PBPD was first recommended, for, eccentrically braced frames, EBF, based on the moment balance method (Roeder, C. W. and Popov, E. P., 1977).
PBPD has been also used to design moment frames (MRF) with lateral force distribution based on UBC97 code (Leelataviwat S et al. 1998). Considering the fact that UBC97 lateral force distribu-tion does not take into account the effect of the higher modes and nonlinear behavior of the struc-ture, this method has been used again, on moment frames, with a kind of lateral force distribution that considers nonlinear behavior (Lee SS and Goel SC, 2001). The results of this study showed that yielding occurred more uniformly over the structure. The, force distribution used in this re-search which has been obtained based on the nonlinear time history analysis, was considered to be exponential. This method has also been used on the eccentrically braced frames with asymmetric horizontal links (H-EBF) (Chao SH, Goel SC, 2005). It has also been used on moment special truss and concentrically braced frames (Chao SH, Goel SC, 2006a,b). Bayat et. al. (2010) summarizes this method to different lateral resisting earthquake systems. Sahoo, D.R. and Chao, S. H., (2010) use this method for buckling-restrained braced frames. PBPD method are used on RC special moment frame structures by Liao et. al. (2010) and Liao, W.C. and Goel S. C., (2012). Design of EBF with vertical links (V-EBF) has also been studied through this method (Shayanfar. M.A, 2012). Also PBPD method has been used on steel plate shear wall, non-ductile reinforced concrete frames by buckling-restrained braces, steel moment resistant frame and steel concentric braced frames (Swap-nil B et al., 2013, Khampanit.A, et al., 2014, Banihashemi, M.R, et al., 2015a,b, Er-Gang Xiong, et al., 2015).
2 PERFORMANCE–BASED PLASTIC DESIGN (PBPD) METHOD
PBPD method uses pre-selected target drift and yield mechanism as performance objectives. The degree and distribution of structural damage are directly related to these design parameters, respec-tively The design base shear for a specified hazard is calculated by equating the work needed to push the structure monotonically up to the target drift to the energy required by an equivalent EP-SDOF to achieve the same state (Chao SH and Goel SC, 2005). Accordingly, the energy balance relation can be written as (1).
2 ) 2 ( 2 1 ) 2 2 1 ( )
(Ee EP MSv M T Ceg
(1)
In this relation, Ee,Ep are, respectively, the plastic and elastic energy portions required to push the structure up to the target drift, Sv is the design pseudo-spectral velocity, M is the total mass of the structure, is the energy modification factor, Ce is the normalized design pseudo-acceleration, T is the period of the structure and g is the gravity acceleration. According to Fig. 1, the energy modification factor can be obtained as follows:
) max 2 ( 2 1 ) 2 1
( CeWe CYW y
(2) 2 R 1 s 2 (3)In the above equation, parameters Ce,e,CY,max and y are shown in fig. 1, Csis the seismic response coefficient that is calculated based on specific design code; Ω is Over-strength coef-ficient, CY is seismic coefficient in ultimate yield force level, s, y, e are respectively drift in
s
C , CY and Ce level, R is Response modification factor, R
is the ductility reduction factor,s
is the structural ductility factor, which can be written as Eqs. (4) and (5).y C
e C
R (4)
y
u
s
(5)Obtaining of R
are suggested by Chao SH and Goel SC, (2005).Plastic energy is resulted from the external work done by lateral loads, in the form of Eq. (6).
n
i i p
h i F p
E
In above equation Fi is the lateral force at i’th story and hiis the i’th story height from base. Elastic energy is set as Eq. (7), supposing that the structure has been decreased to a single de-gree of freedom system (SDOF)
2 ) g WV 2T ( M 2 1 e E (7)
By substituting Eqs. (6)-(7) in Eq. (1), base shear will be written as Eq. (8).
W e C V 2 2 4 2 (8)
In which
is a dimensionless parameter which depends on the structural stiffness, modal char-acteristics and target drift, which can be calculated from Eq. (9).) 2 2 8 .( 2 . 0 ) 1 1 ))( 1 ( ( g T p T n i n j j h j W n h n W i i (9)
In this equation,
i is the shear distribution factor, which is calculated from Eq. (10).2 . 0 ) ( T n h n W n i j j h j W i n V i V (10) u
and
y are, target and yield drift, respectively, and
p is plastic drift which is calculated from Eq. (11).y u p
(11)
i
W is weight of i’th story, W is the total weight of the structure and is the exponential distribu-tion factor which is selected based on the structural lateral load resisting system. For example in moment and eccentrically braced frames
have been suggested as 0.5 and 0.75 respectively [(Lee SS and Goel SC, 2001), (Chao SH, Goel SC, 2005)]. In this method, the lateral force in the top sto-ry is calculated through Eq. (12), and shear force distribution in the height is assumed as Eq. (13).2 . 0 ) 1 ( T n j j h j W n h n W V n F (12) n V i i i
F ( 1) if i=n then
0
1
i
In above equation V is the base shear , Vn is shear at n’th story and Fi is lateral force at i,th story.
Figure 1: Ideal behavior of structure and concept of balance energy (Chao and Goel, 2005).
3 DUAL SYSTEMS
Dual system is a system in which the resistance against lateral forces is formed through a series of shear walls or braced frames, with a series of moment frames. The shear portion of each series is determined based on their lateral stiffness and their interactions in all stories. Ductility and stiffness are respectively the characteristics of moment frames and braced frames. However, great relative displacements in the upper stories of the moment frames and great story shear in the lower stories of the braced frames are considered to be their problems. Using the moment and braced dual system increases the benefits of each, and decreases their inconvenience. According to the design codes, a system is considered a dual system, if the moment frame bears at least a specified percent of the total shear. In duall frames connection between beam and column, column and foundation and beetween brace and beam is rigid. And connection beetween brace and column is moment release.
In conventional method, to design a dual system, the story shears is divided between each sub-system, according to their stiffness, and then each subsystem is designed based on its shear portion. According to AISC (2010) the moment frame alone must be checked to resist at least 25 percent of the base shear. In the PBPD method presented in this paper, the shear resistant of each subsystem from total shear, is selected and entered to the design process directly. So there is no need to control the minimum resistance of the moment frame as required by the codes.
Generally, the conventional design method does not guarantee the formation of a desired yield mechanism in the structure, whereas the PBPD method has more ability to push the structure to-wards a desired yield mechanism.
Considering the desirable performance of the PBPD method, in moment, concentric and tric braced frames, in this paper, this method is developed to the dual system of moment and eccen-tric braced frame. To this end, three (6 story, 12 story and 20 story) dual system structures are selected. These frames are designed based on the conventional and PBPD method, using the AISC (2010) and IBC (2009) codes. To study the nonlinear behavior and hinge formation mechanism, pushover analysis is used.
4 DEVELOPING THE PBPD METHOD FOR DUAL MOMENT AND ECCENTRICALLY BRACED
FRAMES
Using the performance-based plastic design method, the desired yield mechanism and performance level of the structure must be selected. Three Performance design levels are presented in FEMA 356 code, which are immediate occupancy performance level (IO) (the structure is controlled against an earthquake of 50% occurrence probability in 50 years), life safety performance level (LS) (the struc-ture is controlled against an earthquake of 10% occurrence probability in 50 years) and collapse prevention level (CP) (the structure is controlled against an earthquake of 2% occurrence probabil-ity in 50 years). For each performance level, FEMA 356 has suggested a target ultimate story drift
u .In this study desired yield mechanism in the moment and eccentric braced frame dual system is formation of hinges in the link elements, the formation of moment hinges at the end of the beams and ultimately the formation of hinges at the column bases. Upon selecting the yield mechanism and target drift, base shear will be obtained from Eq. (8).
In the next step, the base shear must be divided between the moment and the eccentric braced frames. Afterwards the base shear of moment and eccentric braced frame subsystems must be divid-ed over the high of each one according to Eq. (13). Knowing the yield mechanism of each subsystem and writing the equilibrium equation between the external work done by external forces and inter-nal work done by interinter-nal forces at hinge locations, the interinter-nal forces can be calculated.
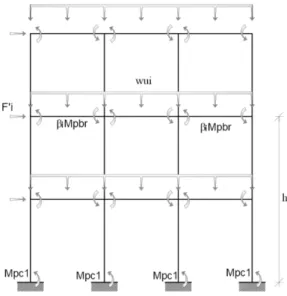
Fig. 2 shows the yield mechanism with the external and internal forces at hinge locations of the moment frame. Writing the energy equilibrium equation leads to Eq. (14) for calculating the beam end moments:
i pc i
i pbr
n
M n h F M
2) 1
( 1 (14)
In this equation
F
i
is external forces of moment frame at story levels (F
i
is obtain from Eq.2 1 .
1 1 1
1 V h
Mpc
(15)1
V
is the column base shear calculating by dividing the frame base shear between columns and h1 is the high of the first story.Figure 2: Maximum expected moment in moment frame.
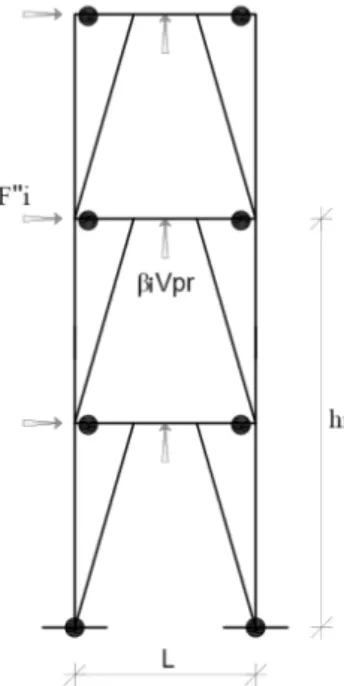
For the Eccentrically braced frame, yield mechanism is selected as shear or flexural hinge in the links, as seen in Fig. 3 Applying lateral force to the bracing system, equalizing the work of external forces to that of internal ones, the maximum expected link shears will be obtained from the follow-ing Eq.
i i i pr
L h F V
(16)
In the above equation Fi is the external force of braced frame at story levels that is obtained from Eq. (13) by assuming
0.75.Upon acquiring design shear at the links, the section design of links is performed based on AISC (2010) code provisions.
i i
pc L bi R bi R
h M M
M F
1 1
1
1 ) ) (17)
In this equation Mbi1)R and Mbi1)L respectively are the maximum expected moment beam
hinges at the right and left side of column.
In above equation, coefficient
i is obtained as follows:
n
i i i
i i n
i i
F i F
i
1( 1)
) 1 (
1
(18)
Then the column end moments and shear force in each story are calculated by applying the ex-pected beam end moments and lateral forces applied at each level.
Figure 3: Maximum Expected shear in braced frame.
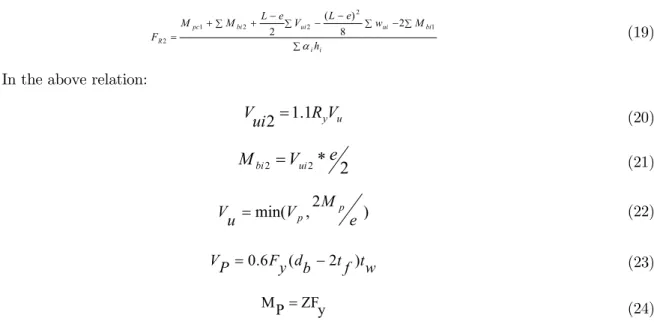
i i bi ui ui bi pc R h M w e L V e L M M F 1 2 2 2 1 2 2 8 ) ( 2 (19)
In the above relation:
u yV
R ui
V 2 1.1 (20)
2
*
2
2
V
e
M
bi
ui (21)) 2 , min(V M e u V p p (22) w t f t b d y F P
V 0.6 ( 2 ) (23)
y ZF P
M (24)
L and e are respectively the length of span and link element and
w
ui is the factored dead and liveload combination at i‘th story. Ry is the ratio of maximum expected yield stress to minimum yield
stress in material.
Figure 5: Lateral force for designing of out of link member in braced frame.
5 PROBABILITY COLLAPSE EVALUATION
One of the effective ways for assessing the vulnerabilityof structures is Seismic risk assesments Fra-gility assesments have an important role in a seismic risk assessment to evaluate the correcty of design method. For obtaining the fragility curve that shows collapse probability in maximum accel-eration ground motion, earthquake records are selected and for each record, maximum inter- story drift is obtained. And by using exponantional regration ( b
as
y ) curve of drift according peak
ground motion acceleraton (PGA) is obtained. And fragility curve derive by using below fragility relation that is developed by Wen et.al (2004).
) (
1 ) (
2 2 2
M CL PGA D
PGA D cl
PGA LS P
(25)
In above equation, is normal standar distribution, and cl is ln (average capacity drift for
specified limit), DPGA is ln(average demand drift for PGA), DPGA is demand uncertainty, CL is
capacity uncertainty and M is is modeling uncertainty. Demand uncertainty obtains from below
equation:
) 1 ln( s2
PGA
D
2
s is standard variance in exponantional regration. CL and M are suggested to be 0.3 (wen et.al
(2004), Bai(2004)). cl For each limit states obtain from FEMA 356. By substituting of required
parameter in Eq.25, fragility curve is drawn.
For collapse evalution selected records must been normalized. scale factor (SF) obtain:
NRT MT
D S
S SSF C ACMR SF
3 % 10
(27)
% 10
ACMR
is collapse margin, that obtain from FEMA P-695. For 2D structure C3D=1, SMT isacceleration response spectrum that obtain from ASCE/SEI 7-05 and SNRT is normalized average
earthquake that obtain from FEMA P-695.
Each record is applied on structures and results are collapse or non-collapse. Collapse limit states are based on table C1-3 in FEMA 356 (2000). According to FEMA P695 If less than one half of the records causes collapse, the structure meets the collapse performance objective and collapse probability of the structure under MCE (Maximum Considered Earthquake) ground motions is accepted.
6 CASE STUDY
Designed structures are in Design category D, site class C and occupancy category II. The design parameters and base shear of the structures for conventional method are calculated based on IBC 2009. These parameters for 12 story structure are included in table 1.
For PBPD method desired performance level of structures is to be Life Safety (LS). The target drift
u for this performance level is suggested to be 0.02. Due to the fact that suggested yielddrifts for moment and eccentrically braced frames are 0.01 (Lee SS and Goel SC, 2001) and 0.005(SH Chao and SC Goel, 2005) respectively, the yield drift in dual frame is assumed to be de-termined as a linear combination of yield drifts in the moment and eccentrically braced frames based on the percentage of their base shear. In this study the moment frames will be designed for 25% of base shear. So the yield displacement for dual frame is calculated as 0.00625. The selected yield mechanism for these structures consists of formation of shear or moment hinges in the hori-zontal link elements of the braced frame, formation of flexural hinges at the end of the beams and finally, formation of hinges at the column bases. The base shears of structures are calculated from Eq. 8. The base shear and parameters of PBPD method for 12 story structure are shown in table 1.
Upon determining the base shear of the moment and eccentrically braced frames, they are dis-tributed over the high of each frame using Eq. (13). Afterwards the beam end moments can be cal-culated from Eq. (14), and then suitable frame sections selected. Similarly link beams in eccentrical-ly braced frames can be designed for the maximum shear calculated from Eq. (16). The designed sections of 12 story moment frame beams and eccentrically braced links are shown in table 2. It can be seen that the link and the flexural beam sections in the PBPD method are smaller than those in the conventional method.
are calculated from Eq. (17) - (18) respectively for the moment and braced frames. Table 3 shows the calculated forces for the 12 story structure .The columns of moment and braced frames will be designed as indicated in section 4. The columns of the ordinary frame will be designed using the conventional methods. Table 4 indicates the characteristics of the column sections of the moment and braced frames of the 12 story structure, designed through the PBPB and conventional methods.
Ordinary method Parameters 12-story PBPD method Parameters 12-story
Ss 1.31 Cs=v/w 0.05
S1 0.45 Ce 0.403
Fa 1 Yield Drift θy (rad) 0.00625
Fv 1.35 Target Drift θu (rad) 0.02
Sds 0.873 µs 3.2
Sd1 0.405 Rµ 3.2
Building Height (m) 36 0.527
Ta (sec) 0.717 2.918
Cu 1.4 v/w 0.029
T (sec) 1 Design Base Shear V (kg-f) 30945
Sa 0.403
I 1
R 8
Total Building Weight W (N) 1063132 Design Base Shear V (kg-f) 53602
Table 1: Design parameter in PBPD method in 12 story frame.
Link section Moment beam section
story PBPD conventional PBPD conventional
12 IPE140 IPE180 IPE140 IPE180
11 IPE140 IPE200 IPE160 IPE240
10 IPE140 IPE200 IPE160 IPE240
9 IPE140 IPE200 IPE180 IPE270
8 IPE180 IPE270 IPE180 IPE270
7 IPE180 IPE270 IPE180 IPE270
6 IPE180 IPE300 IPE200 IPE270
5 IPE180 IPE330 IPE200 IPE240
4 IPE200 IPE330 IPE200 IPE240
3 IPE200 IPE360 IPE200 IPE220
2 IPE200 IPE360 IPE200 IPE220
1 IPE200 IPE330 IPE200 IPE220
IPE is European standard universal I beams (I section) with parallel flanges.
Moment Frame Braced frame
Story Vu1(kgf) Mb1(kgf.cm) iFR1(kgf) Vu2(kgf) Mb2(kgf.cm) iFR2(kgf)
12
11 1505.9 37646.4 178.94 10723.15 268078.8 2632.48
10 1505.9 37646.4 125.05 10723.15 268078.8 2110.45
9 2015.9 50397.6 96.47 10723.15 268078.8 1764.45
8 2015.9 50397.6 77.16 17378.06 434451.6 1490.94
7 2015.9 50397.6 62.55 17378.06 434451.6 1258.26
6 2683.8 67095.6 50.65 17378.06 434451.6 1050.26
5 2683.8 67095.6 40.4 17378.06 434451.6 857.47
4 2683.8 67095.6 31.28 20401.92 510048 675.53
3 2683.8 67095.6 22.92 20401.92 510048 501.33
2 2683.8 67095.6 15.04 20401.92 510048 331.99
1 2683.8 67095.6 7.46 20401.92 510048 165.46
M PC (kgf.cm) 90184.25
Table 3: Rrequired parameter for designing of out of link and flexural beam members in PBPD method, in different srories of 12 story frame (kg, cm).
PBPD method Ordinary method
Story Braced frame moment frame Braced frame moment frame
12 Box20x20x2 Box20x20x1 Box10x10x1 Box10x10x1
11 Box25x25x2 Box20x20x2 Box10x10x1 Box20x20x1
10 Box25x25x2 Box25x25x2 Box15x15x1 Box20x20x1
9 Box25x25x2 Box25x25x2 Box15x15x1 Box20x20x1
8 Box30x30x2 Box25x25x2 Box15x15x1 Box20x20x1
7 Box30x30x2 Box25x25x2 Box15x15x1 Box20x20x1
6 Box30x30x2 Box25x25x2 Box20x20x1 Box20x20x1
5 Box30x30x2 Box25x25x2 Box20x20x1 Box20x20x1
4 Box30x30x2 Box25x25x2 Box20x20x2 Box20x20x1
3 Box30x30x2 Box25x25x2 Box20x20x2 Box20x20x1
2 Box30x30x2 Box25x25x2 Box25x25x2 Box20x20x1
1 Box30x30x2 Box25x25x2 Box30x30x2 Box20x20x1
Table 4: Column section in different stories of 12 story frames.
In BOXa*b*c, a is width of section, b is depth of section and c is thickness of sec-tion.dimensions are in mm.
7 PERFORMANCE EVALUATION
7.1 Static Nonlinear Analysis
To evaluate the performance behavior of structures designed based on the two methods, a static nonlinear analysis is conducted. For static nonlinear analysis the equivalent static load pattern is selected and the structures are pushed over a specified drift of roof.
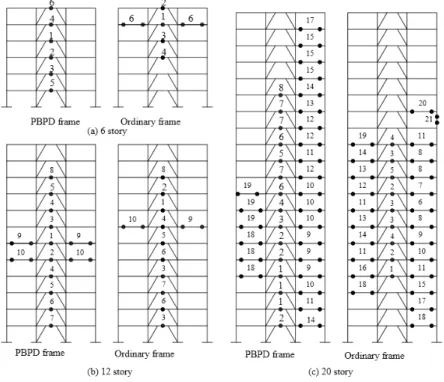
The target drift of each structure under the design earthquake spectrum is calculated and the performance of structures designed based on PBPD method is compared with structures designed based on the conventional method. Several factors are compared. The first factor is the hinge mation and yield mechanism of the structures. Fig .6 shows the number and order of hinge for-mation at the same roof drift of the structures. In general it is seen that the number of hinges in the structures designed by PBPD method are more than the hinges in the structure designed by con-ventional method. For example, the number of hinges in the 20 story structures is 41 and 31 for structures that are designed by PBPD and conventional method respectively. It is also seen that in the 20 story structure that is designed by conventional method one column is yielded, however no column is yielded in the Structures that are designed by PBPD method. It can be concluded that more energy is dissipated in Structures that are designed by PBPD method and expected yield mechanism is nearly reached.
Figure 6: Comparion of hinge formation order.
respec-tively. It is also seen from the figure that in structures that are designed by conventional method the strength drop is accrued in less drift than Structures that are designed by PBPD method. This drop is due to strength drop in some member hinges. It can be concluded that however the struc-tures that are designed by conventional method have more strength and less hinges but the plastic deformation are concentrated in some members. But in PBPD method structures the plastic defor-mation are distributed over more members.
As it is shown in Figure: 7 performance points obtains from intersection between spectrum curve and pushover curve according to FEMA440 (2005).
(a) 6 story frames
(b) 12 story frames
(c) 20 storyframes
Figure 7: Pushover curve in two frames. 0
20 40 60
0 0,005 0,01
drift Pushover curve and
Performance point
Spectrum curve
Ordinary Pushover curve
0 20 40 60 80 100
0 0,005 0,01 0,015
drift
Pushover curve and Performance point
Spectrum curve
Ordinary Pushover curve
PBPD Pushover curve
0 20 40 60 80 100 120
0 0,01 0,02
drift
Pushover curve and Performance point
Spectrum curve
Ordinary Pushover curve
Base shear (t
onf)
Base shear (t
onf)
Base shear (t
The ductility demand of structures at target drift is shown in Table 5. It obtains from dividing the target drift over the yield drift. It is seen that the ductility demand of Structures that are de-signed by PBPD method are more than the structures that are dede-signed by conventional method. So it can be concluded that PBPD method can better include ductility of the structures in design process.
Frame µ (ductility demand )
6- story PBPD method 4.4
6- story ordinary method 2.6
12- story PBPD method 3.3
12- story ordinary method 1.9
20- story PBPD method 3
20- story ordinary method 1.6
Table 5: Structural ductility demand of different frames.
The story drift and base shear at performance point are 0.01 and 38 ton for 12 story frame that is designed by PBPD method and 0.0075 and 90 ton for 12 story frame that are designed by ordi-nary method. Figure.8 shows the link rotation at the performance point for both structures that are designed by PBPD and ordinary method. It is seen from the figure that the maximum link rotation of the Frame that is designed by PBPD method at the performance point is larger than the frame that are designed by ordinary method. However it is less than maximum allowable (according to FEMA 356, CP limit state is 0.14 rad). For example, maximum amount of link rotation in 20 sto-ries Frame that is designed by PBPD method is 0.05 rad and in 20 story frame that are designed by ordinary methods is 0.03 rad. It is also seen that, in 6 story frame that are designed by ordinary method link rotation suddenly increase at 5th story which is more than the CP limit this is due to poor design method that concentrats all plastic deformation in few members. In general it can be concluded that in PBPD method the plastic deformations are distributed over the height but in frames that are designed by ordinary method they are concentrated at some elements which may lead to unexpected damages.in the other words the rate of variation in distribution of plastic defor-mation in ordinary method is not as uniform as PBPD method.
(a) 6 story frames (b) 12 story frames
(c) 20 story frames
Figure 8: Link plastic rotation of two frames in performance point. 0
1 2 3 4 5 6
0,00 0,05 0,10 0,15 0,20 0,25
story
link rotation(rad)
link rotation in 6 story frame
PBPD method ordinary method
0 2 4 6 8 10 12
0,000 0,050 0,100 0,150
link rotation (rad) link rotation in 12 story
frame
PBPD Method ordinary method
0 2 4 6 8 10 12 14 16 18 20
0,00 0,04 0,08
story
link rotation (rad) link rotation in 20 story
frame
PBPD method ordinary method
(a) 6 story frames (b) 12 story frames
(c) 20 story frames 0
1 2 3 4 5 6
0,00 0,01 0,02
story
inter-story drift
inter-story drift in 6 story frame
PBPD Method
0 2 4 6 8 10 12
0,00 0,01 0,02
story
inter-story drift (cm) inter-story drift in 12 story
frame
PBPD Method
ordinary method
0 2 4 6 8 10 12 14 16 18 20
0,00 0,00 0,01 0,01 0,02
story
inter-story drift
inter-story drift in 20 story frame
PBPD Method
7.2 Probabilistic Collapse Evalution
In this section, according to FEMA P695 (FEMA P695, 2009) collapse probability of the Frames that are designed by PBPD and ordinary method have been evaluated. For this purpose, the fragil-ity curve of each frame is obtained. For obtaining the Fragilfragil-ity curve and collapse evaluation, in this study, 22 records of Los Angles earthquakes are selected (SAC steel ground motion). Charac-ters of selected ground motion are in Table.6. Fragility curves for the CP limit state are obtained based on Eq.25. Table.7 calculates requirement parameter for obtaining fragility curve in 12 story frames that are designed by PBPD and ordinary method. Figure.10 compares the fragility curves of 6, 12 and 20 stories frames that are designed by PBPD and ordinary method. Figure shows that for a specific PGA, Collapse probability in Frames that are designed by PBPD method is lower than frames that are designed by ordinary method. For collapse evaluation, selected records are normal-ized according to FEMA P695 and then applied to each frame. Results are classified as collapsed and non-collapsed frames (FEMA P695, 2009). Collapse limit states are based on table C1-3 in FEMA 356 (2000). According to FEMA P695. If less than one half of the records cause collapse, the structure meets the collapse performance objective and collapse probability of the structure under MCE (Maximum Considered Earthquake) ground motions is accepted. In this study normal-ized records are applied to 6, 12 and 20 stories frames that are designed by PBPD and ordinary method. Results show that frames that are designed by PBPD and ordinary method have accepta-ble collapse probability and structures meet target collapse limit. The number of earthquakes that cause collapse in the PBPD and ordinary structures are shown in Table 8.
SAC Name Record Duration (sec) PGA (cm/sec2)
LA01 Imperial Valley, 1940, El Centro 39.38 452.03
LA03 Imperial Valley, 1979, Array #05 39.38 386.04
LA05 Imperial Valley, 1979, Array #06 39.08 295.69
LA07 Landers, 1992, Barstow 79.98 412.98
LA09 Landers, 1992, Yermo 79.98 509.7
LA11 Loma Prieta, 1989, Gilroy 39.98 652.49
LA13 Northridge, 1994, Newhall 59.98 664.93
LA15 Northridge, 1994, Rinaldi RS 14.945 523.3
LA17 Northridge, 1994, Sylmar 59.98 558.43
LA19 North Palm Springs, 1986 59.98 999.43
LA21 1995 Kobe 59.98 1258
LA23 1989 Loma Prieta 24.99 409.95
LA25 1994 Northridge 14.945 851.62
LA27 1994 Northridge 59.98 908.7
LA29 1974 Tabas 49.98 793.45
LA31 Elysian Park (simulated) 29.99 1271.2
LA33 Elysian Park (simulated) 29.99 767.26
LA35 Elysian Park (simulated) 29.99 973.16
LA37 Palos Verdes (simulated) 59.98 697.84
LA39 Palos Verdes (simulated) 59.98 490.58
LA41 Coyote Lake, 1979 39.38 578.34
LA43 Imperial Valley, 1979 39.08 140.67
Frame a b R2 M CL D/PGA λCL)CP
PBPD 2.37 0.88 0.51 0.3 0.3 0.64 1.6
Ordinary 2.75 1.09 0.58 0.3 0.3 0.67 1.6
Table 7: Requirement parameter for obtaining fragility curve in 12 story frame.
(a) 6 story frames
(b) 12 story frames
(c) 20 story frames
Figure 10: Fragility curve in frames that are designed by PBPD and ordinary method. 0
0,5 1
0 2 4 6
P(CP/PGA)
PGA(g)
fragility curve in 6 story frame
CP(PBPD)
CP(ordinary)
0 0,5 1
0 5 10
P(CP/PGA
)
PGA (g)
fragility curve in 12 story frames
CP(PBPD)
CP(ordinary)
0 0,5 1
0 5 10 15 20
P(CP/PGA)
PGA(g)
fragility curve in 20 story frames
CP(PBPD)
Number of story PBPD method ordinary method
6 11/22 6/22
12 11/22 7/22
20 9/22 5/22
Table 8: Number of Earthquake that cause collapse in structures.
8 CONCLUSION
After designing the structures by the PBPD and ordinary methods, and applying the nonlinear static and dynamic analysis to the structures, the following results are obtained:
• The number of hinges in the structures designed by PBPD method is more than the hinges in the structures designed by conventional method. It can be concluded that more energy is dis-sipated in structures that are designed by PBPD method. It is also seen that in the structures that are designed by conventional method unexpected mechanism may occure.
• The stiffness and strength of structures that are designed by PBPD method are less than structures that are designed by conventional method. In structures that are designed by con-ventional method the plastic deformation are concentrated in some members and strength drop may occure. But in structures that are designed by PBPD method the plastic defor-mation are more distributed over the structure.
• The ductility demand of structures that are designed by PBPD method is more than the structures that are designed by conventional method.
• The maximum story drift and link rotation of the Frames that are designed by PBPD meth-od at the performance point are larger than the frames that are designed by ordinary methmeth-od. However they are less than the acceptable limits. In Frames that are designed by PBPD method the plastic deformations are distributed over the height, but in frames that are de-signed by ordinary method they are concentrated at some stories and members which may lead to unexpected damages.
• The structures that are designed by PBPD method have less strength and more ductility de-mands than frames that are designed by ordinary method. It means that in PBPD method ductility of structures is better conducted to the design of structures.
• Results show the frames that are designed based on PBPD and ordinary methods have ac-ceptable collapse probability and both structures meet target collapse limit.
REFERENCE
Bai J.W.,(2004) “ Seismic Fragility and retrofitting for a reinforced concrete flat-slab structure.” Master’s Thesis. Texas A&M university, Collage Station, TX.
Banihashemi, M.R. Mirzagoltabar, A.R. Tavakoli. H.R. (2015). “Performance-based plastic design method for steel concentric braced frames”. International Journal of Advanced Structural Engineering (IJASE). 7:281-293. DOI: 10.1007/s40091-015-0099-0.
Bayat,. and Chao, S.-H., Goel, S. C, and Liao, W.-C. (2010). “Performance-based plastic design (PBPD) method for earthquake-resistant structures: an overview”. The Structural Design of Tall and Special Buildings. 19:115-137. DOI: 10.1002/tal.547.
Chao SH and Goel SC. (2006a). “A seismic design method for steel concentric braced frames for enhanced perfor-mance”. 4th international conference on earthquake engineering. Taipei. Taiwan.
Chao SH and Goel SC. (2006b). “Performance based seismic design of special truss moment frames”. 4th internation-al conference on earthquake engineering. Taipei. Taiwan.
Chao SH. Goel SC. (2006). “Performance-based design of eccentrically braced frames using target drift and yield mechanism”. AISC Engineering Journal Third quarter: 173–200.
Chao SH. Goel SC. (2008). “Performance-based plastic design of seismic resistant special truss moment frames”. AISC Engineering Journal. Second quarter: 127–150.
Chao SH. Goel SC. Lee S-S. (2007). “A seismic design lateral force distribution based on inelastic state of structures”. Earthquake Spectra. 23( 3):547–569. DOI: http://dx.doi.org/10.1193/1.2753549.
Chao SH. Goel SC. (2005). “Performance-Based Seismic Design of EBF Using Target Drift and Yield Mechanism as Performance Criteria”. Report No. UMCEE 05-05. Department of Civil and Environmental Engineering. University of Michigan. Ann Arbor. MI.
Dasgupta P. Goel SC. Parra-Montesinos G. Tsai, K.C (2004). “Performance-based seismic design and behavior of a composite buckling restrained braced frame (BRBF)”. In Proceedings of Thirteenth World Conference on Earth-quake.
Er-Gang Xiong. Fei-Fei Cui. Liang Bai. Han He. (2016). “Performance-Based Plastic Design Method for Steel Con-centrically Braced Frames Using Target Drift and Yield Mechanism”. Periodica Polytechnica Civil Engineering. 60(1):127-134. DOI: 10.3311/PPci.7383.
FEMA 356, (2000). “Pre-standard and Commentary for the seismic Rehabilitation of Buildings”. Prepared by the American Society of Civil Engineers for the Federal Emergency Management Agency. Reston. VA.
FEMA 440, (2005), “Improvement of nonlinear static seismic analysis procedure”. Prepared by the Applied Technol-ogy Council for department of homeland security federal emergency management agency. Washington. D.C.
FEMA P695, (2009), “Quantification of building seismic performance factors”. Prepared by the Applied Technology Council for the Federal Emergency Management Agency. California.
Goel SC. Chao SH. (2008). “Performance-Based Plastic Design: Earthquake Resistant Steel Structures”. International Code Council. Washington. DC.
Housner GW. (1956). “Limit design of structures to resist earthquakes”. In Proceedings of First World Conference on Earthquake Engineering. Earthquake Engineering Research Institute. Berkeley.
Karamodin A. Zanganeh A.(2016) “Seismic Performance of couple shear wall with steel link using PBPD method”, Sharif journal.
Khampanit.A. Leelataviwat. S. Kochanin. J. Warnitchai. P. (2014). “Energy-based seismic strengthening design of non-ductile reinforced concrete frames using buckling-restrained braces”. Engineering Structures. 81:110-122. DOI: 10.1016/j.engstruct.2014.09.033
Lee SS and Goel SC. (2001). “Performance-Based Design of Steel Moment Frames Using Target Drift and Yield Mechanism”. Report No. UMCEE 01-17. Department of Civil and Environmental Engineering. University of Michi-gan. Ann Arbor. MI.
Leelataviwat S. Goel S C and Stojadinović B. (1999). “Toward Performance-Based Seismic Design of Structures”. Earthquake Spectra. 15 (3): 435-461. DOI: http://dx.doi.org/10.1193/1.1586052.
Leelataviwat S. Saewon W. Goel SC. (2007). “An energy based method for seismic evaluation of structures”. In Pro-ceedings of Structural Engineers Association of California Convention. SEAOC 2007. Lake Tahoe. CA.
Liao. W. –C. Goel. S. C. and Chao. S. -H. (2010). “Performance Based Plastic Design (PBPD) of RC special mo-ment frame structures”. Concrete under Severe Conditions. 2: 1631 -1638. DOI: 10.1201/b10552-224.
Liao. W.-C. and Goel S. C. (2012). “Performance-based plastic design and energy-based evaluation of seismic re-sistant RC moment frame”. Journal of Marine Science and Technology. 20(3): 304–310.
Roeder. C. W. and Popov. E. P. (1977). “Inelastic Behavior of Eccentrically Braced Steel Frames Under Cyclic Load-ings”. Report No. UCB/EERC-77/18. Earthquake Engineering Research Center. University of California at Berkeley. SAC steel ground motion, “Suites of Earthquake Ground Motions for Analysis of Steel Moment Frame Structures”, http://nisee.berkeley.edu/data/strong_motion/sacsteel/ground_motions.html.
Sahoo. D.-R. and Chao. S. H. (2010). “Performance-based plastic design method for buckling-restrained braced frames”. Engineering Structures. 32: 2950–2958. DOI: 10.1016/j.engstruct.2010.05.014.
Shayanfar. M.A. Rezaeian. A.R. Zanganeh. A. (2014). “Seismic performance of eccentrically braced frame with verti-cal link using PBPD method”. THE STRUCTURAL DESIGN OF TALL AND SPECIAL BUILDINGS. 23(1): 1-21. DOI: 10.1002/tal.1015.
Swapnil B. Kharmale. Siddhartha Ghosh. (2013). “Performance-based plastic design of steel plate shear walls”. Jour-nal of ConstructioJour-nal Steel Research. 90: 85-97. DOI: 10.1016/j.jcsr.2013.07.029.