Optimization of Saddle Coils for Magnetic Resonance Imaging
Carlos Ernesto Garrido Salmon, Edson Luiz G´ea Vidoto, Mateus Jos´e Martins, and Alberto Tann´us Instituto de F´ısica de S˜ao Carlos, Universidade de S˜ao Paulo, CEP 13560-970, S˜ao Carlos, SP, Brazil
Received on 15 September, 2005; accepted on 28 November, 2005
In Nuclear Magnetic Resonance (NMR) experiments, besides the apparatus designed to acquire the NMR signal, it is necessary to generate a radio frequency electromagnetic field using a device capable to transduce electromagnetic power into a transverse magnetic field. We must generate this transverse homogeneous mag-netic field inside the region of interest with minimum power consumption. Many configurations have been proposed for this task, from coils to resonators. For low field intensity (<0.5 T) and small sample dimensions (<30 cm), the saddle coil configuration has been widely used. In this work we present a simplified method for calculating the magnetic field distribution in these coils considering the current density profile. We propose an optimized saddle configuration as a function of the dimensions of the region of interest, taking into account the uniformity and the sensitivity. In order to evaluate the magnetic field uniformity three quantities have been analyzed: Non-uniformity, peak-to-peak homogeneity and relative uniformity. Some experimental results are presented to validate our calculation.
Keywords: Magnetic ressonance imaging; Saddle coils
I. INTRODUCTION
In Nuclear Magnetic Resonance (NMR) experiments, be-sides the apparatus designed to acquire the NMR signal, it is necessary to generate a radio frequency electromagnetic field using a device capable to transform electromagnetic power into a transverse magnetic field. We should generate this transverse homogeneous magnetic field inside the region of interest (ROI) with the minimum power consumption or, using the reciprocity principle, with the maximum signal to noise ratio. There are two major classes of transducers, designated by coils when it is possible to separate from the resonating structure, normally a tank circuit, the inductive (magnetic field generating) parts from the capacitive parts. In another class the transducers are designated by resonators, meaning that the whole magnetic generating structure has to be thought of as a resonator.
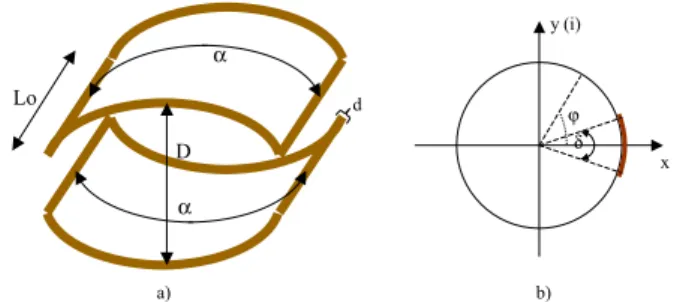
Many configurations have been proposed for that function, from coils to resonators. For low field intensity (<0.5 T,<21 MHz for 1H) and small sample dimensions (<30 cm), the saddle coil configuration has been used widely. The princi-pal reason is its simplicity in both the construction and tuning processes. A saddle coil is represented by at least four conduc-tors (called rungs or rods) on the surface of a circular cylinder oriented in the z direction. In this work we use the configura-tion sketched in Fig. 1. High order coils (i.e.: more than four rods) will not be analyzed in this paper. This basic configura-tion has four geometric parameters: diameter (D), length (Lo), angular aperture (α)and width of the conductors (d).
The task to design such coils is to optimize the electromag-netic problem with two determinant factors: uniformity and efficiency. We must know the electromagnetic field distribu-tion to estimate both factors. Therefore some electromagnetic model is assumed for the calculation. When the wavelength of the driving RF is large compared with the maximum dimen-sion of the coil the retardation effects are negligible. The prob-lem becomes a quasi-static calculation with an upper limit on the frequency. Thus the Biot-Savart law can be utilized for
a) b)
D Lo
α
α
d
x y (i)
δ ϕ
FIG. 1: a) General sketch of a four finite width rungs saddle coil con-figuration. The letters indicate the geometric parameters: diameter, length, angular aperture and width of the conductors; b) Representa-tion of a unique conductor on the surface coil in the complex plane (z=0); the polar angle (ϕ)and theδparameter are indicated in the figure.
the calculation of the magnetic field. On the other hand, when the conductors on the circumference of the coil are allowed to have widths of the same order of magnitude as the coil di-ameter, it is known that the conductors can no longer be ap-proximated simply as single wires [1-3]. This is because the distribution of current within the finite-width conductors is not known, and must consequently be determined. The problem could be a one-dimensional and frequency independent prob-lem regarding the skin depth much less than the thickness of the foil. Finally, if we restrict the frequency between upper and lower limits, then the current distribution depends only of the geometry of the conductor. Hence an optimization process considering only geometric parameters can be carried out.
the uniformity in a large volume, but he assumed a filament model for the current distribution [8]. Other authors have op-timized for non-ideal conductors [1,2], only for a particular volume of interest. In some applications the sample almost fills the whole coil interior volume (e.g. in receptor coils) and in other cases the sample is small compared with the coil dimensions (e.g. in whole body transmission coils). Accord-ingly, it is useful to optimize the transducer, considering the relative sample dimensions.
In this paper we propose a simple analytic procedure to es-timate the current density profile in finite width conductors in a saddle coil configuration. Using this profile we optimize the angular aperture calculating numerically the magnetic field distribution for different ROI dimensions. In the optimization process three quantities related to uniformity are evaluated. Each one of them will be defined in the next section.
II. METHODOLOGY
In this work, the four rungs are arranged around the cir-cumference of a circular cylinder of diameter D=25.6 cm for head images (see Fig. 1-a). We use a method similar to that presented by other authors [1,2], using conformal mapping [9], to compute the current distribution within the finite width conductors. However, in order to obtain an analytic solution, a more simplified method was applied [10]. The electrostatic potential was calculated for an isolated rung considering the perturbation of other rungs as second order. This approach is valid when the rods are not very close to one another. Thus the transverse component of the electric field on the conductor surface is expressed (in the complex plane, Fig. 1-b) as:
Et(ϕ) =−
λ·√1+c2
π·ε0·a
cos(ϕ)·sen2(ϕ)
(1+cos(ϕ))·pcos2(ϕ)−c2·sen2(ϕ)·(cos(ϕ)−i·sen(ϕ)) (1)
where,ϕis the polar angle,λis the charge linear density and c is the width coefficient cot(δ/4). The rung width (d) was expressed in degrees,δgarameter, as the angle subtended on the circular perimeter. Null rung width (e.g.δ=0 ˚ ) represents a wire with infinitesimal width, i.e., a filament model.
The resultant electric field at each point was calculated us-ing the equation (1) and applyus-ing the superposition principle
considering the four rungs in different angular positions. The final current density within each conductor has the same dis-tribution as the normal component of the total electric field in each point. Thus, the current density is found according to the condition:
Jz(ϕ) =
r µ ε·
h
ˆ
n1·~Et(ϕ)−nˆ2·~Et(ϕ+α)−nˆ3·~Et(ϕ−π) +nˆ4·~Et(ϕ−π+α)
i
(2)
Here, ˆni denotes the normal to the conducting surface in
each rod and the angular aperture (α)is the angular distance between the rod centers in the same saddle.
We applied the Biot-Savart law to calculate the magnetic field distribution inside of the ROI considering the current density distribution obtained in (2). The region-of-interest was defined by a 20-cm-diameter circle located in the cen-tral transverse plane (z=0) of the coil. This ROI is similar to a human head. In order to evaluate the uniformity of magnetic field three quantities were computed: Non-uniformity (NU), peak-to-peak homogeneity (Inh) and relative uniformity (RU). These parameters are the more commonly used by many de-signers [1,3,8,11]. Curiously no one used more than one quan-tity on the uniformity evaluation. We calculate all of them because each one has its different meaning.
Non-uniformity is the root mean square deviation relative to mean field value (Bm):
NU=σ/Bm·100 (3)
The peak-to-peak homogeneity is the difference between maximum and minimum values, expressed in percentage of the field at the coil center or center field (Bc):
Inh= (Bmax−Bmin)/Bc·100 (4) The relative uniformity (RU) represents the percentage ar-eas within±5% field deviation relative to Bc:
∆=|B-Bc|/Bc·100 (5)
Two saddle coils with different angular aperture were con-structed and compared (optimized and non-optimized, details in the next section). Both coils were used as receivers to ac-quire Magnetic Resonance images. The experimental mag-netic field distribution was obtained from the images (SE, TR/TE=2000/32 ms, FOV=256 mm) of a homogeneous cylin-drical phantom (2 mM CuSO4). The visualization of the RF
maps was improved using a median filter 8x8 combined with a noise threshold [12]. The measurements were carried out in a 0.5 T homemade MRI machine (ToRM 05) using a homo-geneous whole-body RF coil for transmission.
III. RESULTS AND DISCUSSION
The angular aperture (α)and rung width (δ)were varied in a saddle configuration with a practical Lo/D ratio close to 1. The magnetic field distribution in the ROI was determined us-ing the computation procedure commented in the last section. The results are presented in the figures 2-5.
Different optimum aperture values for each uniformity quantity (130 ˚ for NU, 125 ˚ for RU and 135 ˚ for Inh), can be noted from Figs 2-4. It suggests that each one doesn’t rep-resent the same result and so it have different meanings. The peak-to-peak homogeneity has more information about the more distant points in the ROI because it uses the maximum and minimum values (Equation 3). The relative uniformity is a criterion to evaluate the central area of the ROI because it is referred to the central field (Equations 4 and 5). The non-uniformity is a more global parameter. It contains information about the entire ROI (Equation 2), thus the standard deviation turns out to be a convenient procedure for field homogeneity evaluation as in magneto-static problems [13]. Accordingly, for coil design the meaning of each RF uniformity quantity must be taken in account, especially in large ROI.
FIG. 2: Plot of the non-uniformity (NU) versus aperture angular for different rung width of the saddle coil described in the text.
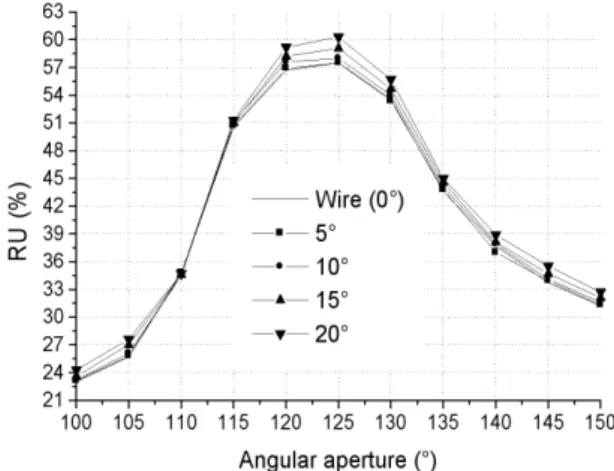
For the three quantities, a larger conductor represents more uniformity. These findings are in agreement with a previous result [1]. The greatest improvement is 20% from wire to foil
FIG. 3: Plot of the relative uniformity (RU) versus aperture angular for different rung width of the saddle coil described in the text.
FIG. 4: Plot of the peak-to-peak homogeneity (Inh) versus aperture angular for different rung width of the saddle coil described in the text.
in the peak-to-peak homogeneity (Fig. 4). Also for all these quantities, the optimum angular aperture is independent of the rung width. Fig. 5 shows independence of the foil dimensions and the coil’s sensitivity. This parameter is the field generated by current unit at the coil center (Bc).
in-FIG. 5: Plot of the sensitivity (Bc, central field strength) versus aper-ture angular for different rung width of the saddle coil described in the text.
dependent of the ROI dimension and the uniformity quantity. Long coils must be constructed with larger aperture angles.
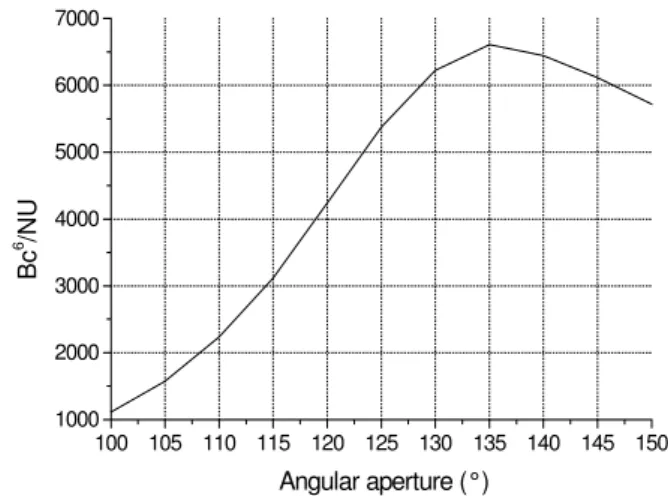
It is very difficult to define an optimum design due to the competition between the different factors (see figure 2 and 5). The uniformity and the sensitivity must be taken in account, but their relative weight is unknown. Accordingly, we im-posed a trade-off. We defined a figure of merit considering the sensitivity six times more important than the non-uniformity. This function can be used in order to compare different de-signs. Fig. 7 shows the behavior of the figure of merit here defined, for a ROI with 60 % of total circular area of the coil (Di≈0.77·D). So the optimum angular aperture for our case is around 135 ˚ .
0,2 0,3 0,4 0,5 0,6 0,7 0,8
118 120 122 124 126 128 130 132 134 136
Non-uniformity (Finite length) Peak-to-peak (Finite length) Non-uniformity (Infinite length) Peak-to-peak (Infinite length)
Angular a
pertur
e
(°)
Di/D
FIG. 6: Graph of the optimum angular aperture versus dimension of the ROI using two parameters for finite and infinite rods.
In order to test our calculus, two coils were constructed with similar length (≈27 cm), diameter (≈26 cm) and rung width (≈15 ˚ ), but different angular aperture. The non-optimized coil had 108 ˚ and the optimized coil had 135 ˚ . The figures 8 and 9 illustrate the theoretical and experimental maps of the magnetic field distribution. Besides the visual similarity
be-100 105 110 115 120 125 130 135 140 145 150 1000
2000 3000 4000 5000 6000 7000
Bc
6 /NU
Angular aperture (°)
FIG. 7: Figure of merit as a function of angular aperture for Di≈0.77·D.
tween theoretical and experimental maps, a quantitative cor-respondence was obtained (Table I). Some differences could be attributed to the phantom effect because we do not consider the load.
-100 -50 0 50 100 -100
-50 0 50 100
Axis X (mm)
A
x
is
Y
(mm)
-100 -50 0 50 100
-100 -50 0 50 100
Axis X (mm)
A
x
is
Y
(mm)
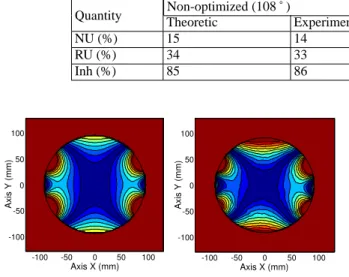
FIG. 8: Magnetic field distribution maps of the non-optimized coil (description in the text): a) Theoretic b) Experimental. Each contour represents 2 % non-uniformity. The black circle delimited the ROI. The red region inside the ROI indicated non-uniformity larger than 20 %.
IV. CONCLUSIONS
Different quantities can be defined to evaluate of RF field uniformity. The meaning of each quantity must be taken into account in the RF coil design, especially in large ROI. The non-uniformity using the root mean square deviation is the more global criterion for field uniformity evaluation.
The more sensible parameter in the saddle coil optimization is the angular aperture. In these coils the optimum angular aperture is independent of rung width; however, a larger con-ductor obtains slightly more uniformity, in agreement with a previous result [1]. The coil’s length has a slight effect on the RF uniformity. Another important factor in the optimization process is the ROI size.
TABLE I: Table I: Comparative results between theoretical and experimental magnetic field maps for optimized and non-optimized coils (Figs. 8 and 9).
Quantity TheoreticNon-optimized (108 ˚ )Experimental TheoreticOptimized (135 ˚ ) Experimental
NU (%) 15 14 10 9
RU (%) 34 33 41 46
Inh (%) 85 86 51 57
-100 -50 0 50 100 -100
-50 0 50 100
Axis X (mm)
Axis Y (
m
m
)
-100 -50 0 50 100 -100
-50 0 50 100
Axis X (mm)
A
x
is
Y
(mm)
FIG. 9: Magnetic field distribution maps of the optimized coil (de-scription in the text): a) Theoretic b) Experimental. Each contour represents 2 % non-uniformity. The black circle delimited the ROI. The red region inside the ROI indicated non-uniformity larger than 20 %.
propose a figure of merit considering the sensitivity six times more important than the non-uniformity. In this case for a ratio ROI/coil diameters close to 0.8 the optimum aperture is 135 ˚ .
We have demonstrated a simple model to determine the cur-rent density inside finite-width conductors in a four-rods sad-dle coil. The calculus model results were corroborated with experimental data.
Acknowledgments
The author CEGS is grateful to FAPESP Brazilian agency for partial financial support. We acknowledge Jos´e C. Gazziro and Odir A. Canevarollo for their involvement in constructing the RF coils.
[1] J. W. Carlson, Magn. Reson. Med. 3, 778 (1986).
[2] L. K. Forbes, S. Crozier, and D. M. Doddrell, Meas. Sci. Tech-nol. 6, 284 (1995).
[3] S. Li, Q. X. Yang, and M. B. Smith, Magn. Reson. Imag. 12, 1079 (1994).
[4] D. M. Ginsberg and M. J. Melchner, Rev. Sci. Instr. 11, 122 (1970).
[5] R. P´erez de Alejo et al., Magn. Reson. Med. 51, 869 (2004). [6] M. A. Macngauhtan et al., Anal Bional. Chem. 378, 1520
(2004).
[7] J. T. Heverhagen et al., MAGMA 17, 80 (2004). [8] H. Hanssum, Appl. Phys. 19, 493 (1986).
[9] E. Durand, ´Electrostatique, Tome II Probl`emes G´en´eraux
Conducteurs. Paris, Mason et Cie, 1966. Cap.4, p.234-347: Grandeurs complexes et transformations conformes.
[10] C. E. Garrido, 2005. Development and clinical applications of a high performance radio-frequency/gradient coil integrated sys-tem for Magnetic Resonance Imaging in 0.5 Tesla. Appendix B. PhD. Thesis. Physical Institute of S˜ao Carlos. University of S˜ao Paulo.
[11] Ch. M. Collins et al., J. of Magn. Reson. 125, 233 (1997). [12] K. P. Pruessman et al., Magn. Reson. Med. 42, 952 (1999). [13] J. Teles, C. E. Garrido, and A. Tann ´us, J. Phys. D: Appl. Phys.