Abstract— With the increase in demand to Backbone networks, one became fundamental the application of new telecommunication technologies for efficient use of devices and optical links, such as xPSK modulations with dual polarization, dispersion compensating fibers, coherent detection and digital processing signals. Thus, network planning using analytical models have been proposed in the last years for this purpose. In this paper we propose the use of numerical simulations in wavelength-division multiplexing networks planning via a novel iterative method with high-performance processing, which does an analysis of the quality of transmission in transparent networks.
Index Terms—Optical fiber networks, Coherent communications, Cross-layer design.
I. INTRODUCTION
Optical networks can fall into four broad categories: access, metropolitan, datacenter and backbone.
Access networks are the interface with the end-user, mainly, they are based on tree topologies using
time, frequency and wavelength multiplexing technologies. Metropolitan networks aggregate access
data in multi-ring topologies. Wavelength Division Multiplexing (WDM) with Intensity Modulation/
Direct Detection (IM/DD) is the current technology to interconnect the nodes in optical networks.
A typical datacenter contains thousands of servers arranged into one or more clusters [1]. Clusters
are further networked through layers of cluster aggregation switches, which are then connected to
datacenter routers. The datacenter routers connect to the rest of the network through Internet points of
presence (POPs), where traffic flows from datacenter networks to end users and vice versa. Long haul
WDM systems provide the connectivity between datacenters and population centers in different metro
areas. Metro WDM transport links are used to interconnect datacenters and POPs located within the
same metro area.
The Backbone or long-haul networks, which are the main focus of this paper, cover a wide
geographical area with fiber spans ranging from hundred to thousands of kilometers. In backbone
A Multilayer Approach for Optical Network
Planning
Bruno C. Coutinho, Fabio O. Lima,
Federal Institute of Espírito Santo, Brazil. ([email protected], [email protected])
Ivan T. Lima Jr
Electrical and Computer Engineering Department North Dakota State University, Fargo, ND USA. ([email protected])
Anilton Salles Garcia, Marcelo E. V. Segatto
networks fiber resources are scarce, expensive and time consuming to acquire and build. Most of the
existing networks are based on Optical Transport Network (OTN) technology [2], [3] with a wide
range of line rates. Recently International Telecommunication Union (ITU) made an update on ITU-T
Rec. G.709 to add 100 Gb/s transport capability.
To maximize the utilization of the optical fibers, such networks need to provide high spectral
efficiency and, at the same time, minimize the number of regenerators since they cause a significant
increase in Capital Expenditure (CapEx) and Operational Expenditure (OpEx). Coherent optical
systems [4] with electronic digital signal processing techniques make use of joint phase, amplitude,
and polarization encoding to achieve high spectral efficiency. Phase modulation also results in larger
Amplified Spontaneous Emission (ASE) noise tolerance and longer unregenerated reach.
State-of-the-art commercial coherent receivers use polarization-division multiplexed quaternary phase shift keying
(PDM-QPSK) modulation. Such systems can achieve 100 Gb/s transmission on 50 GHz ITU channel
grid. Other benefits of coherent receivers include high tolerance to Polarization Mode Dispersion
(PMD) and Chromatic Dispersion (CD) since practically all the PMD and CD effects can be corrected
with linear digital electronic filters at the expense of energy consumption [5]. The spectral efficiency
of coherent PDM-QPSK modulation is 4 bits/symbol. Higher spectral efficiency requires more
complex modulation schemes and higher Optical Signal to Noise Ratio (OSNR).
In all-optical networks the signals undergo changes due to the accumulation of the physical-layer
impairments, which generates a degradation of the quality of transmission (QoT), hence an ”link by
link” analysis must be performed to take account wavelengths have arrived degraded at a particular
Reconfigurable Optical Add/Drop Multiplexers (ROADM) node [6]. For this type of network analysis
we propose an approach based on iterations. However, for this type of simulation to be feasible, the
use of high performance computing platforms such as the Graphics Processing Unit (GPUs) is
essential due to the high computational cost required.
Optical reach is the distance an optical signal can travel before the signal quality degrades to a level
that necessitates regeneration. Many factors affect the optical reach; for example, the type of
amplification, the launched power of the signal, and the modulation format of the signal. Compared to
the 500 km optical reach of traditional systems, the optical reach of long-haul systems currently being
deployed is on the order of 2000 to 4000 km.
In this paper we present a multilayer network planning tool called Optical Network Design and
Analysis (ONDA). ONDA is a collection of softwares modules that can combine physical topology
design, optimized optical equipment placement, routing wavelength assignment, and physical layer
simulation including IM/DD, coherent transmission and Optical Orthogonal Frequency Division
Multiplexing (OOFDM) transmission systems. This tool can be used to design access, metropolitan,
datacenter and backbone networks but this paper is focused only in backbone networks with coherent
transmission.
the strategies we have adopted for the problem of the backbone network planning. Section III presents
details of the coherent transmission system we have used in our simulations. The planning tool is
presented in Section IV. All the validation process and an example of network planning are presented
in Section V. Finally, we draw our conclusions in Section VI.
II. NETWORKPLANNINGSTRATEGY
In this paper we consider the network design problem for todays realistic backbone networks. We
assume that at least the physical topology and a set of traffic demands are provided. The size, i.e. the
number of nodes of most of known networks range from ten to one hundred nodes [7].
Optical backbone networks typically operate in the C-band portion of the spectrum with fixed grid
by ITU standard ITU G.694 [8]. Each network node can be equipped with ROADMs to route
wavelength connections optically, a set of transponders with bit rates ranging from 10 Gb/s to 100
Gb/s [9]. Spectral efficiency is achieved with optical coherent technology for line rates higher than 40
Gb/s. Optical Amplifiers (AO) and Dispersion Compensation Modules (DCM) can be used in each
node or at intermediate nodes where there is no traffic exchange.
Planning a network is often a multi objective task with conflicting restrictions. Our primary goal is
to minimize CapEx and maximize the network throughput while minimizing the overall network
energy consumption. To produce such optimal networks it is necessary to deploy computationally
complex algorithms that require a huge amount of time for the design of realistic networks. A
planning tool for optical network must perform at least the following tasks [10]:
Compute Physical Layer Impairments
The signal’s QoT is degraded by physical impairments, such as Attenuation, ASE noise, CD
or Group Velocity Dispersion (GVD) [11], PMD [12], Polarization Dependent Loss (PDL)
[13], Self Phase Modulation (SPM), Cross-phase Modulation (XPM), Four Wave Mixing
(FWM) and Cross-polarization Modulation (XPolM) [14]–[16]. For systems based on IM/DD
technology it is possible to compute the QoT using analytical and semi-analytical models
[17], [18]. For coherent systems it is necessary to solve a modified version of the nonlinear
Schrödinger equation to incorporate the polarization effects to obtain a more precise value for
the QoT [19]. Unfortunately this set of equations can not be solved analytically.
Compute routes with or without protection
Each traffic demand between a pair of nodes has to be mapped into a set of ligthpaths. If the
demand is smaller or equal to the transponder capacity, only one ligthpath will be used. The
planning tool is responsible for finding the routes for all demands taking into account the
protection required by the user. Many different algorithms can be used to find the shortest
path, the k-shortest path or the shortest cycle. A study dedicated to these algorithms is found
in the book [20].
Given the physical topology, the planning tool has to find the minimum combination of
ROADMs and regenerators since they are the most expensive items of the network. The
ROADM degree is basically defined by the node physical degree [17]. Each ROADM placed
increases the number of optical amplifiers used in the network and compromises the optical
reach of each ligthpath. Usually, the regenerators are placed in the same site of the ROADM
[10].
Allocate Optical Amplifier
The amplifier placement is a very important step in any planning tool. Four parameters must
be taken into account: Gain, gain tilt (or ripple), saturation power, and the amplifier Noise
Figure (NF). Gain and NF have a direct impact on the optical reach, since they are related to
the received power and OSNR.
Assign Wavelengths
A key parameter is the maximum number of wavelengths per fiber. It is possible to compute a
lower bound for the number of wavelengths of a given physical topology [7]. The planning
tool can use a variety of algorithms to find the best combination of wavelengths inside the
ITU grid [21]. A survey of the physical layer impairments aware routing and wavelength
assignment algorithms in optical networks was presented in [18].
III. COHERENTSYSTEMS
In a typical coherently-detected PDM-QPSK system, the data traffic is mapped into I and Q signals,
in-phase and quadrature, respectively in two orthogonal states of polarization. At the transmitter side,
a Mach Zehnder Modulator (MZM) is used to modulate the optical field. The propagation link is, in
general, composed of, single-mode fibers and optical amplifiers with or without dispersion
management [22]. At the receiver, a laser is used as the local oscillator for coherent detection and two
hybrid 90 degree interferometer enable the detection of the complete electric field of the input optical
signal. After the signals are obtained by the detector, they are converted to digital format by the A/D
converter. Then, the Digital Signal Processing module (DSP) performs a series of operations to
recover the transmitted data [9].
At the receiver, a DSP module performs chromatic dispersion compensation using Finite Impulse
Response (FIR) filters [23]. The signal is sampled every seconds and recovered with tap weights
given by [24]
, (1)
where , is an upper bound and
, (2)
where is the GVD and the total propagation distance. For example, for a 1000 km
filter of 401 taps is required to compensate the accumulated dispersion in the link [22].
Because PMD is a stochastic impairment, it is necessary a dynamic channel equalization. Such
compensation can be achieved by using FIR filters through the Continuous Modulus Algorithm
(CMA) [25], which is a blind algorithm. These filters are organized in a Butterfly structure, and are
constantly updated to follow the disturbances of the channel. They can be modeled in the Jones matrix
of the transmission line. Then, the equalizer task is to estimate the inverse Jones matrix, in order to
reverse the signal degradation caused by the impairments along the transmission. A modified version
of CMA was used in this study to avoid the singularity problem [26].
The carrier phase estimation (Viberti and Viberti (V&V) [27]), which is the last compensation
module used in our simulations, is used to retrieve and subsequently remove the remaining phase
mismatch, , between the local oscillator and the signal [23]. The estimation of the inconsistency is
made in the central sample only, using the following algorithm: first, the m-th power of the complex
symbol is considered for the purpose of removing any encoded information in the signal phase (m
being the amount of phase modulation levels, 4 in the QPSK case). Second, an average window of
elements is calculated by summing the result over the previous symbols and the subsequent symbols. Then, the argument is taken, since we are interested only in phase. Finally, the
resulting phase is divided by m to correct the initial lift for m-th power. For the range of – to , we
have [24]:
. (3)
At the end of this process, an unwrapping function is used to allow large time-varying excursions of
the signal phase, as for instance when a carrier frequency detuning with respect to the local oscillator
is present.
IV. THEPLANNINGTOOL
As stated in Section I we have developed a multilayer network planning tool called Optical
Network Design and Analysis (ONDA). ONDA is a collection of software modules that can combine
physical topology design, optimized optical equipment placement, routing, wavelength assignment,
and physical layer simulation, including IM/DD, coherent transmission and OOFDM transmission
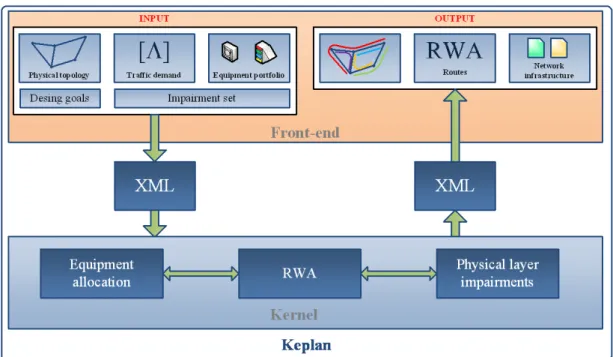
Fig. 1. The optical network planning tool.
The main module of the software package ONDA is called Keplan (Kernel for Planning) [17]. As
shown in Figure 1, it is divided in two main parts: Front-end and Kernel. The Front-end is responsible
for the pre- and pos-processing. The input parameters are i) the physical topology of the network
including traffic exchange nodes, amplification and/or regeneration sites, fiber cables, and their
characteristics; ii) the traffic matrix demands, which include a variety of traffic, such as 1GbE,
10GbE, STM-16 to STM-256 and OTU1 to OTU4 [3], iii) an equipment portfolio with all kinds of
transponders, optical amplifiers, DCMs, and ROADMs available; iv) a set of impairments for the
network planning, and v) the design goals.
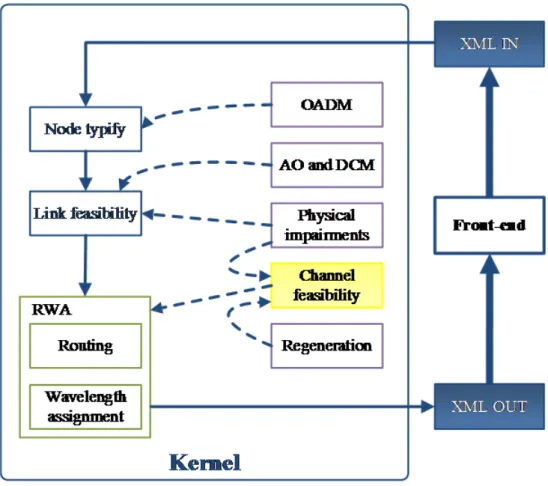
An eXtensible Markup Language (XML) parser is used to exchange data between Kernel and
Frontend. Figure 2 shows the Kernel in details. It starts the planning process by identifying network
nodes to be configured as ROADM, taking into account the required demands and the physical
topology connections. After that, the phase of link feasibility optimally places optical amplifiers and
DCMs, minimizing the costs with equipments and ensuring the signal power levels. Lastly, the
routing is solved with the required protection and a simplified solution for wavelength allocation is
provided, thus completing a solution to the Routing and Wavelength Assignment (RWA) problem. In
the routing, either the shortest path or the minimum disjoint cycle is used. The network optimization
in carried out using the generalized version of Suurballe [28], providing the minimal length cycle,
with the minimum of sharing nodes for the minimum of sharing links possible. The practical
feasibility and the location of the regenerators are checked in this module, taking into consideration
Fig. 2. The kernel in details.
Finally, a numerical analysis is performed on the planned routes to verify the QoT of the WDM
channels, considering the linear and non-linear impairments. This analysis is done link by link,
assuming that the network is opaque (nrun = = 1), i.e., all optical channels begin and end on the same
link. The data from this first stage are stored for use in other runs, when the network is considered
transparent (nrun > 1), i.e., a link can receive optical channels coming from other links of the
network.
Algorithm 1 describes the proposed approach in this paper to the planned ligthpaths analysis. First,
the numerical simulator takes as input the general parameters (line 1.1), such as: (i) path of the XML
file generated by the Keplan, (ii) number of symbols, points per symbol and modulation format, (iii)
the OSNR level, (iv) the symbol rate (v) the characteristics of transmission and reception lasers, (vi)
the characteristics of the coherent detector and (vii) the parameters of the DSP modules.
Using the XML file generated by the Keplan module (line 1.2), the simulator captures information
concerning the spacing, ITU channels, network nodes and their functions, fiber segments and their
parameters, amplifiers, links, ligthpaths, optical channels associated with each ligthpath, interfaces of
each node, ROADMs, and DCMs. With these data, the generation of a matrix of lambdas versus links
(line 1.3) is mounted to store the information concerning optical network ligthpaths.
After reading the input arguments, the simulator starts the scanning of the links (line 1.5), from first
Algorithm 1: Proposed approach.
times (line 1.4), considering that in the first run the network is opaque. The #RUNS - 1 remaining runs
already consider the channels bypass via ROADMs nodes of the network (line 1.10), which are the
transparent runs. An ideal amount of runs is equal to the number of links pertaining to the longest
ligthpath of the network.
For each link, one can verify the fiber segments which compose it and what the channels generated
from the first node to the last node of this link are (lines 1.6-1.8). Then, PDM-QPSK signals are built
for each channel (in case the first run and/or this channel starts in this link), or it is checked whether
the channel has been stored from a previous iteration (lines 1.9-1.15) for the transparent runs.
is propagated in the fiber segments of the link (line 1.18). For each arrival node, the node type is
checked: Amplifier, DCM (line 1.19), or ROADM (line 1.24). If the node is a ROADM, the reception
of each channel is performed (line 1.24).
For each lambda, the source and the target are checked (line 1.27). If a channel is not intended for a
given network node, the data is stored for later retrieval (line 1.32). Otherwise, the channel is
coherently detected and goes through the DSP module, getting the lowest Q-Factor value at the end
[29], considering the components of polarization, phase, and quadrature (lines 1.28 to 1.30). These
Q-Factor values are assigned to the link in which the lambda ends. All the simulation results are written
to log files.
V. RESULTS
We start our analysys with the validation of the physical layer simulator using as a reference the
experiments performed by Mussolin et al. in [30]. It consists of an 100 Gb/s PDM-QPSK coherent
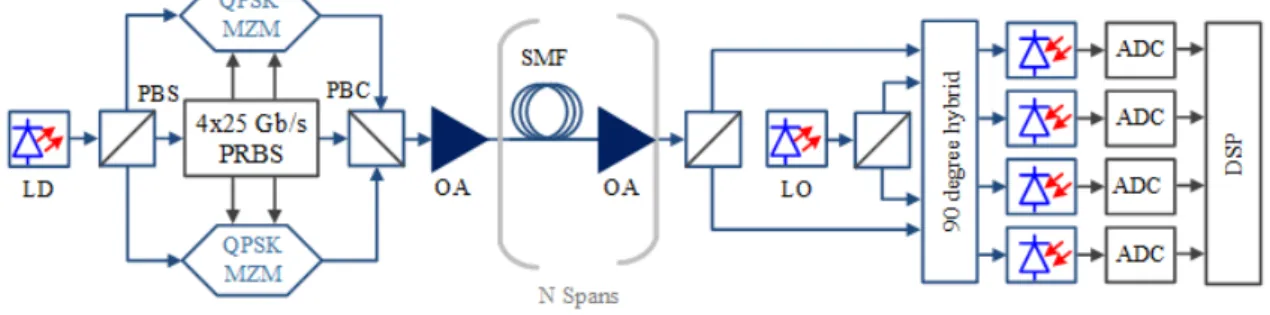
optical transmission system with 16 WDM channels and 50 GHz spacing as shown in Figure 3.
Fig. 3. 100 Gb/s PDM-QPSK coherent optical transmission system with 16 WDM channels and 50 GHz spacing used for validation purposes.
The transmitter consists of two IQ MZMs driven by a Pseudo-Random Bit Sequence (PRBS) De
Bruijn grade 15, with 32-bit delay between I (in-phase) and Q (quadrature) and of 915 bits between
the polarizations. The transmission link consists of a loop of 63.6 km of SSMF and Erbium Doped
Fiber Amplifiers (EDFA). The fibers were modeled with the Coupled Nonlinear Schrödinger
Equations(CNLSE), whose solution was obtained with the Split-step Fourier Algorithm (SSFA) with
adaptivestep size [19], [31]. The fiber dispersion at the central wavelength was 16.3 ps/(nm.km).
In our simulations we have used a receiver with 2 Hybrid 90 degrees interferometers perfectly and
balanced photodetectors, where the optical noise was added to the received signals for OSNR levels
of 15 dB and 20 dB. The data sampling is performed at a rate of 2 samples per symbol. The DSP
performs the chromatic dispersion and PMD compensations with standard linear equalization.
The simulations have been performed using a total of 16 loops representing 1017.6 km of fiber
without optical dispersion compensation. Figure 4 shows the received signal for the central
wavelength following respectively the A/D conversion, chromatic dispersion compensation,
via V&V.
Fig. 4. Received signal for the central wavelength after 1017.6 km of fiber without optical dispersion compensation.
In order to validade our physical layer simulator we have performed Bit Error Rate (BER)
measurements considering the central wavelength and the input optical power ranging from -1.2 dBm
to 1.6 dBm. Figure 5 shows the comparison between the results of our simulations and the
experimental results reported in [30].
Fig. 5. Comparison between the experimental results presented in [30] and the physical layer simulator developed in this paper.
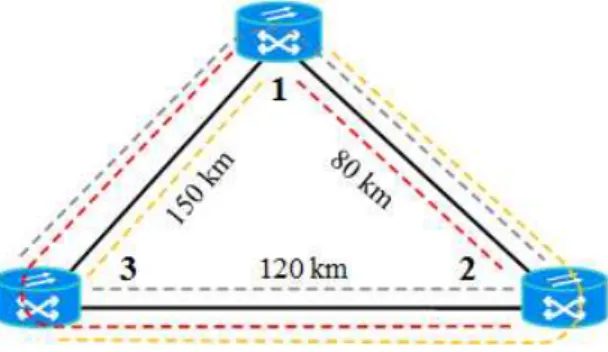
After the validation process of the physycal layer simulator with one link, we have started the
validation process for the Keplan using a three-nodes network with distances between each pair of
nodes of 80 km, 120 km, and 150 km as illustrated in Fig. 6. The input file contains a description of
the physical topology including 3 mid-span sites for optical amplifier and DCM placement, optical
fiber characteristics, the equipment portifolio and traffic demands. In this case, we have considered
Fig. 6. Network with 3 ROADM nodes (1 to 3). Links of the 80-150 km. Dashed lines representing the bidirectional optical lightpaths.
As expected for this case, the Keplan has returned 12 lightpaths and three wavelengths as shown in
Table I. Three optical amplifiers and three DCM have been allocated at the mid span sites. The
amplifier gain for each amplifier correspond to the overall span losses including the ROADMs. We
have tested two wavelength assingment algorithms, Firstfit and Random with all wavelengths in the
C-band. The results for the Q-factor are presented in columns 4 and 5 respectively. A route is feasible
only if its before Forward Error Correction (FEC) [9], [32]–[34]. It corresponds to a
Q-Factor dB. For Firstfit 4 lightpaths are not feasible while for Random only two lightpaths
are not allowed. The arrows in the last column indicate an increase ( ) or a decrease ( ) in the
Q-factor for the Random algorithm when compared to Firstfit.
TABLE I.THE 3-NODES NETWORK.
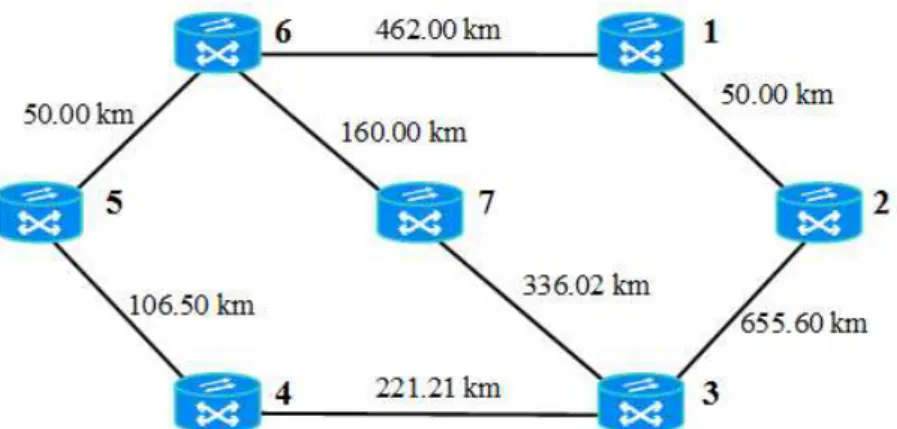
We also have analysed a 7-nodes mesh network considering realistic distances for an OTN as
illustrated in Fig. 7. For this mesh network the distance between node range from 50 km to 655.60
km. Our goal is to compare the number of feasible routes considering opaque and transparent
simulations. The demand matrix contain 21 bidirectional demands of OTU4 channels, standard
transponder modules.
Fig. 7. An example of mesh network with 7 nodes and 8 links.
Keplan has returned all optical lightpaths, a cromatic number of 82 and lightpaths ranging from 1 to
5 hops. The most occupied link has 14 wavelengths while the least occupied has only 5. We have used
Firstfit to assign the wavelengths since it represents the worse case scenario. All wavelengths are in
the C-band.
For the physical layer simulations we have used symbols, 64 points per symbol, symbol rate
used is 28 Gbaud/s with NRZ sinc pulses, samplingrate = 56 GSample/symbol and ENOB = 12 bits.
The CMA convergence parameter used was with the number of taps optimized for each link of
the network.
TABLE II.LINK NUMBER FOR THE 7-NODES MESH NETWORK.
representing the results of the opaque and transparent simulations respectively. For the transparent
simulation we have considered #RUNS = 5. The feasibilty analyses was based on the Q-Factor =
2.67dB. In both tables and L represent the number of the wavelengths and the link number,
respectively. Each colored rectangle represents: blue: start node, gray: bypass node, green: end node
with a feasible lightpath, and red: end node with a nonfeasible lightpath. Most of the lightpaths in the
opaque and transparent simulations are feasible but for example = 4 wich starts at link number 5,
goes through link number 8 and ends at link 10 is approved in the opaque run, but it is disapproved in
the transparent run. For the opaque run we have had 22 failed channels witch represents around 27%.
This number is doubled after the transparent run.
In the ”red” category, results apparently most obvious are those in which the channel is approved in
through by ROADMs nodes interacting with other co-propagating channels on different wavelength
grids. However, we can emphasize some interesting cases in the reported results. First, in the opaque
run, we had two links of 50 km (links 10 and 13) with 2 out of 14 channels disapproved. Considering
the nonlinear length for a multichannel system, given by [23]
, (4)
where is the total launched power, is the nonlinearity coefficient, and C is the
amount of co-propagating channels; we have for these links = 14mW, C = 14 and
, then
28km < 50km. This means that these lambdas were penalized by nonlinear
effects, i.e, the XPM and XPolM influenced the QoT of some channels.
We have another ”intriguing” case when some lambdas are disapproved in the opaque run, but they
are approved in transparent run. This is overtly due to the fact the co-propagating channels can be
influenced by different lambdas along their lightpaths through interaction between linear and
nonlinear effects, similar to the soliton system. What we can note here is an adjustment or
accommodation of the channel when they are going through the links (e.g.: links 10 and 26).
VI. CONCLUSIONS
Optical networks using ROADM and tunable lasers are on track to evolve to all-optical mesh
networks in the near future. Transparent networks allow the data to be kept in the optical domain and,
thus, causing considerable reduction in project costs. However, physical impairments degrade the
signal along the transmission when the signal is transmitted through one or more links, therefore
limiting the system reach. Thus, special techniques such as coherent detection and digital signal
processing have to be used to retrieve the optical channels degraded during its propagation, such as in
100 Gb/s systems.
The physical layer impairments is the main focus of the Optical Network Design and Analysis
(ONDA) suite. Therefore, an iterative approach from an opaque initial run was proposed in this paper
as a solution to the design of practical networks. We validated the tool for one link through an 100
Gb/s PDM-QPSK coherent optical transmission system with 16 WDM channels and 1017.6 km of
fiber without optical dispersion compensation. Then, a three-node network planning was performed to
study the behavior of lightpaths with a few changes in the coloring step.
Finally, some preliminary results were obtained through a semi-realistic seven-nodes network to
allow the verification of the requirement of a link-by-link analysis, with accumulation of distortions,
for the design of transparent networks. Despite the need for substantial use of computing power in
numerical simulations using intensive parallel computing in GPUs, the approach was effective and
identified a possibility of all-optical networks analysis with higher accuracy in measuring the ITU
REFERENCES
[1] C. Lam, H. Liu, B. Koley, X. Zhao, V. Kamalov, and V. Gill, “Fiber optic communication technologies: What’s needed for datacenter network operations?” IEEE Communications Magazine, vol. 48, no. 7, pp. 32–39, Jul. 2010.
[2] ITU-T, “Recommendation G.709/Y.1331 (02/2012). Interfaces for the optical transport network,” Feb. 2012. [3] ——, “Recommendation G.872 (2001). Architecture of optical transport networks,” 2012.
[4] E. Ip and J. Kahn, “Fiber impairment compensation using coherent detection and digital signal processing,” IEEE Journal of Lightwave Technology, Journal, vol. 28, no. 4, pp. 502–519, Feb. 2010.
[5] B. Pillai, B. Sedighi, K. Guan, N. Anthapadmanabhan, W. Shieh, K. Hinton, and R. Tucker, “End-to-end energy modeling and analysis of long-haul coherent transmission systems,” IEEE Journal of Lightwave Technology, Journal, vol. 32, no. 18, pp. 3093–3111, September 2014.
[6] B. J. Solé-Pareta, S. Subramanianm, D. Careglio, and S. Spadaro, “Cross-Layer Approaches for Planning and Operating Optical Impairment-Aware Optical Networks,” Proceedings of the IEEE, vol. 100, no. 5, p. 12, 2012.
[7] M. Cousineau, P. Perron, C. G., M. Paiva, and M. Segatto, “RWA problem with geodesics in realistic OTN topologies,” Optical Switching and Networking, vol. 15, no. 0, pp. 18–28, 2015.
[8] ITU-T, “Recommendation G.694.1 (02/2012). Spectral Grids for WDM Applications: DWDM Frequency Grid,” 2012. [9] E. Lach and W. Idler, “Modulation formats for 100G and beyond,” Optical Fiber Technology, vol. 17, no. 5, pp. 377–
386, Oct. 2011.
[10]J. M. Simmons, “Network design in realistic ”All-Optical” backbone networks,” IEEE Communications Magazine, vol. 44, no. 11, pp. 88–94, November 2006.
[11]G. P. Agrawal, Nonlinear Fiber Optics, 4th ed. Academic Press, 2007.
[12]D. Marcuse, C. R. Menyuk, and P. K. A. Wai, “Application of the Manakov-PMD equation to studies of signal propagation in optical fibers with randomly varying birefringence,” IEEE Journalof Lightwave Technology, vol. 15, no. 9, pp. 1735–1746, 1997.
[13]D. Wang and C. Menyuk, “Calculation of penalties due to polarization effects in a long-haul WDM system using a stokes parameter model,” IEEE Journal of Lightwave Technology, vol. 19, no. 4, pp. 487–494, Apr. 2001.
[14]M. Karlsson and H. Sunnerud, “Effects of nonlinearities on PMD-induced system impairments,” IEEE Journal of Lightwave Technology, no. 11, pp. 4127–4137.
[15]Y.-H. Wang and I. Lyubomirsky, “Impact of DP-QPSK pulse shape in nonlinear 100 G transmission,” IEEE Journal of Lightwave Technology, Journal, vol. 28, no. 18, pp. 2750–2756, 2010.
[16]A. Bononi and P. Serena, “Which is the dominant nonlinearity in long-haul PDM-QPSK coherent transmissions?” in 36th ECOC, no. 0, 2010, pp. 19–21. [Online]. Available: http://ieeexplore.ieee.org/xpls/abs all.jsp?arnumber=5621217. [17]F. O. Lima, “Strategies for optical transport network planning,” PhD, Federal University of Espírito Santo, 2015, in
portuguese.
[18]S. Azodolmolky, M. Klinkowski, E. Marin, D. Careglio, J. Pareta, and I. Tomkos, “A survey on physical layer impairments aware routing and wavelength assignment algorithms in optical networks,” Computer Networks, vol. 53, no. 7, pp. 926–944, 2009.
[19]O. Sinkin, R. Holzlöhner, J. Zweck, and C. Menyuk, “Optimization of the split-step Fourier method in modeling optical-fiber communications systems,” Journal of Lightwave Technology, vol. 21, no. 1, p. 61, 2003. [Online]. Available: http://www.opticsinfobase.org/abstract.cfm?id=71748.
[20]R. Bhandari, Survivable Networks: Algorithms for Diverse Routing, ser. The Springer International Series in Engineering and Computer Science. Springer, 1999. [Online]. Available: https://books.google.com.br/books?id=SIkfR0lAN1wC.
[21]H. Zang, J. P. Jue, and B. Mukherjee, “A review of routing and wavelength assignment approaches for wavelengthrouted optical wdm networks,” Optical Networks Magazine, vol. 1, no. 1, pp. 47–60, 2000.
[22]I. Kaminow, T. Li, and A. Willner, Optical Fiber Telecommunications Volume VIB: Systems and Networks, ser. Optics and Photonics. Burlington, MA: Elsevier Science, 2013.
[23]G. Li, “Recent advances in coherent optical communication,” Advances in Optics and Photonics, vol. 1, no. 2, p. 279, Feb. 2009.
[24]S. J. Savory, “Digital coherent optical receivers: Algorithms and subsystems,” IEEE Journal of Selected Topics in Quantum Electronics, vol. 16, no. 5, pp. 1164–1179, Sep. 2010.
[25]D. Godard, “Self-recovering equalization and carrier tracking in two-dimensional data communication systems,” IEEE Transactions on Communications, vol. 28, no. 11, pp. 1867–1875, 1980.
[26]L. Liu, Z. Tao, W. Yan, S. Oda, T. Hoshida, and J. C. Rasmussen, “Initial tap setup of constant modulus algorithm for polarization de-multiplexing in optical coherent receivers,” Optical Fiber Communication Conference and National Fiber Optic Engineers Conference, no. 2, p. OMT2, 2009.
[27]A. Viterbi, “Nonlinear estimation of psk-modulated carrier phase with application to burst digital transmission,” IEEE Transactions on Information Theory, vol. IT-29, no. 4, 1983.
[28]J. W. Suurballe and R. E. Tarjan, “A quick method for finding shortest pairs of disjoint paths,” Networks, vol. 14, no. 2, pp. 325–336, 1984.
[29]F. Zhang, Y. Luo, Y. Wang, and L. Li, “Experimental comparison of different BER estimation methods for coherent optical QPSK transmission systems,” IEEE Photonics Technology Letters, vol. 23, no. 18, pp. 1343–1345, 2011. [30]M. Mussolin, M. Forzati, J. Martensson, A. Carena, and G. Bosco, “DSP-based compensation of nonlinear impairments
in 100 Gb/s polmuxQPSK,” in Transparent Optical Networks (ICTON), 2010 12th International Conference on. IEEE, 2010, pp. 1–4.
[32]M. Nölle, J. Fischer, L. Molle, C. Schmidt-Langhorst, D. Peckham, and C. Schubert, “Comparison of 8 x 112 Gb/s PS-QPSK and PDM-QPSK signals over transoceanic distances,” Optics Express, vol. 19, no. 24, Nov. 2011.
[33]K. Balemarthy, “Long-Haul Optical Fiber Networks: 100 Gbps and Beyond,” International Conference on Fiber Optics and Photonics, pp. 13–15, 2012.
![Fig. 5. Comparison between the experimental results presented in [30] and the physical layer simulator developed in this paper](https://thumb-eu.123doks.com/thumbv2/123dok_br/18888216.424345/10.892.249.654.493.793/comparison-experimental-results-presented-physical-layer-simulator-developed.webp)