ACPD
8, 20901–20924, 2008Source apportionment of
PAHs by CSRA
R. J. Sheesley et al.
Title Page
Abstract Introduction
Conclusions References
Tables Figures
◭ ◮
◭ ◮
Back Close
Full Screen / Esc
Printer-friendly Version
Interactive Discussion Atmos. Chem. Phys. Discuss., 8, 20901–20924, 2008
www.atmos-chem-phys-discuss.net/8/20901/2008/ © Author(s) 2008. This work is distributed under the Creative Commons Attribution 3.0 License.
Atmospheric Chemistry and Physics Discussions
This discussion paper is/has been under review for the journalAtmospheric Chemistry
and Physics (ACP). Please refer to the corresponding final paper inACPif available.
Source apportionment of elevated
wintertime PAHs by compound-specific
radiocarbon analysis
R. J. Sheesley, M. Krus ˚a, P. Krecl, C. Johansson, and ¨O. Gustafsson
Department of Applied Environmental Science (ITM), Stockholm University, 10691 Stockholm, Sweden
Received: 1 September 2008 – Accepted: 7 October 2008 – Published: 12 December 2008
Correspondence to: R. J. Sheesley ([email protected])
ACPD
8, 20901–20924, 2008Source apportionment of
PAHs by CSRA
R. J. Sheesley et al.
Title Page
Abstract Introduction
Conclusions References
Tables Figures
◭ ◮
◭ ◮
Back Close
Full Screen / Esc
Printer-friendly Version
Interactive Discussion Abstract
Natural abundance radiocarbon analysis facilitates distinct source apportionment be-tween contemporary biomass/biofuel (14C “alive”) versus fossil fuel (14C “dead”) com-bustion. Here, the first compound-specific radiocarbon analysis (CSRA) of atmospheric polycylic aromatic hydrocarbons (PAHs) was demonstrated for a set of samples col-5
lected in Lycksele, Sweden a small town with frequent episodes of severe atmospheric pollution in the winter. Renewed interest in residential wood combustion means than this type of seasonal pollution is of increasing concern in many areas. Five individ-ual/paired PAH isolates from three pooled fortnight-long filter collections were ana-lyzed by CSRA: phenanthrene, fluoranthene, pyrene, benzo[b+k]fluoranthene and in-10
deno[cd]pyrene plus benzo[ghi]perylene; phenanthrene was the only compound also analyzed in the gas phase. The measured ∆14C for PAHs spanned from −138.3‰ to 58.0‰. A simple isotopic mass balance model was applied to estimate the frac-tion biomass (fbiomass) contribution that was constrained to a range of 71% for in-deno[cd]pyrene+benzo[ghi]perylene to 87% for the gas phase phenanthrene and par-15
ticulate fluoranthene, respectively. Indeno[cd]pyrene plus benzo[ghi]perylene, known to be enhanced in gasoline-powered motor vehicle exhaust compared to diesel ex-haust, had the lowest contribution of biomass combustion of the measured PAHs by 9%. The total organic carbon (TOC, defined as carbon remaining after removal of inor-ganic carbon)fbiomasswas estimated to be 77%, which falls within the range for PAHs. 20
This CSRA data of atmospheric PAHs demonstrate the non-uniformity of biomass com-bustion contribution to different PAHs even in a location with limited local emission sources and illustrates that regulatory efforts would not evenly reduce all PAHs.
1 Introduction
Polycyclic aromatic hydrocarbons (PAHs) are ubiquitous in the atmosphere and are pri-25
ACPD
8, 20901–20924, 2008Source apportionment of
PAHs by CSRA
R. J. Sheesley et al.
Title Page
Abstract Introduction
Conclusions References
Tables Figures
◭ ◮
◭ ◮
Back Close
Full Screen / Esc
Printer-friendly Version
Interactive Discussion Some PAHs are very well known carcinogens and several studies indicate a negative
impact of atmospheric PAHs on human and ecological health (Busby et al., 1997; Hed-berg and Johansson, 2006; Choi et al., 2006; Sauvain et al., 2003; Schwarze et al., 2007). To abate the adverse health effects caused by these pollutants, source appor-tionment studies are needed to inform effective strategies and air quality regulations to 5
control PAH emissions.
Apportioning PAHs to a specific combustion source can be difficult (Hays et al., 2003; Schauer et al., 2002, 2001; McDonald et al., 2003). Differences due to biomass or fossil fuel type and to combustion conditions determine PAH ratios (Benner et al., 1995; Yan et al., 2005; Yunker et al., 2002), and can confound efforts to apportion PAHs 10
in an environmental sample; this also limits their utility as generic biomass or fossil fuel combustion tracers as very location- and source-specific profiles are needed for accurate apportionment (Mandalakis et al., 2004a; Lima et al., 2005). Factor-analysis-based source apportionment, such as principal component analysis and positive matrix factorization (PMF), has been used to attempt to define source contributions to PAHs 15
with mixed success (Larsen and Baker, 2003). The advantage to methods like PMF is that it requires no source profile input, however the goal is often to define the factors as specific sources which does require knowledge of PAH distribution in local source emissions. PMF also requires a large dataset to be effective, which is not always feasible. There is interest both in ascertaining the sources of PAHs and in accurately 20
using PAHs as source tracers in the atmosphere to quantify the contribution of emission sources to total atmospheric organic carbon (OC). Specific PAHs may be more valuable as molecular markers than others in source apportionment models for OC when used in conjunction with more unique tracers such as hopanes and levoglucosan (Chow et al., 2007; Jaeckels et al., 2007; Lough and Schauer, 2007). However, more investigation 25
into the sources of individual atmospheric PAHs is warranted to inform current source apportionment techniques.
at-ACPD
8, 20901–20924, 2008Source apportionment of
PAHs by CSRA
R. J. Sheesley et al.
Title Page
Abstract Introduction
Conclusions References
Tables Figures
◭ ◮
◭ ◮
Back Close
Full Screen / Esc
Printer-friendly Version
Interactive Discussion mospheric CO2 dictates the
14
C in fresh carbon and this then decays with a half-life of 5730 years. Hence, radiocarbon is ideal to distinguish between fossil fuel (void of
14
C) and biomass/biofuel (contemporary14C) combustion sources. However, the large sample masses traditionally required for radiocarbon analysis has largely limited its application in atmospheric particulate matter to characterizing total or bulk organic car-5
bon (Hildemann et al., 1994; Jordan et al., 2006; Szidat et al., 2004a; Bench et al., 2007). For bulk carbon, contemporary sources can include both biogenic emission and biomass combustion sources, so these results can only be used to define contribu-tion of fossil fuel combuscontribu-tion sources including motor vehicles and power generacontribu-tion. Advances in molecular-level radiocarbon analysis (Eglinton et al., 1996) have allowed 10
compound class-specific radiocarbon analysis (CCSRA) of atmospheric PAHs (Man-dalakis et al., 2005; Zencak et al., 2007b; Kumata et al., 2006). These studies have revealed geographic differences in fossil vs modern biomass sources of PAH across Europe and in Japan. The study from Japan is compelling as it indicates the impor-tance of isolating individual PAHs for compound-specific radiocarbon analysis (CSRA) 15
by revealing differences in the contribution from biomass burning between pooled low versus high molecular weight PAHs (Kumata et al., 2006). These results combined with emission source profiles suggest that source contributions would not be uniform for all PAHs.
To further consider the source apportionment of individual atmospheric PAHs, a res-20
idential area in a northern Swedish town was chosen for a winter sampling campaign. Lycksele, Sweden has been the site of previous atmospheric studies due to the high levels of ambient particulate matter and PAHs (Johansson et al., 2004; Hedberg and Johansson, 2006) and the high percentage of households using biofuels for space heating during wintertime (Hedberg and Johansson, 2006; Krecl et al., 2007); this is 25
ACPD
8, 20901–20924, 2008Source apportionment of
PAHs by CSRA
R. J. Sheesley et al.
Title Page
Abstract Introduction
Conclusions References
Tables Figures
◭ ◮
◭ ◮
Back Close
Full Screen / Esc
Printer-friendly Version
Interactive Discussion and particle number concentrations for Lycksele which were associated with known
traffic emission and biomass burning particle size distributions (Krecl et al., 2008b). A large day-to-day and hour-to-hour variability in aerosol concentrations was also ob-served with evening aerosol concentrations significantly higher on weekends than on weekdays, presumably associated to residential wood combustion (RWC) emissions. 5
Local traffic emissions were identified based upon their similar contribution every day and characteristic peak in the morning and in the evening (Krecl et al., 2008a). RWC and traffic emissions were thus identified as the two major local sources using several techniques, with long-range transport contributing to a lesser degree. In the current study, the relative impact of the RWC and traffic emissions is quantified by perform-10
ing radiocarbon analysis of total carbon and CSRA of PAHs on atmospheric samples collected in Lycksele during the winter of 2006.
2 Experimental section
2.1 Sample collection and treatment
Sampling was carried out in a residential neighborhood (Forsdala) in the town of Lyck-15
sele (64.55◦N, 18.72◦E, 8600 inhabitants) over a 6-week period from 23 January to 8
March 2006. Details on the sampling site and meteorological conditions can be found elsewhere (Krecl et al., 2007; Krecl et al., 2008a). Two custom-built high-volume sam-plers were employed (Broman et al., 1991), each one consisting of an inverted filter holder which collected total suspended particle matter (TSP) on borosilicate glass fiber 20
filters (GFF, 293 mm diameter, Millipore, USA). Downstream of the GFF filters were two sequentiall polyurethane foam (PUF) traps for collecting volatile compounds. Fil-ter changes were made on a 2-week schedule while PUF were replaced on a 1-week schedule to limit potential breakthrough. During the initial two weeks (23 January–6 February), the sampling was conducted with both GFF and PUFs; sampler A had an 25
ACPD
8, 20901–20924, 2008Source apportionment of
PAHs by CSRA
R. J. Sheesley et al.
Title Page
Abstract Introduction
Conclusions References
Tables Figures
◭ ◮
◭ ◮
Back Close
Full Screen / Esc
Printer-friendly Version
Interactive Discussion For the final four weeks of the campaign (6 February–8 March), the sampling was
performed only in the particle phase with an average flow rate of∼35 m3h−1for both samplers. In total, three sets of two-week filter samples and two sets of one-week PUF samples were collected. Additionally, one filter blank and two PUF blanks were trans-ported to and from the measurement site together with the other filters and PUFs and 5
were exposed outdoors in the sampling equipment for 30 s.
Prior to sampling, filters were baked at 450◦C for 5 h and PUFs were pre-cleaned by washing in a washing machine at 90◦C without detergent, dried at 35◦C for 4 days
and Soxhlet extracted first with toluene for two days and then with acetone for one day. PUFs were thereafter dried in a desiccator with vacuum suction for one day and 10
finally wrapped in aluminum foil and sealed in airtight plastic bags until sampling. After sampling, filters were wrapped in aluminum foil, packed into airtight plastic bags and PUFs were wrapped in aluminum foil and sealed in airtight plastic bags. All samples were first stored for several days in a refrigerator (+4◦C) and then in a freezer (
−18◦C) prior to analysis.
15
2.2 TOC Analysis
Total organic carbon (TOC) is here defined as the carbon remaining after inorganic carbon is removed by acid treatment (Zencak et al., 2007a). TOC analysis was con-ducted on 3 filter samples (Table 1). A 2.90 cm2 portion of each filter sample was treated with 37% HCl fumes in a desiccator for 2 days to remove carbonates. The 20
residual (TOC) was determined with a high-temperature catalytic elemental analyzer (Carlo Erba/Fisons, Italy) and blank corrected.
2.3 PAH Analysis
For each 2-week sample period, 75% of each filter from the two samplers were com-bined for extraction resulting in 3 filter samples. For the PUFs, a comcom-bined sample was 25
result-ACPD
8, 20901–20924, 2008Source apportionment of
PAHs by CSRA
R. J. Sheesley et al.
Title Page
Abstract Introduction
Conclusions References
Tables Figures
◭ ◮
◭ ◮
Back Close
Full Screen / Esc
Printer-friendly Version
Interactive Discussion ing in 2 PUF extracts. The filter and PUF samples were extracted with cyclohexane in a
Soxhlet apparatus. After extraction, a 5% aliquot of the extract was spiked with deuter-ated PAHs (phenanthrene-d10, fluoranthene-d10, pyrene-d10, and benzo[a]pyrene-d12,
benzo[g,h,i]-perylene-d12). The remainder of the method is based on previously
re-ported work (Mandalakis et al., 2005; Zencak et al., 2007b). Briefly, the cyclohexane 5
extracts were reduced to 2 ml by rotary evaporation. To purify the extracts, each was applied to a deactivated silica gel column (SiO2– 10% H2O, 63–200µm particle size,
10 cm×1 cm i.d.) and eluted with n-hexane. The samples were further treated with a dimethylformamide (DMF-5% water)-pentane partitioning cleanup procedure (Man-dalakis et al., 2004b) to isolate PAHs from interfering aliphatic compounds. Extracts 10
were then applied to a second deactivated silica gel column containing disodium sul-fate (Na2SO4, anh.) to remove water. At this point, the extracts were spiked with a
co-injection standard, chrysene-d12, and analyzed by gas chromatography/mass
spec-trometry (Fisons 8060GC interfaced to a Fisons MD 800 mass spectrometer) with the MS operated in selective ion monitoring mode (Mandalakis et al., 2004a).
15
2.4 Preparative capillary gas chromatography and accelerator mass spectroscopy
The details of the Gerstel preparative capillary gas chromatography (PCGC) method used for PAH isolation and harvesting have been reported previously (Mandalakis and Gustafsson, 2003; Mandalakis et al., 2004a) and are summarized here. Ninety-five percent of each cyclohexane extract was first purified as described in the PAH analysis 20
section except for the spiking with deuterated PAHs. Each purified extract was then repeatedly injected into the PCGC system (roughly 40 injections per extract) and the PAHs listed in Table 1 were trapped separately. PAHs harvested in the glass traps were then transferred using several rinses of hexane and passed through a small column packed with SiO2(4 cm×0.5 cm i.d.) using hexane. A small aliquot from each trap was
25
radio-ACPD
8, 20901–20924, 2008Source apportionment of
PAHs by CSRA
R. J. Sheesley et al.
Title Page
Abstract Introduction
Conclusions References
Tables Figures
◭ ◮
◭ ◮
Back Close
Full Screen / Esc
Printer-friendly Version
Interactive Discussion carbon results, however, as Zencak et al showed that∆14C normalized, as these were,
to aδ13C of−25‰ corrects any putative isotopic fractionation during PCGC isolation (2007c). In order to achieve sufficient mass for the CSRA method, the PAHs from the 3 filter extracts were combined after harvesting. The harvested PAHs from the 2 PUF ex-tracts were likewise combined (Table S1: http://www.atmos-chem-phys-discuss.net/8/ 5
20901/2008/acpd-8-20901-2008-supplement.pdf). This was the final step conducted at Stockholm University before the extracts were shipped out for further analysis.
Carbon isotope analysis was performed at the National Ocean Sciences Accelerator Mass Spectrometry (NOSAMS) facility of the Woods Hole Oceanographic Institution (USA). Acid fumigated TOC and PCGC-isolated individual PAH samples were oxidized 10
to CO2, purified and quantified by manometry (Pearson et al., 1998). About 10% of
CO2 was kept for δ13C analysis by isotope ratio mass spectrometry. The remaining 90% was reduced to graphite and subjected to accelerator mass spectrometry to de-termine the fraction of modern carbon, fM, which is the
14
C/12C ratio of the sample related to that of the reference year 1950. The reported∆14C error is the larger of the 15
internal error (statistical error calculated using the number of counts measured from each AMS sample) and external error (error calculated from the reproducibility of indi-vidual analyses of a single sample) (Pearson et al., 1998). More details on radiocarbon conventions and metric, the routine AMS sample preparation and analysis procedures are available elsewhere (Zencak et al., 2007b; Klinedinst and Currie, 1999).
20
3 Results and discussion
3.1 Ambient concentrations
Previously reported work from the Lycksele winter 2006 campaign has demonstrated that a combination of winter-time residential wood burning and traffic emissions with stable atmospheric conditions can result in locally high PM events (Krecl et al., 2007; 25
ACPD
8, 20901–20924, 2008Source apportionment of
PAHs by CSRA
R. J. Sheesley et al.
Title Page
Abstract Introduction
Conclusions References
Tables Figures
◭ ◮
◭ ◮
Back Close
Full Screen / Esc
Printer-friendly Version
Interactive Discussion an overlapping time period as these Krecl et al. studies, but on completely different
time scales. The ambient concentrations reported here are based on integrating 1–2 week sample collection periods, thus any extreme short-duration events are effectively smoothed out over the collection interval.
Systematically high TOC and PAH concentrations were observed during the 2006 5
winter season in Lycksele, Sweden (Fig. 1). Gas phase samples were only collected in the first sampling period, but the cold winter temperatures ensured that the volatile component was important only for phenanthrene, the most volatile of the measured PAHs; other measured PAHs were predominantly present in the particulate phase. Despite the 14-day sampling integration, the three filter samples had different PAH 10
concentrations and fingerprints. The lower molecular weight PAHs (fluoranthene and pyrene) have relatively higher concentrations in the first sampling period (23 January–6 February) while the higher molecular weight PAHs (chrysene to coronene) were higher in the second sampling period (6–22 February). The particulate TOC concentration for the three sampling periods parallels the trend seen for the higher molecular weight 15
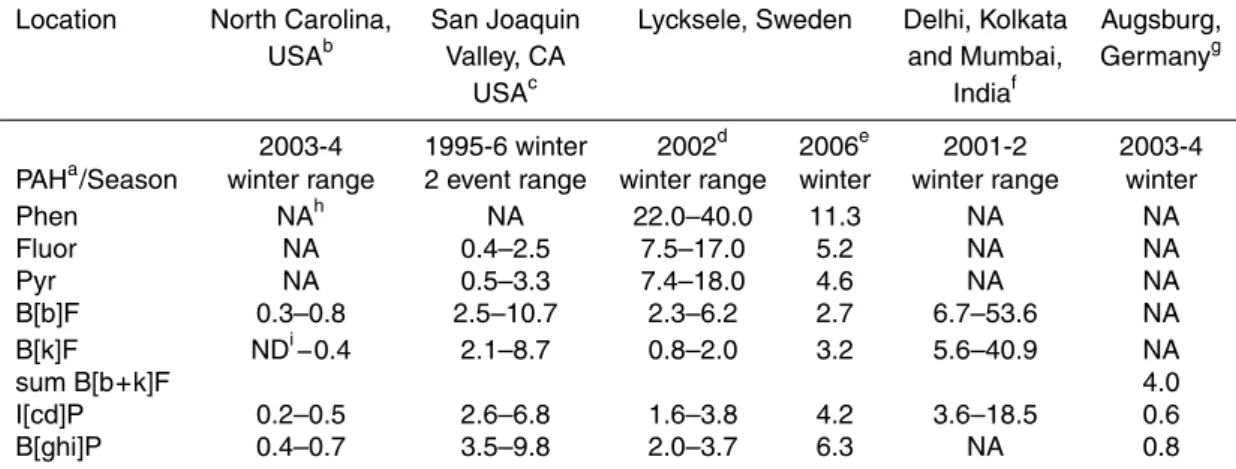
PAHs. To put these PAH concentrations in perspective, Table 2 compiles PAH concen-trations from several previously reported studies of areas impacted by biomass burning (Sheesley et al., 2007; Schnelle-Kreis et al., 2007; Chowdhury et al., 2007; Schauer and Cass, 2000). The 2006 winter measurements (this study) are roughly in the same range as those reported for the same town in 2002. However, the low/high molecular 20
weight PAH ratio was higher in 2002 than in 2006. Atmospheric levels in Lycksele are in the range of high PM event-level concentrations measured in the San Joaquin Valley, CA, USA (Schauer and Cass, 2000), but significantly lower than winter measurements in Indian cities (Chowdhury et al., 2007). Using chemical mass balance modeling with organic tracers, the contribution of biomass burning (wood fuel) was estimated to be 25
ACPD
8, 20901–20924, 2008Source apportionment of
PAHs by CSRA
R. J. Sheesley et al.
Title Page
Abstract Introduction
Conclusions References
Tables Figures
◭ ◮
◭ ◮
Back Close
Full Screen / Esc
Printer-friendly Version
Interactive Discussion 3.2 Carbon isotope results
The high ambient PAH concentrations in Lycksele made it an ideal site for this CSRA-based source apportionment study. The five individual/paired PAHs of highest concen-tration were successfully isolated, harvested and quantified for radiocarbon content (Table 1). Results of13C isotope analysis are presented asδ13C values relative to the 5
Vienna Pee Dee Belemnite (VPDB) standard (Coplen, 1996). Radiocarbon data are reported as∆14C and fraction modern (fM) relative to NBS Oxalic Acid I and have been
corrected for carbon blank and isotopic fractionation both in the environment and dur-ing sample preparation usdur-ing aδ13C of−25‰ as described elsewhere (Klinedinst and Currie, 1999; Stuiver and Polach, 1977; Zencak et al., 2007c). Above-ground nuclear 10
testing in the mid-twentieth century nearly doubled atmospheric∆14C values, but since that time this radiogenic “bomb spike” signal has been consistently decreasing (Levin et al., 2003), which means that biomass which grows over many years, such as trees, will have a higher ∆14C than contemporary CO2. Therefore, contemporary CO2 and
freshly produced biomass has a∆14C value of+70‰ (Levin and Kromer, 2004), while 15
contemporary wood fuel sources have been reported to have a well-constrained∆14C between+225‰ and+218‰ (Currie et al., 1999; Klinedinst and Currie, 1999; Zencak et al., 2007a; Szidat et al., 2007; Szidat et al., 2004b) and fossil fuel sources have a
∆14C of−1000‰.
For a case such as wintertime PAHs in Lycksele, biogenic emissions are not likely 20
due to the very low air temperatures that reduce biological activity and volatile organic carbon emissions. Snow-covered ground during the entire sampling period prevented the occurrence of grass fires in the region and incineration of household vegetable waste is not a common practice in the area. The∆14C-PAH and- TOC signals are con-strained to−138 to 59‰ and demonstrate that the modern carbon source is dominant 25
ACPD
8, 20901–20924, 2008Source apportionment of
PAHs by CSRA
R. J. Sheesley et al.
Title Page
Abstract Introduction
Conclusions References
Tables Figures
◭ ◮
◭ ◮
Back Close
Full Screen / Esc
Printer-friendly Version
Interactive Discussion Krecl et al., 2008b), is present in all samples. The∆14C for bulk TOC had a more limited
range (−96 to−24‰) than the∆14C range for PAHs (−138 to 59‰), with fluoranthene the most enriched in14C and the paired indeno[cd]pyrene plus benzo[ghi]perylene the most depleted.
The δ13C values in Lycksele are slightly more enriched in the TOC (−26.41‰ to 5
−26.68‰) than in the PAHs (−27.82‰ to−28.88‰); the PAHs are in the same range reported for European background sites (Mandalakis et al., 2005). Additionally, the TOC and all the PAHδ13C values are within the reported range for terrestrial C3plant
combustion (Zencak et al., 2007a). It should be noted that although∆14C values re-ported in the literature are commonly corrected for fractionation (Stuiver and Polach, 10
1977), the same is not true ofδ13C values. Thereforeδ13C results derived from sam-ples prepared using PCGC may be biased if the entire peak was not collected (Zencak et al., 2007c).
3.3 Radiocarbon-based source apportionment
An isotopic mass balance equation was then applied to the TOC and PAH∆14C results 15
to calculate fractional contribution of wood burning (fbiomass) and fossil fuel combustion
(ffossil=1−fbiomass) (Reddy et al., 2002; Currie et al., 1999; Mandalakis et al., 2004a;
Reddy et al., 2003):
∆14Csample= ∆14Cbiomassfbiomass+ ∆14Cfossil(1−fbiomass) (1)
In the above equation,∆14Csamplerepresents the radiocarbon results presented in
Ta-20
ble 1 for TOC and PAHs and the∆14Cbiomassis in the present study set to+218‰ (see
above discussion). The resulting fbiomass are presented in Fig. 2. The PAH fbiomass
results represent the full 6-week sampling period for all species except gas-phase phenanthrene (2-week sample), while the TOC average fbiomass±one standard
ACPD
8, 20901–20924, 2008Source apportionment of
PAHs by CSRA
R. J. Sheesley et al.
Title Page
Abstract Introduction
Conclusions References
Tables Figures
◭ ◮
◭ ◮
Back Close
Full Screen / Esc
Printer-friendly Version
Interactive Discussion The fbiomass ranges from 71–87% for all PAHs and the average for TOC is 77±3%.
Hence, TOC is in the middle of the fbiomass range for the measured PAHs. Several
previous studies have reported thefbiomassfor pooled, compound-class specific
radio-carbon analysis (CCSRA) of PAHs. Background site studies in Europe found afbiomass
for particulate CCSRA-PAHs of 50%, 9% and 7% for Southern Sweden, Croatia and 5
Greece, respectively (Mandalakis et al., 2005). The Croatian and Greek values repre-sent summer conditions whereas the Southern Swedenfbiomassis a multi-year average; a winter event at the same Southern Sweden site had anfbiomassfor TOC of 75–85%
(Zencak et al., 2007a), which illustrates the impact of seasonal sources such as RWC. A more comprehensive study in the western Balkans measured fbiomass in the range 10
35–65% for a selection of urban, industrial and rural sites (Zencak et al., 2007b). In a study in Tokyo, particulate CCSRA-PAHs in the PM10 fraction were split into low and
high molecular weight fractions by season. The contribution of biomass burning to PM10samples was 17–38% (summer) and 24–27% (winter) for low and high molecular weight (MW) PAHs, respectively, with little seasonal differences. Road traffic emissions 15
might be expected to dominate in and around a megacity like Tokyo, and therefore it is surprising to see the high fraction of PAH from biomass combustion in both summer and winter. Thefbiomasscalculated for Lycksele is much higher than all three of these
previously reported CCSRA-PAH studies. Thefbiomassof PAHs from this study plus the
fbiomassof TOC from Southern Sweden (Zencak et al., 2007a) indicate the dominance 20
of RWC during winter in the boreal zone.
To make a start at evaluating the isotopic (and source) heterogeneity between gas phase and particulate PAHs, this study afforded radiocarbon analysis on phenanthrene in both phases. The fbiomass of gaseous and particulate phenanthrene were
indistin-guishable within three times the error in Lycksele. Although the gas and particulate 25
ACPD
8, 20901–20924, 2008Source apportionment of
PAHs by CSRA
R. J. Sheesley et al.
Title Page
Abstract Introduction
Conclusions References
Tables Figures
◭ ◮
◭ ◮
Back Close
Full Screen / Esc
Printer-friendly Version
Interactive Discussion two-week periods show stability in the source contributions despite differences in
con-centration (Table 1). Based on the imperfect comparison in this study, the partitioning of phenanthrene between the gaseous and particulate phase is apparently dominated by ambient conditions under these winter-time conditions and is less impacted by dif-ferences in the physical or chemical characteristics of RWC or motor vehicle exhaust. 5
3.4 Fraction biomass and molecular weight
We further sought to investigate isotopic heterogeneity as a function of PAH vapor pressure and/or size, however the number of samples inhibits statistical analysis. In Fig. 2, there is a small decrease infbiomass with increasing molecular weight for the
five compounds/compound pairs analyzed here. The fbiomass of phenanthrene,
fluo-10
ranthene, pyrene and benzo[b+k]fluoranthene are relatively similar, and it is particu-larly the pair of MW 276 PAHs (indeno[cd]pyrene plus benzo[ghi]perylene) that have a much lowerfbiomass. At 71%, the fbiomass of indeno[cd]pyrene and benzo[ghi]perylene
is 16% lower than gas phase phenanthrene and fluoranthene and 9% lower than benzo[b+k]fluoranthene. The results are broadly consistent with a PAH fingerprint 15
skewed toward higher masses for high-temperature combustion processes such as fos-sil fuel combustion. In fact, both indeno[cd]pyrene and benzo[ghi]perylene have been used in organic molecular marker-chemical mass balance models (MM-CMB) to appor-tion the contribuappor-tion of gasoline-powered motor vehicle exhaust to atmospheric partic-ulate organic carbon (Sheesley et al., 2007; Chow et al., 2007). Figure S1 (http://www. 20
atmos-chem-phys-discuss.net/8/20901/2008/acpd-8-20901-2008-supplement.pdf) il-lustrates that the PAH/OC ratio for benzo[ghi]perylene, in particular, is much higher for gasoline-powered motor vehicle exhaust (Lough et al., 2007) in comparison to the same ratio for wood smoke emission profiles (Lee et al., 2005; Schauer et al., 2001; Fine et al., 2002, 2004). Although there are few data points, the lowerfbiomass
contri-25
in-ACPD
8, 20901–20924, 2008Source apportionment of
PAHs by CSRA
R. J. Sheesley et al.
Title Page
Abstract Introduction
Conclusions References
Tables Figures
◭ ◮
◭ ◮
Back Close
Full Screen / Esc
Printer-friendly Version
Interactive Discussion clude high MW PAHs like indeno[cd]pyrene or benzo[ghi]perylene (Lough et al., 2007;
Schauer et al., 1999).
3.5 Source contribution to ambient loadings
The mean contribution of wood combustion to ambient TOC was 2.4µg m−3whereas fossil fuel combustion, most likely traffic emissions, accounted for 0.7µg m−3in the pe-5
riod 23 January–8 March. The contribution of RWC to phenanthrene was 7.8 and 1.9 ng m−3, while traffic emissions contributed 1.2 and 0.4 ng m−3 for gas and par-ticle phase, respectively. For fluoranthene, pyrene, benzo[b+k]fluoranthene and in-deno[cd]pyrene plus benzo[ghi]perylene the RWC contributions were 3.37, 2.94, 4.81 and 7.50 ng m−3, respectively. The motor vehicle contributions were 0.5, 0.7, 1.2 and 10
3.1 ng m−3, respectively. This illustrates one of the advantages of CSRA, which can be tailored to define source contributions of specific compounds like PAHs, which are of interest as carcinogenic compounds and as source tracers.
4 Conclusions
The results of the CSRA analysis in Lycksele conclusively demonstrate that high ambi-15
ent concentrations of PAHs across the molecular weight spectrum, and TOC in general, are a result of RWC. Therefore, a significant reduction of carcinogenic atmospheric PAHs in Lycksele, and likely for many similar such towns in the boreal zone, would require targeting RWC emissions. With biomass burning contributions ranging from 87% for fluoranthene to 71% for ideno[cd]pyrene plus benzo[ghi]perylene, the CSRA 20
shows that RWC contribution is dominant, but not uniform for all PAHs. Any decrease in RWC would have a larger impact on the lower molecular weight PAHs, as these have a higherfbiomass. CCSRA has been used in implicating RWC for total PAHs, however, the
ACPD
8, 20901–20924, 2008Source apportionment of
PAHs by CSRA
R. J. Sheesley et al.
Title Page
Abstract Introduction
Conclusions References
Tables Figures
◭ ◮
◭ ◮
Back Close
Full Screen / Esc
Printer-friendly Version
Interactive Discussion differences in PAH profiles.
For this system with 2 dominant local source factors (Krecl et al., 2008a), the CSRA could stand alone to separate the biomass burning and local traffic emissions. For Ly-cksele, the additional information gained from using CSRA instead of CCSRA enabled the attribution of gasoline-powered motor vehicle exhaust over diesel due to the en-5
hanced contribution of fossil fuel for the MW 276 PAHs. In a more complicated system, CSRA would add a valuable additional tool when used in conjunction with other source apportionment and chemical characterization methods. In the case of urban centers with industrial sources, CSRA of PAHs would be particularly helpful as it has been shown that PAHs are not uniformly co-variant with motor vehicle or biomass burning 10
tracers in these systems (Jaeckels et al., 2007).
References
Bench, G., Fallon, S., Schichtel, B., Malm, W., and McDade, C.: Relative contributions of fossil and contemporary carbon sources to PM 2.5 aerosols at nine Interagency Monitoring for Protection of Visual Environments (IMPROVE) network sites, J. Geophys. Res.-Atmos., 112, 15
D10205, doi:10.1029/2006JD007708, 2007.
Benner, B. A., Wise, S. A., Currie, L. A., Klouda, G. A., Klinedinst, D. B., Zweidinger, R. B., Stevens, R. K., and Lewis, C. W.: Distinguishing the contributions of residential wood com-bustion and mobile source emissions using relative concentrations of dimethylphenanthrene isomers, Environ. Sci. Technol., 29, 2382–2389, 1995.
20
Broman, D., Naf, C., and Zebuhr, Y.: Long-term high-volume and low-volume air sam-pling of polychlorinated dibenzo-para-dioxins and dibenzofurans and polycyclic aromatic-hydrocarbons along a transect from urban to remote areas on the Swedish Baltic Coast, Environ. Sci. Technol., 25, 1841–1850, 1991.
Busby, W. F., Smith, H., Plummer, E. F., Lafleur, A. L., Mulder, P. P. J., Boere, B. B., Cornelisse, 25
ACPD
8, 20901–20924, 2008Source apportionment of
PAHs by CSRA
R. J. Sheesley et al.
Title Page
Abstract Introduction
Conclusions References
Tables Figures
◭ ◮
◭ ◮
Back Close
Full Screen / Esc
Printer-friendly Version
Interactive Discussion
Choi, H., Jedrychowski, W., Spengler, J., Camann, D. E., Whyatt, R. M., Rauh, V., Tsai, W. Y., and Perera, F. P.: International studies of prenatal exposure to polycyclic aromatic hydrocar-bons and fetal growth, Environ. Health Perspect., 114, 1744–1750, 2006.
Chow, J. C., Watson, J. G., Lowenthal, D. H., Chen, L. W. A., Zielinska, B., Mazzoleni, L. R., and Magliano, K. L.: Evaluation of organic markers for chemical mass balance source 5
apportionment at the Fresno Supersite, Atmos. Chem. Phys., 7, 1741–1754, 2007, http://www.atmos-chem-phys.net/7/1741/2007/.
Chowdhury, Z., Zheng, M., Schauer, J. J., Sheesley, R. J., Salmon, L. G., Cass, G. R., and Rus-sell, A. G.: Speciation of ambient fine organic carbon particles and source apportionment of PM2.5 in Indian cities, J. Geophys. Res.-Atmos., 112, D15303, doi:10.1029/2007JD008386, 10
2007.
Coplen, T. B.: New guidelines for reporting stable hydrogen, carbon and oxygen isotope-ratio data, Geochim. Cosmochim. Acta, 60, 3359–3360, 1996.
Currie, L. A., Klouda, G. A., Benner, B. A., Garrity, K., and Eglinton, T. I.: Isotopic and molec-ular fractionation in combustion; three routes to molecmolec-ular marker validation, including direct 15
molecular “dating” (GC/AMS), Atmos. Environ., 33, 2789–2806, 1999.
Eglinton, T. I., Aluwihare, L. I., Bauer, J. E., Druffel, E. R. M., and McNichol, A. P.: Gas chro-matographic isolation of individual compounds from complex matrices for radiocarbon dating, Anal. Chem., 68, 904–912, 1996.
Fine, P. M., Cass, G. R., and Simoneit, B. R. T.: Chemical characterization of fine particle 20
emissions from the fireplace combustion of woods grown in the southern United States, Environ. Sci. Technol., 36, 1442–1451, 2002.
Fine, P. M., Cass, G. R., and Simoneit, B. R. T.: Chemical characterization of fine particle emissions from the fireplace combustion of wood types grown in the Midwestern and Western United States, Environ. Eng. Sci., 21, 387–409, 2004.
25
Hays, M. D., Smith, N. D., Kinsey, J., Dong, Y. J., and Kariher, P.: Polycyclic aromatic hy-drocarbon size distributions in aerosols from appliances of residential wood combustion as determined by direct thermal desorption-GC/MS, J. Aerosol Sci, 34, 1061–1084, 2003. Hedberg, E. and Johansson, C.: Is levoglucosan a suitable quantitative tracer for wood
burn-ing? Comparison with receptor modeling on trace elements in Lycksele, Sweden, J. Air 30
Waste Manage. Assoc., 56, 1669–1678, 2006.
ACPD
8, 20901–20924, 2008Source apportionment of
PAHs by CSRA
R. J. Sheesley et al.
Title Page
Abstract Introduction
Conclusions References
Tables Figures
◭ ◮
◭ ◮
Back Close
Full Screen / Esc
Printer-friendly Version
Interactive Discussion
Jaeckels, J. M., Bae, M. S., and Schauer, J. J.: Positive Matrix Factorization (PMF) analysis of molecular marker measurements to quantify the sources of organic aerosols, Environ. Sci. Technol., 41, 5763–5769, 2007.
Johansson, C., Hedberg, E., Olivares, G., et al.: Measurements and calculations of the effect of wood burning on air pollution levels – Part 1: Lycksele, Department of Applied Environmental 5
Science, Stockholm University, Stockholm, SwedenITM report-124, 2004.
Jordan, T. B., Seen, A. J., Jacobsen, G. E., and Gras, J. L.: Radiocarbon determination of woodsmoke contribution to air particulate matter in Launceston, Tasmania, Atmos. Environ., 40, 2575–2582, 2006.
Klinedinst, D. B. and Currie, L. A.: Direct quantification of PM2.5 fossil and biomass carbon 10
within the Northern Front Range Air Quality Study’s domain, Environ. Sci. Technol., 33, 4146–4154, 1999.
Krecl, P., Strom, J., and Johansson, C.: Carbon content of atmospheric aerosols in a residen-tial area during the wood combustion season in Sweden, Atmos. Environ., 41, 6974–6985, doi:10.1016/j.atmosenv.2007.06.025, 2007.
15
Krecl, P., Hedberg Larsson, E., Str ¨om, J., and Johansson, C.: Contribution of residential wood combustion and other sources to hourly winter aerosol in Northern Sweden determined by positive matrix factorization, Atmos. Chem. Phys., 8, 3639–3653, 2008,
http://www.atmos-chem-phys.net/8/3639/2008/.
Krecl, P., Strom, J., and Johansson, C.: Diurnal variation of atmospheric aerosol during the 20
wood combustion season in Northern Sweden, Atmos. Environ., 42, 4113–4125, 2008b. Kumata, H., Uchida, M., Sakuma, E., Uchida, T., Fujiwara, K., Tsuzuki, M., Yoneda, M., and
Shibata, Y.: Compound class specific C-14 analysis of polycyclic aromatic hydrocarbons as-sociated with PM10 and PM1.1 aerosols from residential areas of suburban Tokyo, Environ. Sci. Technol., 40, 3474–3480, 2006.
25
Larsen, R. K. and Baker, J. E.: Source apportionment of polycyclic aromatic hydrocarbons in the urban atmosphere: A comparison of three methods, Environ. Sci. Technol., 37, 1873– 1881, 2003.
Lee, S., Baumann, K., Schauer, J. J., Sheesley, R. J., Naeher, L. P., Meinardi, S., Blake, D. R., Edgerton, E. S., Russell, A. G., and Clements, M.: Gaseous and particulate emissions from 30
prescribed burning in Georgia, Environ. Sci. Technol., 39, 9049–9056, 2005.
ACPD
8, 20901–20924, 2008Source apportionment of
PAHs by CSRA
R. J. Sheesley et al.
Title Page
Abstract Introduction
Conclusions References
Tables Figures
◭ ◮
◭ ◮
Back Close
Full Screen / Esc
Printer-friendly Version
Interactive Discussion
2194, doi:10.1029/2003GL018477, 2003.
Levin, I. and Kromer, B.: The tropospheric (CO2)-C-14 level in mid-latitudes of the Northern Hemisphere (1959–2003), Radiocarbon, 46, 1261–1272, 2004.
Lima, A. L. C., Farrington, J. W., and Reddy, C. M.: Combustion-derived polycyclic aromatic hydrocarbons in the environment – A review, Environ. Forensics, 6, 109–131, 2005.
5
Lough, G. C., Christensen, C. G., Schauer, J. J., Tortorelli, J., Mani, E., Lawson, D. R., Clark, N. N., and Gabele, P. A.: Development of molecular marker source profiles for emissions from on-road gasoline and diesel vehicle fleets, J. Air Waste Manage. Assoc., 57, 1190–1199, 2007.
Lough, G. C. and Schauer, J. J.: Sensitivity of source apportionment of urban particulate matter 10
to uncertainty in motor vehicle emissions profiles, J. Air Waste Manage. Assoc., 57, 1200– 1213, 2007.
Mandalakis, M. and Gustafsson, O.: Optimization of a preparative capillary gas
chromatography-mass spectrometry system for the isolation and harvesting of individual polycyclic aromatic hydrocarbons, J. Chromatogr. A, 996, 163–172, 2003.
15
Mandalakis, M., Gustafsson, O., Reddy, C. M., and Li, X.: Radiocarbon apportionment of fossil versus biofuel combustion sources of polycyclic aromatic hydrocarbons in the Stockholm metropolitan area, Environ. Sci. Technol., 38, 5344–5349, 2004a.
Mandalakis, M., Zebuhr, Y., and Gustafsson, O.: Efficient isolation of polyaromatic fraction from aliphatic compounds in complex extracts using dimethylformamide-pentane partitionings, J. 20
Chromatogr. A., 1041, 111–117, 2004b.
Mandalakis, M., Gustafsson, O., Alsberg, T., Egeback, A. L., Reddy, C. M., Xu, L., Klanova, J., Holoubek, I., and Stephanou, E. G.: Contribution of biomass burning to atmospheric poly-cyclic aromatic hydrocarbons at three European background sites, Environ. Sci. Technol., 39, 2976–2982, 2005.
25
McDonald, J. D., Zielinska, B., Fujita, E. M., Sagebiel, J. C., Chow, J. C., and Watson, J. G.: Emissions from charbroiling and grilling of chicken and beef, J. Air Waste Manage. Assoc., 53, 185–194, 2003.
Pearson, A., McNichol, A. P., Schneider, R. J., Von Reden, K. F., and Zheng, Y.: Microscale AMS C-14 measurement at NOSAMS, Radiocarbon, 40, 61–75, 1998.
30
ACPD
8, 20901–20924, 2008Source apportionment of
PAHs by CSRA
R. J. Sheesley et al.
Title Page
Abstract Introduction
Conclusions References
Tables Figures
◭ ◮
◭ ◮
Back Close
Full Screen / Esc
Printer-friendly Version
Interactive Discussion
36, 1774–1782, 2002.
Reddy, C. M., Xu, L., and O’Connor, R.: Using radiocarbon to apportion sources of polycyclic aromatic hydrocarbons in household soot, Environ. Forensics, 4, 191–197, 2003.
Sauvain, J. J., Duc, T. V., and Guillemin, M.: Exposure to carcinogenic polycyclic aromatic compounds and health risk assessment for diesel-exhaust exposed workers, Int. Arch. Occ. 5
Env. Hea., 76, 443–455, 2003.
Schauer, J. J., Kleeman, M. J., Cass, G. R., and Simoneit, B. R. T.: Measurement of emissions from air pollution sources, 2. C1 through C30 organic compounds from medium duty diesel trucks, Environ. Sci. Technol., 33, 1578–1587, 1999.
Schauer, J. J. and Cass, G. R.: Source apportionment of wintertime gas-phase and particle-10
phase air pollutants using organic compounds as tracers, Environ. Sci. Technol., 34, 1821– 1832, 2000.
Schauer, J. J., Kleeman, M. J., Cass, G. R., and Simoneit, B. R. T.: Measurement of emissions from air pollution sources, 3. C-1-C-29 organic compounds from fireplace combustion of wood, Environ. Sci. Technol., 35, 1716–1728, 2001.
15
Schauer, J. J., Kleeman, M. J., Cass, G. R., and Simoneit, B. R. T.: Measurement of emissions from air pollution sources, 5. C-1-C-32 organic compounds from gasoline-powered motor vehicles, Environ. Sci. Technol., 36, 1169–1180, 2002.
Schnelle-Kreis, J., Sklorz, M., Orasche, J., Stolzel, M., Peters, A., and Zimmermann, R.: Semi volatile organic compounds in ambient PM2.5, Seasonal trends and daily resolved source 20
contributions, Environ. Sci. Technol., 41, 3821–3828, 2007.
Schwarze, P. E., Ovrevik, J., Hetland, R. B., Becher, R., Cassee, F. R., Lag, M., Lovik, M., Dybing, E., and Refsnes, M.: Importance of size and composition of particles for effects on cells in vitro, Inhal. Toxicol., 19, 17–22, 2007.
Sheesley, R. J., Schauer, J. J., Zheng, M., and Wang, B.: Sensitivity of molecular marker-based 25
CMB models to biomass burning source profiles, Atmos. Environ., 41, 9050–9063, 2007. Stuiver, M. and Polach, H. A.: Reporting Of C-14 Data – Discussion, Radiocarbon, 19, 355–
363, 1977.
Szidat, S., Jenk, T. M., Gaggeler, H. W., Synal, H. A., Fisseha, R., Baltensperger, U., Kalberer, M., Samburova, V., Reimann, S., Kasper-Giebl, A., and Hajdas, I.: Radiocarbon (C-14)-30
deduced biogenic and anthropogenic contributions to organic carbon (OC) of urban aerosols from Zurich, Switzerland, Atmos. Environ., 38, 4035–4044, 2004a.
ACPD
8, 20901–20924, 2008Source apportionment of
PAHs by CSRA
R. J. Sheesley et al.
Title Page
Abstract Introduction
Conclusions References
Tables Figures
◭ ◮
◭ ◮
Back Close
Full Screen / Esc
Printer-friendly Version
Interactive Discussion
M., Samburova, V., Wacker, L., Saurer, M., Schwikowski, M., and Hajdas, I.: Source ap-portionment of aerosols by C-14 measurements in different carbonaceous particle fractions, Radiocarbon, 46, 475–484, 2004b.
Szidat, S., Prevot, A. S. H., Sandradewi, J., Alfarra, M. R., Synal, H. A., Wacker, L., and Baltensperger, U.: Dominant impact of residential wood burning on particulate matter in 5
Alpine valleys during winter, Geophys. Res. Lett., 34, L05820, doi:10.1029/2006GL028325, 2007.
Yan, B. Z., Abrajano, T. A., Bopp, R. F., Chaky, D. A., Benedict, L. A., and Chillrud, S. N.: Molecular tracers of saturated and polycyclic aromatic hydrocarbon inputs into Central Park Lake, New York City, Environ. Sci. Technol., 39, 7012–7019, 2005.
10
Yunker, M. B., Macdonald, R. W., Vingarzan, R., Mitchell, R. H., Goyette, D., and Sylvestre, S.: PAHs in the Fraser River basin: a critical appraisal of PAH ratios as indicators of PAH source and composition, Org. Geochem., 33, 489–515, 2002.
Zencak, Z., Elmquist, M., and Gustafsson, O.: Quantification and radiocarbon source appor-tionment of black carbon in atmospheric aerosols using the CTO-375 method, Atmos. Envi-15
ron., 41, 7895–7906, 2007a.
Zencak, Z., Klanova, J., Holoubek, I., and Gustafsson, O.: Source apportionment of atmo-spheric PAHs in the western balkans by natural abundance radiocarbon analysis, Environ. Sci. Technol., 41, 3850–3855, 2007b.
Zencak, Z., Reddy, C. M., Teuten, E. L., Xu, L., McNichol, A. P., and Gustafsson, O.: Evalu-20
ACPD
8, 20901–20924, 2008Source apportionment of
PAHs by CSRA
R. J. Sheesley et al.
Title Page
Abstract Introduction
Conclusions References
Tables Figures
◭ ◮
◭ ◮
Back Close
Full Screen / Esc
Printer-friendly Version
Interactive Discussion
Table 1. Carbon isotope results for bulk TOC and individual PAHs in Lycksele during winter
campaign 2006.
Dates Compounda Media δ13Cb(‰) ∆14C (‰) fM
2-week samples
23 Jan–6 Feb TOCc GFF −26.68 −23.7 0.983±0.010
6 Feb–20 Feb TOC GFF −26.41 −75.1 0.931±0.008
22 Feb–8 Mar TOC GFF −26.47 −95.7 0.910±0.008
Winter compositesd
23 Jan–6 Feb Phen PUF −27.85 58.0 1.065±0.017
23 Jan–8 Mar Phen GFF −28.19 14.7 1.022±0.020
23 Jan–8 Mar Fluor GFF −28.48 58.8 1.066±0.014
23 Jan–8 Mar Pyr GFF −27.94 −26.8 0.980±0.012
23 Jan–8 Mar B[b+k]F GFF −27.82 −23.5 0.983±0.014
23 Jan–8 Mar I[cd]P+B[ghi]P GFF −28.55 −138.3 0.868±0.019
23 Jan–8 Mar Sum of PAHs PUF, GFF −28.88 −46.2 0.960±0.010
a
Phenanthrene (Phen), fluoranthene (Fluor), pyrene (Pyr), benzo[b]fluoranthene plus benzo[k]fluoranthene (B[b+k]F), indeno[cd]pyrene (I[cd]P), benzo[ghi]perylene (B[ghi]P).bδ13C and ∆14C are reported in ‰ relative to VPDB and NBS oxalic acid I, respectively. c To-tal organic carbon (elemenTo-tal carbon+ organic carbon) is defined as carbon remaining
af-ter inorganic carbon has been removed by acid treatment. d Samples from both
sam-plers were combined to achieve sufficient mass for CSRA analysis (see Table S1: http:
ACPD
8, 20901–20924, 2008Source apportionment of
PAHs by CSRA
R. J. Sheesley et al.
Title Page
Abstract Introduction
Conclusions References
Tables Figures
◭ ◮
◭ ◮
Back Close
Full Screen / Esc
Printer-friendly Version
Interactive Discussion
Table 2. Concentrations of representative PAH (ng m−3
) from studies in areas impacted by biomass burning.
Location North Carolina, San Joaquin Lycksele, Sweden Delhi, Kolkata Augsburg,
USAb Valley, CA and Mumbai, Germanyg
USAc Indiaf
2003-4 1995-6 winter 2002d 2006e 2001-2 2003-4 PAHa/Season winter range 2 event range winter range winter winter range winter
Phen NAh NA 22.0–40.0 11.3 NA NA
Fluor NA 0.4–2.5 7.5–17.0 5.2 NA NA
Pyr NA 0.5–3.3 7.4–18.0 4.6 NA NA
B[b]F 0.3–0.8 2.5–10.7 2.3–6.2 2.7 6.7–53.6 NA
B[k]F NDi−0.4 2.1–8.7 0.8–2.0 3.2 5.6–40.9 NA
sum B[b+k]F 4.0
I[cd]P 0.2–0.5 2.6–6.8 1.6–3.8 4.2 3.6–18.5 0.6
B[ghi]P 0.4–0.7 3.5–9.8 2.0–3.7 6.3 NA 0.8
a
Phenanthrene (Phen), fluoranthene (Fluor), pyrene (Pyr), benzo[b]fluoranthene (B[b]F), benzo[k]fluoranthene (B[k]F), indeno[cd]pyrene (I[cd]P), benzo[ghi]perylene (B[ghi]P). b (Sheesley et al., 2007), 4 semi-urban sites, particle phase, PM2.5 fraction. c (Schauer and Cass, 2000) 2 sites, 2 winter events, particle phase, PM2.5fraction.d(Johansson et al., 2004), Norrmalm and Forsdala residential neighborhoods, gas+particle phases, PM10fraction.egas
ACPD
8, 20901–20924, 2008Source apportionment of
PAHs by CSRA
R. J. Sheesley et al.
Title Page Abstract Introduction Conclusions References Tables Figures ◭ ◮ ◭ ◮ Back Close
Full Screen / Esc
Printer-friendly Version Interactive Discussion phen anthren e fluo ranthene py rene retene benzo [ghi]fluo ranthen e cy clopenta [cd]py rene be nz[a]an thracene chry sen e benz o[b]fluo ranthene ben zo[k]fluo ranthen e benz o[e]py ren e benz o[a]py ren e inde no[1,2,3 -cd]py rene diben z[a,h]an thracen e benzo[g hi]pery lene coronen e par ticulate TOC PA
H (ng m
-3 ) 0 2 4 6 8 10 12 Par
ticulate TOC (
μ g m -3 ) 0 1 2 3 4 5
Jan 23 to Jan 31 gas phase Jan 23 to Feb 6
Feb 6 to Feb 22 Feb 20 to Mar 8
Fig. 1.Left side: Ambient concentrations of individual PAHs in Lycksele, Sweden for gas phase
ACPD
8, 20901–20924, 2008Source apportionment of
PAHs by CSRA
R. J. Sheesley et al.
Title Page
Abstract Introduction
Conclusions References
Tables Figures
◭ ◮
◭ ◮
Back Close
Full Screen / Esc
Printer-friendly Version
Interactive Discussion
Phe
n
Phe
n
Fluo
r
Py
r
B[
b+k
]F
Ind
[cd]P+B[gh
i]P
S
u
m PAH
Fractional source contribution
0.0 0.2 0.4 0.6 0.8 1.0 1.2
Biomass Fossil fuel TOC avg. biomass TOC (1 s.d.) Gas phase Particle phase
MW 192 192 202 202 252 276
Fig. 2. Fractional contributions of biomass and fossil fuel combustion sources for individual