Abstract—Substantial modifications have been made to the expressions for calculating distance factor and extrapolation techniques in the latest ITU-R P.530-14. However, its performance has not been rigorously evaluated in the tropical and equatorial climates. In this article, the new ITU-R method and three prediction models are validated using measurement data from tropical Malaysian climate. The data were collected on six geographically spread terrestrial microwave DIGI MINI-LINKs operating at 15 GHz. When tested against measurements, the Da Silva Mello model yields a significant improvement for the prediction of rain attenuation distributions. The prediction errors observed in the ITU-R model suggest the need for more data campaign in the afore-mentioned climates.
I. INTRODUCTION
Traditionally frequencies above 10 GHz are commonly employed in the current microwave
point-to-point networks, due to large bandwidth and freedom from traffic congestion. However, in these
frequency bands, the performance of the fixed service (FS) is predominantly controlled by rain
attenuation [1]. For this reason, adequate knowledge of the propagation effects and their impact on
link performance plays significant role in the design of reliable communication systems [2], [3]. The
severe losses caused by rain attenuation are further aggravated due to rainfall inhomogeneity. This
may become a serious problem, most especially at low percentages of time which correspond to high
values of rain attenuation [4], [5].
For decades, the International Telecommunication Union-Radio Sector (ITU-R) has sought a global
model for the prediction of the rain-induced attenuation on terrestrial microwave link in any climate
S
TATISTICAL
E
VALUATION OF
M
EASURED
R
AIN
A
TTENUATION IN
T
ROPICAL
C
LIMATE AND
C
OMPARISON WITH
P
REDICTION
M
ODELS
Abdulrahman A. Yusuf1, Falade, A1, Olufeagba, B. J1, Mohammed, O. O1
1
Electrical and Electronics Engineering Department, University of Ilorin, Nigeria [email protected]; [email protected]; [email protected];
[email protected] Tharek A. Rahman2 2
Wireless Communication Center, (WCC), Universiti Teknologi Malaysia, (UTM), Malaysia [email protected]
of the world. The ITU-R rain attenuation prediction method yields poor results when applied to
terrestrial radio links operating in the equatorial and tropical climates. This claim has been
emphatically reported in a handful of published works and consequently quiet a large number of
prediction models have been proposed [5, 7-11].
Some of the classical rain attenuation prediction models based on data collected on terrestrial radio
Lin model [9], Moupfouma model [10], and Da Silva Mello model [11] are a few classical rain
attenuation prediction models which were developed based on data collected from the equatorial and
tropical climates. Recently the latest version of the ITU-R has been enforced (namely, ITU-R 530-14)
in 2012; however, its performance has not been largely evaluated using data collected from tropical
climates. Therefore, the main aim of this article is to evaluate the performance of the newly released
ITU-R model and the three afore-mentioned models, using measurement data from six locations in a
tropical climate. The data used are the rain rate and rain attenuation data banks available from six
geographically spread terrestrial microwave DIGI MINI-LINKs operating at 15 GHz as described in
[13]. It should be mentioned here that the ITU-R P.530-14 was not yet in force when our previous
works were reported.
II. THEORETICALBACKGROUNDOFRAINATTENUATIONPREDICTIONMODELS
Rain attenuation can be conveniently defined as the product of specific attenuation (dB/km)
corresponding to the point rain rate (typically measured at one end of the link) and the effective
propagation path length (km) [1]. The path correction factor is defined as the ratio of effective path
length to the physical path length of a microwave link, and its value is usually less than unity, except
in rear cases [14].The concept of effective path length is thus a way of ‘averaging out’ the spatial
inhomegeneity of rain rate and thus specific attenuation [15]. Note that the degree of spatial
inhomogeneity in rain rate generally varies with rainfall intensity. Therefore the variation of path
length reduction factor can be expressed as a function of rain rate or the corresponding time
exceedance [16].
Attenuation Apexceeded at %pof time can either be obtained from direct measurements, or
predicted from the knowledge of long-term rainfall rate. Generally, the required inputs in most
attenuation prediction models for terrestrial point-to-point microwave links are the rainfall rate
exceeded at %pof time, the effective propagation path length and the link’s operating frequency [7],
[16].Thus Apexceeded at %pof time is given by:
p p eff p
p effp R d R d d
A , , (1)
p kRp (2)
p eff dr
where Rp(mm/h) is the rainfall rate exceeded at %p of the time, rp is the path correction factor at
the same %p,
d
(km) is the radio path length. Parametersk
and
depend on frequency, raintemperature, and polarization; and their values can be obtained from ITU-R P. 838-3 [17].
An overview of Lin model [7], revised Moupfouma model [8]
,
revised Silva Mello model [9]andthe newly released ITU-R model [10] is briefly presented in the following subsections.
A. Lin Model
According to Lin [7], the reduction factor can be expressed as:
) ( 1
1 p p
R L L r
(4)
and
km R
R L
p p
2 . 6 2623 )
(
(5)
The factor accounts for the partially correlated rain rate R(mm/h)variations along the propagation
path of length L such that the non linear factor in Equation (4) equals one half when LL(R) is
related to the diameter of rain cell. So that the overall rain attenuation is calculated by substituting the
empirical value of path reduction factor into Equation (1), as follows:
) ( 1
1
p p
p
R L L L kR
A
(6)
B. Revised Silva Mello’s Model
Silva Mello et al [9] identified the extrapolation procedure adopted in the older versions of the ITU-R
model (ITU-R P.530-13 inclusive) as the major limitation of the prediction method. They therefore
proposed the method of using the full rainfall rate distribution is introduced as input for predicting the
rain attenuation cumulative distribution (CD), and is given by [11]:
) ( 1
1 )
, (
0 p
p eff eff
R p
R d d d
R R k d A
(7)
whereReffis the effective rain rate, a function of
d
andRp.
The expression for Reff and equivalentrain cell diameter
d
0 are given by:d
eff R
R 1.763 0.7530.197
(8)
and
244 . 0
0 119
R
d
(9)
The numerical coefficients in Equations (5) and (6) were obtained by multiple non-linear regressions, using the measured data currently available in the ITU-R databanks.
C. Revised Moupfouma’s Model
According to Moupfouma [8], the equivalent propagation path length “Leq” is obtained by
corresponds to the space between two ground stations, while “
” accounts for non-uniformity of therain on the whole propagation path.
) ) ( 1 ( exp ) ( 01 . 0 01 . 0 , 01 . 0 R L R L L R L T T T
eq
(10)
where
(
L
T)
100
for anyL
T
7
km
(10b)
and 78 . 0 2 . 44 ) ( T T L L
for any
L
T
7
km
(10c)
Therefore, the definition of rain attenuation is modified to:
) , (
. 0.01
01 . 0 01 .
0 kR Leq R LT
A
(11)
where
R
0.01andA
0.01 are the rainfall rate and path attenuation at 0.01%of the time.The model substantially overestimates the measured path attenuation, especially at lower percentages
of the time.
D. ITU-R P. 530-14 Model
The rain attenuation exceeded at 0.01% is given by [10]:
eff Rd
A0.01
(12)R kR0.01 (13)
deff dr
(14)
Substituting Equations (13) and (14) into Equation (12) yields the following
d f R d d R k A 024 . 0 exp 1 579 . 10 477 . 0 1 123 . 0 . 073 . 0 01 . 0 633 . 0 01 . 0 01 . 0 (15)
where
R
0.01(mm/h)is the rain rate exceeded at 0.01 % of the time,r
is the path reduction factor atthe same time percentage,
d
(km) is the radio path length. Parametersk
and
depend on frequency,rain temperature, and polarization, as earlier mentioned.
The attenuation Apexceeded for %pof the time,in the range 0.00 to 1% may be deduced
from the following power law:
C C p
p
p
C
A
A
10 3 2 .log1 01 . 0
(16)
With
) 1 ( 043 . 0 139 . 0 1 546 . 0 855 . 0 12 . 0 07 . 0 0 0 3 0 0 2 1 1 0 0 C C C C C CC C C
where
GHz f
GHz f
f C
10 12
. 0
10 10
log 4 . 0 12 .
0 10 0.8
0
(18)
III. METHODOLOGY
A. Site Details
Malaysia falls in the region H of the ITU-R rainfall rate climatic zoning with annual average
accumulation as high as 4184.3mm.The Malaysian climate is tropical, and is characterized by uniform
temperature, high humidity and heavy rainfall which arises mainly from the maritime exposure of the
country. Thunderstorm rainfall is the most common for Malaysian climates. The monthly cumulative
distribution of rainfall is influenced by seasonal monsoons, namely the northeast monsoon from
October to March and the southwest monsoon from April to September [6]. The measurement sites’
details are shown in Table I.
TABLE I.MEASUREMENT SITES’ DETAILS
Location Longitude
(0E)
Latitude (0N)
Frequency (GHz)
Pathlength (km)
Penang 100.29 5.27 14.8 11.3
Johor Bahru 103.43 1.30 14.8 5.83
Alor Star 100.25 6.15 15.3 4.85
Kuala Lumpur 101.36 3.04 14.8 3.96
Taiping 100.42 4.51 14.8 3.48
Temerloh 100.25 3.26 14.8 5.36
B. Experimental Procedure
The rain attenuation data were collected from six operational point-to-point microwave links of DiGi
Telecommunications Sdn. Bhd., Malaysia. Each of the microwave systems consists of a microwave
MINILINK with data acquisition and processing system. The data were sampled every second and
operating frequency of each of the links is 15 GHz. Both transmit and receive antennas are
horizontally polarized (for example, the elevation angle is approximately zero degrees). Wet antenna
effects were not included since the antennas were covered with radome during rain attenuation
measurement, in order to guarantee reliable results. The positioning of the antennas were positioned
in such a way that the sidelobes are not pointing to the ground. This ensures that the level of ground
contamination (noise) entering the sidelobes is negligible, hence interference from any other radiating
sources is negligible. Furtthermore, other effecst such as scintillations and other atmospheric
absorptions along the propagation path were not considered in the study.
The automatic gain control AGC levels (volts) were converted to the corresponding receiver data in
the form of equivalent power in dBm using the conversion chat supplied by the vendors (Sony
Ericsson Mobile Communications, Kista, Stockholm, Sweden). The signal is relatively stable in the
path attenuation. The instability in conversion process gives fluctuations of nearly ±4dB. From our
calibration, the maximum error which may be introduced by the conversion process is 2%, which
means that the accuracy of rain attenuation data is 98%. The dynamic range of the maximum signal
strength is about 50 dB for excess (i.e. rain) attenuation. This is adequately suitable for covering the
entire dynamic range of rain attenuation for this study, since the highest total path attenuation
measured is 49.32 dB at 0.001% of the time. The MINI-LINKs have availability of 99.95 % and their
specifications are given in Table II.
TABLE II.SPECIFICATIONS OF THE 15GHZ LINK
Type of antenna Front-fed parabolic
Frequency band (GHz) 15
Polarization Horizontal
Maximum transmit power
(dBm) +18.0
6
10 BER (2X2 Mbps)
Received threshold (dBm) -84.0
Antenna beam width 0
3 . 2
Dynamic range (dB) 50 dB
Antenna for both transmit and receive side
Size (m) Gain
(dBi)
0.6 37.0
The rain rate data was simultaneously recorded by positioning a Casella rain gauge, fitted
with a programmable data logger, very close to the receiving antenna. The gauge is of tipping bucket
type and the bucket size is 0.5mm of rain. The tipping time could not be recorded, but the number of
tips was recorded and stored in the built-in data logger of the rain gauge. The rain gauge’s sensitivity
and availability are 0.5mm/min and 100%, respectively. It has an operating temperature range of −10
to 500Cand it is highly reliable with a tipping accuracy of 1.00%
.
The duration of rainfall measurement was four years at Kuala Lumpur and Johor Bahru. The
rainfall rates were measured with one -minute integration time and the average values of the 4-year
measurement were correlated with the 1-year measured attenuation data for these two locations [16].
The average of the 12-year rain rate data collected from the Malaysian Meteorological Station (MMS)
were used for the remaining four sites (Penang, Taiping, Alor Star and Temerloh). The rain data have
1-h integration time, therefore Chebil and Rahman’s model [18] for converting them to the equivalent
1-minute integration time. Details of the conversion procedure from 1-h to 1-minute integration can
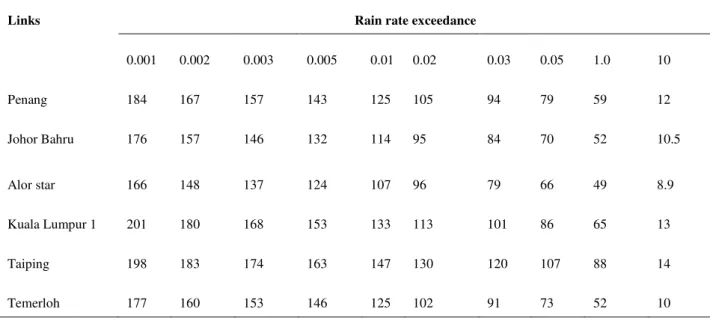
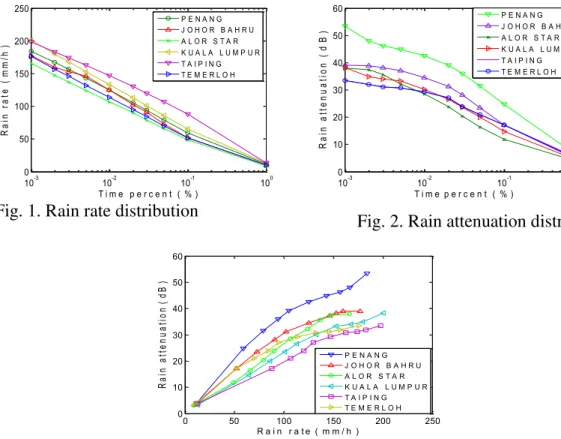
be found in [18]. The measured distributions for the rain rate and atenuation are tabulated in Tables III
and IV respectively. Moreso, Figure 1 shows the rainfall distributions, while those of rain atenuation
are shown in Figure 2. The equal probability plots of measured rainfall rate and rainfall attenuation
for all the six sites are as shown in Figure 3, which has encompased the rainfall rate exceedance as
Table III. Annual rain rate distribution
Links Rain rate exceedance
0.001 0.002 0.003 0.005 0.01 0.02 0.03 0.05 1.0 10
Penang 184 167 157 143 125 105 94 79 59 12
Johor Bahru 176 157 146 132 114 95 84 70 52 10.5
Alor star 166 148 137 124 107 96 79 66 49 8.9
Kuala Lumpur 1 201 180 168 153 133 113 101 86 65 13
Taiping 198 183 174 163 147 130 120 107 88 14
Temerloh 177 160 153 146 125 102 91 73 52 10
TABLE IV.ANNUAL RAIN ATTENUATION DISTRIBUTION
Site location Rain attenuation exceedance
0.001 0.002 0.003 0.005 0.01 0.02 0.03 0.05 1.0
Penang 53.42 48.00 46.17 44.86 42.44 39.06 36.02 31.46 24.68
Temerloh 40.78 37.59 36.25 33.14 29.91 25.77 23.58 20.35 14.36
Alorstar 37.94 37.40 35.56 32.22 28.53 23.81 20.35 16.43 11.82
Kuala Lumpur 1 38.44 34.9 33.98 33.21 30.14 26.57 23.58 20 14.71
Taiping 33.5 31.94 31.11 30.78 29.21 27.03 23.92 21.02 17.18
10-3 10-2 10-1 100 0
50 100 150 200 250
T i m e p e r c e n t ( % )
R
a
i
n
r
a
t
e
(
m
m
/ h
)
P E N A N G J O H O R B A H R U A L O R S T A R K U A L A L U M P U R T A I P I N G T E M E R L O H
Fig. 1. Rain rate distribution
10-3 10-2 10-1 100
0 10 20 30 40 50 60
T i m e p e r c e n t ( % )
R
a
i
n
a
t
t e
n
u
a
t
i o
n
(
d
B
)
P E N A N G J O H O R B A H R U A L O R S T A R K U A L A L U M P U R T A I P I N G T E M E R L O H
Fig. 2. Rain attenuation distribution
0 50 100 150 200 250
0 10 20 30 40 50 60
R a i n r a t e ( m m / h )
R
a
i
n
a
t
t e
n
u
a
t
i o
n
(
d
B
)
P E N A N G J O H O R B A H R U A L O R S T A R K U A L A L U M P U R T A I P I N G T E M E R L O H
Fig 3. Equal probability plots of rain rate and rain attenuation exceedance
I. RESULTSANDDISCUSSIONS
The comparison of measured and predicted attenuation is shown in Figure 4 (a – f). In general, all
the models, except Silva Mello model, overestimate measured values at high rain rates. For instance,
both Lin and Moupfouma models are moderately accurate at low rain rates, in the range
when p0.05%
; while both
largely overestimating the measured attenuation at high rain rates,when p0.05%
.
For instance, both Lin and Moupfouma models are moderately accurate at low rain rates, in the
range when p0.05%
; while both
largely overestimating the measured attenuation at high rainrates, when p0.05%
.
For the Johor Bahru link at 0.1, 0.01 and 0.001%, the Moupfouma model(22.3, 59.8 and 88.4 dB) and Lin model (23.1, 46.9 and 63.5 dB) nearly coincided at 0.1% of the
time, which also overestimates the measured value by almost 30%. The observed overestimation in
Moupfouma model overestimated measured data due to its
r
1
.
0
[6], [9]. This results in higherequivalent path length compared to the physical path length. That of Lin model is due overestimation
0 10 20 30 40 50 60 0 20 40 60 80 100 120 140
M e a s u r e d a t t e n u a t i o n ( d B )
P r e d i c t e d a t t e n u a t i o n ( d B )
I T U - R S i l v a M e l l o M o u p f o u m a L i n
0 5 10 15 20 25 30 35 40 0 10 20 30 40 50 60 70 80 90
M e a s u r e d a t t e n u a t i o n ( d B )
P r e d i c t e d a t t e n u a t i o n ( d B
) I T U - RS i l v a M e l l o
M o u p f o u m a L i n
(a) Penang link (b) Johor Bahru link
0 5 10 15 20 25 30 35 40
0 10 20 30 40 50 60 70
M e a s u r e d a t t e n u a t i o n ( d B )
P r e d i c t e d a t t e n u a t i o n ( d B
) I T U - R
S i l v a M e l l o M o u p f o u m a L i n
(c) Alor Star link
0 5 10 15 20 25 30 35
0 10 20 30 40 50 60 70
M e a s u r e d a t t e n u a t i o n ( d B )
P r e d i c t e d a t t e n u a t i o n ( d B )
I T U - R S i l v a M e l l o M o u p f o u m a L i n
(e) Taiping link
0 5 10 15 20 25 30 35 40
0 10 20 30 40 50 60 70
M e a s u r e d a t t e n u a t i o n ( d B )
P r e d i c t e d a t t e n u a t i o n ( d B
) I t u - R
S i l v a M e l l o M o u p f o u m a L i n
(d) Kuala Lumpur 1 link
0 10 20 30 40 50
0 10 20 30 40 50 60 70 80 90
M e a s u r e d a t t e n u a t i o n ( d B )
P r e d i c t e d a t t e n u a t i o n ( d B )
I T U - R S i l v a M e l l o M o u p f o u m a L i n
(f) Termeloh link
Fig. 4. Comparison of predicted and measured attenuation for the six links
The Silva Mello model show poor agreement with the measured data at low rain rates
((0.02% p0.1%)), with percentage error between 15 and 18 %; worse still it largely
underestimates the measurement values when rain rates are high ( p 0.01%)
. Satisfactory
performance was observed when
p 0.01%, except for the Penang link (Fig. 4a). At Penang,lies between 4.5 and 12 % for p 0.01 %. The ITU-R 530-14 model predicted excellently
when p 0.01%. Compared to the three other models, the ITU-R model is relatively acceptable when
% 01 . 0
p
;
however, it largely overestimates the measurements at extremely low rain rates,when p0.05%
.
Furthermore, predicted attenuation values were corelated with measured attenuationfor all percentages of the time, as shown in Figure 5.
At the recommended p 0.01 %
(i.e.,
99.99%availability),
Figure 5 presents the scatter plotsof attenuation versus rain rate. The numerical values are shown in Table V. For exaample, in Figure 5,
the rain rates values of 107 mm/h and 147 mm/h were corelated with the attenuation at 0.0% for the
Alor Star and Taiping sites respectively. Similarly, the rain rate 132 mm/h was mapped to the
coresponding attenuation for Termeloh site, and so on. A special case (rain rate of 125 mm/h) was
observed for both the Penang and Johor Bahru.
TABLE V.VALUES OF RAIN ATTENUATION AT 0.01% OF THE TIME
The significance of Figure 5 and Table V can be demonstrated as follows: The ITU-R
specifies the availability of 99.99% (i.e, 0.01 % of the time in an average year) for commercial
operators. Usually propagation impairments have a significant effect only for less than one percent of
the time during a year; therefore the system gain must be enhanced through an additional fade margin
to meet the desired availability and quality of service, QoS specifications [3]. For example, as shown
Table V, the prediction errors in the ITU-R are generally less than 2.0 dB except Penang link. The
measured value (42.44 dB) was overestimated (55.28 dB); and the exceptional behaviour may be due
to its longer path length (11.33 km).
Finally, the relationship between measured rain rate
R
0.01 and derived path reductionr
0.01was also investigated and plotted in Figure 6. The percentage errors of the four prediction models are
Location / rain rate @ 0.01 %
Attenuation at 0.01 %
Measured ITU-R
530-14
Silva Mello
Moupfouma Lin
Penang (125 mm/h )
42.44 55.28 47.84 81.52 76.06
Johor Bahru (125 mm/h)
34.5 36.105 30.39 59.82 46.85
Alor Star (107mm/h)
28.53 26.446 23.48 41.79 34.87
Kuala Lumpur (133 mm/h)
30.14 30.403 24.87 43.57 36.20
Taiping (147 mm/h)
29.21 31.15 25.10 42.84 35.74
Temerloh (132 mm/h)
compared in Table VI, using the Recommendation ITU-R P.311-13 [19]. When compared, Silva
Mello model shows the least mean errors
ei,
root mean squareDei and standard deviation
ei.Table VI.PERCENTAGE ERRORS AND RMS COMPARISON
Prediction
models Parameter
Time percentage ( %p )
0.1 0.05 0.03 0.01 0.005 0.003 0.001
ITU-R
ei-0.0274 -0.0306 -0.0309 -0.0276 -0.0246 -0.0230 -0.0210
ei
0.2475 0.2486 0.2488 0.2476 0.2475 0.2471 0.2471ei
D
0.2460 0.2467 0.2469 0.2461 0.2463 0.2460 0.2462Moupfouma
ei0.0434 0.0488 0.0545 0.0709 0.0851 0.0851 0.1180
ei
0.7099 0.7096 0.7092 0.7077 0.7062 0.7050 0.7014ei
D
0.7086 0.7079 0.7071 0.7042 0.7010 0.6986 0.6914Silva Mello
ei-0.0054 -0.0098 -0.0111 -0.0095 -0.0057 -0.0031 0.0039
ei
0.0686 0.0691 0.0693 0.0690 0.0686 0.0684 0.0685ei
D
0.0688 0.0698 0.0701 0.0697 0.0688 0.0685 0.0686Lin
ei0.0382 0.0371 0.0378 0.0430 0.0495 0.0536 0.0640
ei
0.4245 0.4246 0.4246 0.4241 0.4234 0.4229 0.4214ei
D
0.4228 0.4230 0.4229 0.4219 0.4205 0.4195 0.4166105 110 115 120 125 130 135 140 145 150
20 30 40 50 60 70 80 90
R a i n r a t e ( m m / h )
A
t
t
e
n
u
a
t
i
o
n
(
d
B
)
M e a s u r e d I T U - R S i l v a M e l l o M o u p f o u m a L i n
Fig. 5. Scatter plots of attenuation and rain rate
% 01 . 0
p
105 110 115 120 125 130 135 140 145 150 0.45
0.5 0.55 0.6 0.65 0.7 0.75 0.8
R a i n f a l l r a t e @ 0.01 %
P
a
t
h
r
e
d
u
c
t i
o
n
@
0
.0
1
%
P e n a n g (11.33 k m ) J o h o r B a h r u ( 5.83 k m ) A l o r S t a r ( 4.85 k m ) K u a l a L u m p u r ( 3.96 k m ) T a i p i n g ( 3.48 k m ) T e m e r l o h ( 5.36 k m )
Figure 6. Relationship between experimental
01 . 0
r
andR
0.01V. CONCLUSSIONS
The newly released ITU-R P.530-14 and three classical rain attenuation prediction models are
validated in this article, using the data bank available from six geographically spread DIGI
MINI-LINKs operating at 15 GHz in Peninsula Malaysia. Compared to the existing rain attenuation
prediction models, the R model seems to provide a significant improvement upon the older
ITU-R models. For example, the new version is able to improve the much smaller value of A0.01, compared
the attenuation CD regardless of the station latitude. However, the latest ITU-R model largely
overestimates measurements at extremely high rain rates. This further suggests for more data
campaigns from tropical and equatorial climates.
ACKNOWLEDGMENT
This research is jointly supported by Universiti Teknologi Malaysia (UTM), Malaysia and University
of Ilorin, Nigeria.
REFERENCES
[1] Crane, R. K, Electromagnetic Wave Propagation Through Rain. New York: Wiley, 1996.
[2] Ojo, J. S., M. O. Ajewole, and S. K. Sarkar, “Rain rate and rain attenuation prediction for satellite communication in Ku
and Ka bands over nigeria,” Progress In Electromagnetics Research B, Vol.5, pp. 207–223, 2008.
[3] Abdulrahman A. Y. , Rahman T. A., Rahim S. K. A. and Ul Islam M. R. A new rain attenuation conversion technique for
tropical regions. Progress In Electromagnetics Research B, Vol. 26: pp. 53 – 67, 2010.
[4] Athanasios D. Panagopoulos and John D. Kanellopoulos, “Statistics of Differential Rain Attenuation on Converging
Terrestrial Propagation Paths,” IEEE Transactions on Antennas and Propagation, Vol. 51, No. 9, pp.2514-2517, 2003.
[5]Mandeep, JS. Rain attenuation statistics over a terrestrial link at 32.6 GHz at Malaysia. IET Microw. Antennas Propag.,
Vol.3, No. 7, pp. 1086–1093, 2009.
[6] Recommendation ITU-R P.530-13: Propagation data and prediction methods required for the design of terrestrial line-of-sight systems, 2009.
[7] Pontes, M.S, Da Silva Mello L. A. R., Souza, R. S. L., Miranda, E. C. B., “Review of rain attenuation studies in tropical
and equatorial regions in Brazil, In Proceeding of the 5th International Conference on Information, Communications and
Signal processing (ICICSP 05), IEEEE Xplore, Bangkok, 2005.
[8] Ojo, J. S, Ajewole, M. O., Emiliani, L. D., “One-minute rain rate countour maps for microwave communication systems
planning in a tropical country: Nigeria,” IEEE Antenna and Propagation Magazine, October, Vol.51, No. 5, pp. 82-89,
2009.
[9] Lin, S. H., “National long term rain statistics and empirical calculation of 11GHz microwave rain attenuation,” The Bell
System Technical Journal, vol. 56, no. 9, pp. 1581-1604, 1997.
[10] Moupfouma, F., “Electromagnetic waves attenuation due to rain: A prediction model for terrestrial or L.O.S SHF and
EHF radio communication,” J. Infrared Milli Terahz Waves, vol. 30, pp.622–632, 2009.
[11] Da Silva Mello, L. A. R.; Pontes, M. S.; De Souza, R. M.; Perez Garcia, N. A., “Prediction of rain attenuation in
terrestrial links using full rainfall rate distribution,” Electronics Letters, vol. 43, no. 25, pp.1442-1443, 2007.
[12] ITU-R, Geneva, Switzerland, “Propagation data and prediction methods required for the design of terrestrial line
-of-sight systems,” Recommendation ITU-R P.530-14, 2012.
[13] Abdulrahman, A. Y.; Rahman, T. A.; Abdulrahim, S. K.; Islam, M. R., “Rain attenuation measurements over terrestrial
microwave links operating at 15GHz in Malaysia,” Int. J. of Com. Syst., vol. 25, pp.1479–1488, 2012.
[14] Goddard, J. W. F., Propagation in rain and cloud: Spartial temporal structure of rain, 2nd Edition, Propagation of Radio
Waves. The Institution of Electrical Engineers, IEE: U. K., 2003.
[15] Bryant GH, Adimula I, Riva C, Brussaard G. Rain attenuation statistics from rain cell diameters and heights. International Journal of Satellite Communications, Int. J. Satell. Commun., 19: pp. 263- 283, 2001.
[16] Abdulrahman, A. Y., Rahman, T. A., Abdulrahim, S. K., Islam, M. R, Abdulrahman, M. K. A. Rain Attenuation Predictions on Terrestrial Radio Links: Differential Equations Approach. Transactions on Emerging Telecommunications Technologies (TETT). vol. 23, pp.293-301, January 5, 2012.
[17] ITU-R, Geneva, Switzerland, “Specific attenuation model for rain for use in prediction methods,” Recommendation
ITU-R P.838-3, 2005.
[18] Chebil, J, Rahman, T. A. Rain rate statistical conversion for the prediction of rain attenuation in Malaysia. Electronics Letters, vol. 35, pp.1019-1021, 1999.
[19] ITU-R, Geneva, Switzerland, “Acquisition, presentation and analysis of data in studies of tropospheric propagation,”