BGD
7, 4153–4180, 2010FACE did not affect N2-fixation and soil C
dynamics
M. R. Hoosbeek et al.
Title Page
Abstract Introduction
Conclusions References
Tables Figures
◭ ◮
◭ ◮
Back Close
Full Screen / Esc
Printer-friendly Version
Interactive Discussion
Discussion
P
a
per
|
Dis
cussion
P
a
per
|
Discussion
P
a
per
|
Discussio
n
P
a
per
|
Biogeosciences Discuss., 7, 4153–4180, 2010 www.biogeosciences-discuss.net/7/4153/2010/ doi:10.5194/bgd-7-4153-2010
© Author(s) 2010. CC Attribution 3.0 License.
Biogeosciences Discussions
This discussion paper is/has been under review for the journal Biogeosciences (BG). Please refer to the corresponding final paper in BG if available.
Free atmospheric CO
2
enrichment did not
a
ff
ect symbiotic N
2
-fixation and soil
carbon dynamics in a mixed deciduous
stand in Wales
M. R. Hoosbeek1, M. Lukac2, E. J. Velthorst1, and D. L. Godbold3
1
Department of Environmental Sciences, Earth System Science – Climate Change, Wageningen University, P.O. Box 47, 6700AA Wageningen, The Netherlands
2
Imperial College London, South Kensington Campus, London SW7 2AZ, UK
3
School of the Environment & Natural Resources, Bangor University, Bangor, Gwynedd LL57 2UW, UK
Received: 28 April 2010 – Accepted: 24 May 2010 – Published: 4 June 2010
Correspondence to: M. R. Hoosbeek ([email protected])
BGD
7, 4153–4180, 2010FACE did not affect N2-fixation and soil C
dynamics
M. R. Hoosbeek et al.
Title Page
Abstract Introduction
Conclusions References
Tables Figures
◭ ◮
◭ ◮
Back Close
Full Screen / Esc
Printer-friendly Version
Interactive Discussion
Discussion
P
a
per
|
Dis
cussion
P
a
per
|
Discussion
P
a
per
|
Discussio
n
P
a
per
|
Abstract
Through increases in net primary production (NPP), elevated CO2 is hypothesizes to
increase the amount of plant litter entering the soil. The fate of this extra carbon on the forest floor or in mineral soil is currently not clear. Moreover, increased rates of NPP can be maintained only if forests can escape nitrogen limitation. In a Free atmospheric 5
CO2Enrichment (FACE) experiment near Bangor, Wales, 4 ambient CO2and 4 FACE
plots were planted with patches ofBetula pendula,Alnus glutinosa and Fagus sylvat-ica on a former arable field. Four years after establishment, only a shallow L forest floor litter layer had formed due to intensive bioturbation. Total soil C and N contents increased irrespective of treatment and species as a result of afforestation. We could 10
not detect an additional C sink in the soil, nor were soil C stabilization processes af-fected by FACE. We observed a decrease of leaf N content inBetula andAlnusunder FACE, while the soil C/N ratio decreased regardless of CO2treatment. The ratio of N
taken up from the soil and by N2-fixation inAlnuswas not affected by FACE. We infer that increased nitrogen use efficiency is the mechanism by which increased NPP is 15
sustained under elevated CO2at this site.
1 Introduction
Using an indirect method, Canadell et al. (2007) estimated the terrestrial carbon (C) sink to account for about a third of total anthropogenic carbon dioxide (CO2) emissions at present. Forest ecosystems are hypothesized to constitute a large part of this sink 20
and to sequester C due to their regrowth and atmospheric CO2fertilization (Houghton,
2003; Janssens et al., 2003; McMahon et al., 2010). In order to test this hypothesis and to assess the strength of this feedback, Free Air CO2Enrichment (FACE) experi-ments in aggrading temperate forests and plantations were initiated. To date, existing experiments have demonstrated that rising atmospheric CO2 concentrations result in
25
BGD
7, 4153–4180, 2010FACE did not affect N2-fixation and soil C
dynamics
M. R. Hoosbeek et al.
Title Page
Abstract Introduction
Conclusions References
Tables Figures
◭ ◮
◭ ◮
Back Close
Full Screen / Esc
Printer-friendly Version
Interactive Discussion
Discussion
P
a
per
|
Dis
cussion
P
a
per
|
Discussion
P
a
per
|
Discussio
n
P
a
per
|
(Calfapietra et al., 2003; DeLucia et al., 1999; Gielen et al., 2005; Hamilton et al., 2002; Handa et al., 2006; Karnosky et al., 2003; Liberloo et al., 2009; Norby et al., 2002). Norby et al. (2005) analyzed the response of NPP to elevated CO2in four forest
FACE experiments and found that its response is well conserved across a broad range of productivity, with a stimulation at the median of 23±2%.
5
In general, the aboveground biomass contributes its C to the forest litter layer, where it is partially respired and partially incorporated into the mineral soil. Root litter con-tributes C directly to the mineral soil or, if present, also to the forest litter layer. The extra C taken up due to increased atmospheric CO2 concentrations may also be stored in
forest floor litter, organic O and mineral A horizon. Long term C storage is however 10
thought to primarily take place in mineral soil horizons due to the occurrence of C sta-bilization mechanisms (Sollins et al., 2006; Six et al., 2002; Von L ¨utzow et al., 2006).
As N availability commonly limits forest productivity, some combination of increased N uptake from the soil and more efficient use of the N assimilated by trees will be necessary to sustain the higher rates of forest NPP at future levels of CO2. Based on
15
data from four forest FACE sites, Finzi et al. (2007) demonstrated that increases in N uptake rather than N-use efficiency support high rates of temperate forest productivity under elevated CO2. Nitrogen is also needed for the long term storage of C in stable
organic matter fractions in the forest floor and mineral soil. In a meta-analysis based on 65 studies, Van Groenigen et al. (2006) found that soil C content only increases under 20
elevated CO2when N is added at rates well above typical atmospheric deposition.
Biological N2-fixation may be a possible source of N to sustain increased N uptake
due to high rates of temperate forest productivity under elevated CO2 (Vitousek et al., 2002). Although assimilation of N by N2-fixation is considered to be more costly than
uptake of ammonium or nitrate at the plant level, the extra cost might be offset by 25
greater availability of assimilates in high CO2. In a growth chamber experiment, ele-vated CO2increased dry weight and total nitrogenase activity ofRobinia pseudoacacia
andAlnus glutinosaseedlings, supporting the premise that CO2enrichment can
BGD
7, 4153–4180, 2010FACE did not affect N2-fixation and soil C
dynamics
M. R. Hoosbeek et al.
Title Page
Abstract Introduction
Conclusions References
Tables Figures
◭ ◮
◭ ◮
Back Close
Full Screen / Esc
Printer-friendly Version
Interactive Discussion
Discussion
P
a
per
|
Dis
cussion
P
a
per
|
Discussion
P
a
per
|
Discussio
n
P
a
per
|
rubra, Arnone III and Gordon (1990) observed a positive feedback loop between N-fixation and photosynthesis in nodulated plants growing under elevated CO2. Similarly,
in a number of open-top chamber experiments, symbiotic N2-fixing Alnus glutinosa
trees showed a positive response to elevated CO2 (Vogel et al., 1997; Temperton et al., 2003).
5
In 2004 a mixed deciduous forest FACE experiment was initiated near Bangor, Wales, UK. This is the first FACE experiment which includes a symbiotic N2-fixing tree, offering an opportunity to study the effects of elevated CO2on N fixation in forests.
Tak-ing into account preliminary biomass growth observations and published results from other forest FACE experiments, we formulated the following hypotheses:
10
1. In order to sustain higher rates of forest NPP under FACE, additional N is taken up from the soil.
2. FACE stimulates symbiotic N2-fixation by increasing C availability inAlnus
gluti-nosaroot nodules, increasing the ratio of N taken up by N2-fixation to N taken up from the soil.
15
3. Total soil C content and, to a lesser extent, N content increase due to afforestation. 4. Increased NPP under FACE creates additional C storage in the soil.
5. The additional soil C input due to FACE results in an increase of coarse, fine and micro-aggregate protected particulate organic matter (POM).
2 Methods
20
BGD
7, 4153–4180, 2010FACE did not affect N2-fixation and soil C
dynamics
M. R. Hoosbeek et al.
Title Page
Abstract Introduction
Conclusions References
Tables Figures
◭ ◮
◭ ◮
Back Close
Full Screen / Esc
Printer-friendly Version
Interactive Discussion
Discussion
P
a
per
|
Dis
cussion
P
a
per
|
Discussion
P
a
per
|
Discussio
n
P
a
per
|
over gravel (Rheidol series) classified as a Dystric Cambisol in the FAO system (Tek-lehaimanot et al., 2002). The parent material consists of postglacial alluvial deposits from the Aber river, comprising Snowdonian rhyolitic tuffs and lavas, microdiorites and dolerite in the stone fractions and Lower Paleozoic shale in the finer fractions. The topography consists of a shallow slope of approximately 1–2◦ on a deltaic fan. The 5
aspect is northwesterly, at an altitude of 13 to 18 m a.s.l. The depth of the water table ranges between 1 and 6 m.
Trees were planted on two adjacent fields, one of which was previously used both as pasture and arable land, whereas the other was used for small scale agroforestry experiments. The experimental plots were 8 m in diameter, the seedlings of Betula
10
pendula, Alnus glutinosa and Fagus sylvatica were planted inside the plots at 80 cm spacing in a hexagonal design. The species were planted in a pattern that created mixtures containing one, two and three species. For the purposes of this study, 4 mixtures have been monitored within each experimental plot; three single species sub-plots and a sub-plot containing the mixture of all tree species. The experimental sub-plots 15
were surrounded by a 10 m buffer strip containing the same species and planted at the same density and pattern. The rest of the plantation was planted with a mixture of tree species at slightly smaller density. In total, 4 ambient and 4 FACE plots were randomly located within the plantation in order to form a complete replicated block de-sign. Carbon enrichment started in April 2005 and was achieved by injecting pure CO2 20
through laser-driller holes in tubing mounted on eight masts (Miglietta et al., 2001). The elevated CO2 concentrations, measured at 1 min intervals, were within 30% deviation
from the pre-set target concentration of 580 ppm CO2for 75–79% of the time during the photosynthetically active part of 2005–2008. The CO2used for enrichment originated
from natural gas and had aδ13C of−39‰. 25
BGD
7, 4153–4180, 2010FACE did not affect N2-fixation and soil C
dynamics
M. R. Hoosbeek et al.
Title Page
Abstract Introduction
Conclusions References
Tables Figures
◭ ◮
◭ ◮
Back Close
Full Screen / Esc
Printer-friendly Version
Interactive Discussion
Discussion
P
a
per
|
Dis
cussion
P
a
per
|
Discussion
P
a
per
|
Discussio
n
P
a
per
|
and N analyses and fractionation. After transportation in a mobile refrigerator, the ring samples were dried at 105◦C for 3 d, while the bulk samples were split in a part that was dried at room temperature and a part that was stored at 4◦C. Bulk densities were calculated based on oven dry weight of the ring samples and ring volume.
Soil texture and pH were only determined for the 2004 samples. After pre-treatment 5
of the samples, the particle size distribution was measured by laser diffraction (Coulter LS230 Grain Sizer; Buurman et al., 1996). Soil pH was measured with a pH meter (Orion 701A) in a 1 M KCl solution suspension.
For C and N analyses, sub-samples of the air-dried bulk samples were crushed by hand and ball milled after roots were removed. No carbonates were present in the 10
soil. Ammonium and nitrate were measured colorimetrically in a 1 M KCl extraction by using an auto analyzer (Buurman et al., 1996). Total C and N were determined with an elemental analyzer (Interscience EA 1108) and expressed as gram C or N per m2 per depth increment.
2.1 Isotope analyses
15
In 2007, leaves and young branches ofBetula and Alnus and soil samples from all sub-plots were collected, dried, milled and prepared and sent for analysis at the Stable Isotope Laboratory at UC Davis (http://stableisotopefacility.ucdavis.edu). Results were expressed as δ13C (‰) versus the PDB standard and as δ15N (‰) versus standard air. The fraction of soil C derived from litter input (Cnew) between October of 2004 and
20
2007 (fnew C) was calculated as (Balesdent et al., 1988; Van Kessel et al., 2000):
fnew C=
δ13Csoil FACE−δ 13
Csoil ambient
δ13C
new−δ13Csoil ambient
(1)
The new soil C input (g C m−2
) into the 0–10 cm increment of the FACE plots was calculated as:
Csoil new=fnew C·Csoil FACE (2)
BGD
7, 4153–4180, 2010FACE did not affect N2-fixation and soil C
dynamics
M. R. Hoosbeek et al.
Title Page
Abstract Introduction
Conclusions References
Tables Figures
◭ ◮
◭ ◮
Back Close
Full Screen / Esc
Printer-friendly Version
Interactive Discussion
Discussion
P
a
per
|
Dis
cussion
P
a
per
|
Discussion
P
a
per
|
Discussio
n
P
a
per
|
The fraction of N inAlnustrees derived from N2-fixation (fn) was calculated as (Amarger
et al., 1979; Cadish et al., 2000):
fn=
δ15Nbirch−δ 15
Nalder
δ15N
birch−B
(3)
where birch serves as the non-N2-fixing reference tree and B is a measure of isotopic
fractionation during N2-fixation with value−2.6‰ forAlnus glutinosaleaves (Domenach
5
et al., 1989).
2.2 Physical fractionation
Physical fractionation according to Six et al. (2002) was applied to soil samples in order to measure soil carbon storage. Soil C is stabilized for a relatively longer term within micro-aggregates formed in afforested and forested ecosystems. To quantify 10
micro-aggregate creation, we used a “micro-aggregate isolator”, as described by Six et al. (2002), to break up the macro-aggregates while minimizing the break down of the released micro-aggregates. In short, air dried samples were left to slake in deionized water for 5 min. The samples were then poured on top of a 250 µm mesh screen and shaken with 50 glass beads (4 mm diameter). A continuous water flow through the 15
device flushed all released micro-aggregates immediately onto a 53 µm sieve, thus avoiding further disruption. After a complete breakup of macro-aggregates, coarse particulate organic matter (cPOM) and sand remained on the 250 µm mesh screen. The micro-aggregates and the clay and silt sized fraction were separated by a 53 µm sieve. The three obtained fractions, cPOM (>250 µm), micro-aggregates and fine POM 20
(53–250 µm) and the silt and clay sized fraction (<53 µm) were washed into beakers and oven-dried at 50◦C.
BGD
7, 4153–4180, 2010FACE did not affect N2-fixation and soil C
dynamics
M. R. Hoosbeek et al.
Title Page
Abstract Introduction
Conclusions References
Tables Figures
◭ ◮
◭ ◮
Back Close
Full Screen / Esc
Printer-friendly Version
Interactive Discussion
Discussion
P
a
per
|
Dis
cussion
P
a
per
|
Discussion
P
a
per
|
Discussio
n
P
a
per
|
in 50 ml conical tubes. The tubes were gently shaken 10 times end over end. Ma-terial remaining on the cap and sides of the tubes was rinsed back into solution with more SPT solution and the volume was made up to the 40 ml mark. The tubes were placed under vacuum (−138 kPa) for 10 min. After this, the samples were left to rest for 20 min, tubes were balanced with SPT, capped and centrifuged for 60 min at 1250 g. 5
Floating material (LF) was aspirated onto a pre-weighed glass fibre filter, SPT solution was decanted over the filter. The glass fibre filters containing the light fraction were rinsed twice with demineralised water, dried and weighed. The micro-aggregate frac-tion (heavy fracfrac-tion, HF) was rinsed twice by adding demineralised water, shook until all material was suspended again and centrifuged. The solution was decanted after cen-10
trifugation. Next, the micro-aggregates were dispersed by adding hexametaphosphate (0.5%). After shaking in a reciprocal shaker for about 18 h, the solution was poured on a 53 µm sieve and washed with deionised water. The micro-aggregate protected POM which remained on the sieve was dried at 50◦C.
2.3 Statistical model
15
The BangorFACE experiment was set up as a replicated split-plot design with four blocks, each containing one control and one FACE plot. Each plot contained seven sub-plots forming mixtures of one, two or three tree species. The numbers of replicates per treatment are therefore: CO2 treatmentn=8 (4 ambient+4 FACE); Speciesn=32
(8Betula pendula+8Alnus glutinosa+8Fagus sylvatica+8 mix of the three species). 20
Two versions of the same general linear model (SPSS 15.0) were used for the analy-sis of respectively 1) data obtained at one point in time, and 2) data obtained in consec-utive years (repeated measures ANOVA). Version 1 was build with the following factors: CO2trmt (fixed), Species (fixed) and Block (random). For version 2 of the model Year (fixed) was added. Main or interaction effects were considered to be significant when 25
BGD
7, 4153–4180, 2010FACE did not affect N2-fixation and soil C
dynamics
M. R. Hoosbeek et al.
Title Page
Abstract Introduction
Conclusions References
Tables Figures
◭ ◮
◭ ◮
Back Close
Full Screen / Esc
Printer-friendly Version
Interactive Discussion
Discussion
P
a
per
|
Dis
cussion
P
a
per
|
Discussion
P
a
per
|
Discussio
n
P
a
per
|
3 Results
3.1 Initial soil conditions
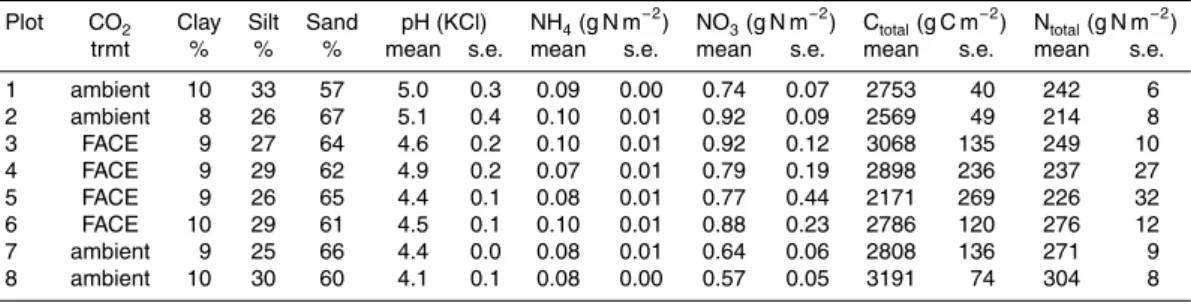
Soil clay percentage varied between 8 and 10% among all plots, whereas silt var-ied between 25 and 33% (Table 1). These textural differences are relatively mi-nor and the soils of all plots were well within the “sandy loam” textural class 5
(Soil Survey Division Staff, 1993). The initial soil pH ranged between 4.1 and 5.1 among the plots, however, the mean pH of control and FACE plots was about equal, i.e. 4.6 (s.e. 0.2) and 4.6 (0.1), respectively. The initial ammonium concentrations of the control and FACE plots were 0.09 (0.00) and 0.09 (0.00) g N m−2, respectively, whereas the nitrate concentrations were 0.72 (0.05) and 0.84 (0.12) g N m−2, respectively. These 10
concentrations were not significantly different at the plot, block or CO2treatment level.
The initial soil C and N contents of the plots were significantly different, ranging between 2171 (269) and 3191 (74) g C m−2
and 214 (8) and 304 (8) g N m−2
. However, averaged for the CO2 treatments, the initial differences did not differ significantly, i.e.
2830 (69) and 2731 (125) g C m−2 and 258 (9) and 247 (11) g N m−2 respectively for 15
control and FACE plots.
3.2 Change of soil C and N
During the experiment, the above ground litter input resulted in an L (almost undecom-posed litter less than one year old) forest floor litter layer under most of the plantation. Over the years while taking soil samples, we observed an increasing number of earth-20
worms, their populations probably recovering from the previous use of the site and the field preparation during 2004. In this system, the early phase of litter decomposition (primarily leaching) probably takes place in the L layer, but most of the decomposition then occurs in the top of the mineral soil after the litter had been incorporated into the soil by bioturbation.
BGD
7, 4153–4180, 2010FACE did not affect N2-fixation and soil C
dynamics
M. R. Hoosbeek et al.
Title Page
Abstract Introduction
Conclusions References
Tables Figures
◭ ◮
◭ ◮
Back Close
Full Screen / Esc
Printer-friendly Version
Interactive Discussion
Discussion
P
a
per
|
Dis
cussion
P
a
per
|
Discussion
P
a
per
|
Discussio
n
P
a
per
|
Between October of 2004 and 2008, total soil C content at 0–10 cm depth increased by 530 under ambient CO2and 555 g C m−
2
under FACE (Fig. 1a), whereas total soil N increased by 77 and 86 g N m−2, respectively (Fig. 1b). The increase with time was significant for both C and N, but the CO2treatment and species effects were not
signif-icant. The C/N ratios decreased in 2005, increased in 2006, and decreased again in 5
2007 (Fig. 1c). Including the N2-fixing species (Alnus) did not affect the C/N ratio, i.e.
there was no species effect, nor was there a CO2treatment effect.
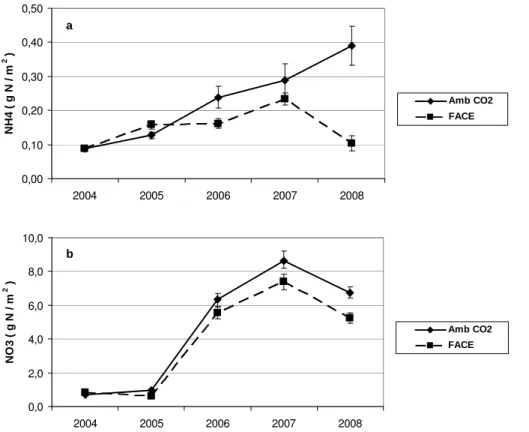
Ammonium-N increased under ambient CO2throughout the experiment, while under FACE we observed the same trend apart from a decrease in 2008 (Fig. 2a). The FACE effect was significant, whereas time and species effects were not. Nitrate-N increased 10
during 2006 and 2007 but decreased in 2008 under both ambient CO2 and FACE (Fig. 2b). CO2 treatment and species did not affect NO3-N, whereas the change with
time was significant.
3.3 Soilδ13C
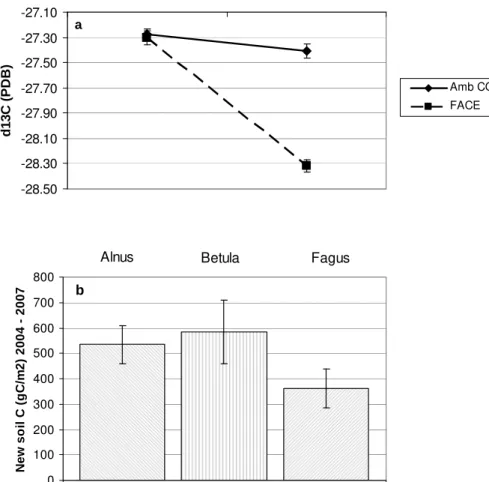
Due to the use of CO2 gas with a δ13C value of −39‰, the δ13C value of soil C in 15
the top 10 cm of the FACE plots decreased from −27.30 to −28.32‰ during the first three years of fumigation (Fig. 3a). Theδ13C values of soil C in the ambient CO2plots
served as reference values. Based on the decrease ofδ13C of soil C in the FACE plots, δ13C of litter and δ13C of soil C in the ambient CO2plots, we estimated the average
input of new soil C into the FACE plots to be 494 (se 64) g C m−2 between October of 20
2004 and 2007. The largest input of new soil C took place underAlnus and Betula, although this species effect was not significant (Fig. 3b).
3.4 N2-fixation
The N concentration in Alnus and Betula leaves was lower under FACE than under ambient CO2(Table 2). Theδ
15
N values of leaves of the reference tree (Betula) were 25
BGD
7, 4153–4180, 2010FACE did not affect N2-fixation and soil C
dynamics
M. R. Hoosbeek et al.
Title Page
Abstract Introduction
Conclusions References
Tables Figures
◭ ◮
◭ ◮
Back Close
Full Screen / Esc
Printer-friendly Version
Interactive Discussion
Discussion
P
a
per
|
Dis
cussion
P
a
per
|
Discussion
P
a
per
|
Discussio
n
P
a
per
|
respectively. Theseδ15N values represent the uptake of N solely from the soil. Dom-enach et al. (1989) measured the δ15N of leaves as −2.6±0.6 in Alnus grown with atmospheric N2as the sole source of N. which represents the B value and is the mea-sure of isotopic fractionation during N2-fixation. In Alnus, we observed δ
15
N values of−0.74 (se 0.16) and−0.53‰ (se 0.13) respectively under ambient CO2 and FACE.
5
Based on the sole soil N versus sole N2 source, and the observedδ 15
N values in Al-nus, we estimated the fraction of N uptake inAlnusthrough N2-fixation (fn) to be 0.61
(se 0.02) under ambient and 0.60 (se 0.02) under elevated CO2.
3.5 Soil organic matter fractionation
Averaged over the species, the coarse POM C fraction was larger under FACE than 10
under ambient CO2, 877 and 732 g C m− 2
, respectively, however this effect was not significant (P=0.356, Table 3). The coarse POM N fractions were about equal under ambient CO2and FACE (P=0.928). Neither coarse POM C or N fractions were affected
by species (P=0.230 andP=0.067).
Similarly to coarse POM, the fine POM C fraction was larger under FACE than under 15
ambient CO2, 193 and 144 g C m− 2
respectively and this effect was also not significant (P=0.138). However, the fine POM N fraction was significantly larger under FACE than under ambient CO2, i.e. 16 and 11 g N m−
2
(P=0.041). The fine POM C and N fractions were not affected by species (P=0.650 andP=0.950).
The micro-aggregate protected POM C fraction was larger under ambient CO2than 20
under FACE, i.e. 547 and 449 g C m−2(P=0.200). The micro-aggregate protected POM N fraction was also larger under ambient CO2(40 and 33 g C m−
2
BGD
7, 4153–4180, 2010FACE did not affect N2-fixation and soil C
dynamics
M. R. Hoosbeek et al.
Title Page
Abstract Introduction
Conclusions References
Tables Figures
◭ ◮
◭ ◮
Back Close
Full Screen / Esc
Printer-friendly Version
Interactive Discussion
Discussion
P
a
per
|
Dis
cussion
P
a
per
|
Discussion
P
a
per
|
Discussio
n
P
a
per
|
4 Discussion
4.1 Change of soil C
The increase of total C in the top 10 cm of the mineral soil during the four year experi-ment was about equal under ambient CO2and FACE, reaching 530 and 555 g C m−
2
, respectively, which makes the expected additional C sink under elevated CO2
negli-5
gible and, in this experiment, insignificant. Similarly, we did not observe any species effect on soil C, which may in part have been obscured by wind redistribution of above ground litter between the patches of different tree species. In 2007, cross contamina-tion with leaves from other species, based on litterfall data published elsewhere, was about 24–27% of the total litterfall within alder and birch single species patches. The 10
beech leaves remained on branches until the following spring and then slowly shed. The observed increase of soil C, irrespective of treatment, is therefore due to aff oresta-tion of the former agricultural fields. Based on theδ13C data we estimated the average input of new soil C into the FACE plots to be 494 (se 64) g C m−2between October of 2004 and 2007. This input seems to relate well to the average increase of total soil C 15
in the FACE plots over the same period, i.e. 486 g C m−2(Fig. 1a).
Carbon storage in litter and soil has been assessed at several other forest FACE ex-periments. For instance, at the Duke Forest and POP-EuroFACE experiments a signifi-cant additional C sink was created in the litter layer after six years of elevated CO2 treat-ment (Table 4) (Lichter et al., 2005; Hoosbeek and Scarascia-Mugnozza, 2009). How-20
ever, in Duke Forest the stimulation of organic matter accumulation by FACE ceased after the sixth year, resulting in an average additional C sink of∼30 g C m−2yr−1 over the nine year experiment (Lichter et al., 2008). At both sites, characterized by neg-ligible bioturbation, the increase of C in the mineral soil depended solely on C input from roots and on downward leaching of DOC from the litter layers. In these forests 25
BGD
7, 4153–4180, 2010FACE did not affect N2-fixation and soil C
dynamics
M. R. Hoosbeek et al.
Title Page
Abstract Introduction
Conclusions References
Tables Figures
◭ ◮
◭ ◮
Back Close
Full Screen / Esc
Printer-friendly Version
Interactive Discussion
Discussion
P
a
per
|
Dis
cussion
P
a
per
|
Discussion
P
a
per
|
Discussio
n
P
a
per
|
incorporated into the mineral soil by bioturbation. This resulted, in combination with C input from root turnover, in a significant additional C sink in the top 5 cm of the mineral soil (Jastrow et al., 2005). At the 0–15 cm increment, however, this FACE effect on soil C was no longer significant. Hoosbeek and Scarascia-Mugnozza (2009) hypothesized that the mixing of above ground litter into the mineral soil by bioturbation may have fa-5
cilitated the FACE effect at the 0–5 cm increment. At the BangorFACE experiment, we also observed bioturbation which resulted in the “concentration” of above and below ground litter inputs at the top of mineral soil. However, at the BangorFACE site this “concentration effect” did not amplify a possible FACE effect on soil C storage.
4.2 Soil organic matter stabilization
10
In order to evaluate the effect of elevated CO2 on soil C dynamics it is not sufficient to
only look at changes in total C content, but it is also necessary to assess possible soil C stabilization mechanisms. The stability of SOM is controlled by the chemical structure of the organic matter and the existence of protection offered by the soil matrix and min-erals (Baldock and Skjemstad, 2000; Krull et al., 2003; Davidson and Janssens, 2006). 15
Oades (1993) suggested a model of aggregate formation in which micro-aggregates (∼100 µm in diameter) are formed within macro-aggregates (> 250 µm in diameter). Fresh litter entering the soil forms sites for microbial activity and nucleation centers for aggregation (Six et al., 2002). This fraction is, in the conceptual model of aggregate formation, represented by coarse POM (>250 µm). We observed that C and N con-20
tents of this coarse POM fraction were not significantly larger under FACE, meaning that the first phase towards SOM stabilization was not significantly enhanced under FACE.
As the organic matter enclosed in the macro-aggregates is decomposed, fine POM and micro-aggregates (53–250 µm) are formed. The fine POM C fraction was not af-25
fected by CO2 treatment or species, implying that the next step towards stabilization
BGD
7, 4153–4180, 2010FACE did not affect N2-fixation and soil C
dynamics
M. R. Hoosbeek et al.
Title Page
Abstract Introduction
Conclusions References
Tables Figures
◭ ◮
◭ ◮
Back Close
Full Screen / Esc
Printer-friendly Version
Interactive Discussion
Discussion
P
a
per
|
Dis
cussion
P
a
per
|
Discussion
P
a
per
|
Discussio
n
P
a
per
|
FACE, suggesting increased microbial activity and N-immobilization. At the smallest scale, the micro-aggregate protected C and N fractions were also not affected by CO2
treatment and species.
The degree of soil C stabilization was found to vary among FACE experiments with trees. At Duke Forest, the increase of soil C due to forest regrowth occurred entirely 5
within the free light fraction, while the iPOM and mineral associated fractions were not affected by FACE (Lichter et al., 2005). No additional soil C protection and stabilization took place. At Oak Ridge, the protection and stabilization processes in the soil kept up with the extra C input under FACE, i.e. the additional C input due to FACE was protected at the same rate as under ambient CO2 (Jastrow et al., 2005). At POP-EuroFACE, 10
iPOM and mineral associated C and N fractions increased in macro-aggregates and in newly formed micro-aggregates which indicates that protection and stabilization pro-cesses increased due to FACE (Hoosbeek and Scarascia-Mugnozza, 2009). However, at BangorFACE, we observed no FACE or species effect on soil C stabilization mech-anisms, leading us to conclude that soil C stabilization processes were not affected by 15
CO2treatment or by species.
4.3 Soil N and N uptake
Total soil N was not affected by CO2treatment or species and nor was the C/N ratio. However, the interannual variation of soil C and N did not follow the same pattern. In 2004 and 2005 the NPP was still relatively low, but increased in 2006. As a result, in 20
2006 soil C increased both under ambient CO2and FACE, however, the increase under FACE was smaller. At the same time, soil N did not change under ambient CO2while
there was a decrease under FACE. Based on a higher NPP under FACE, we expected a reverse scenario, i.e. a larger increase of soil C and N under FACE. However, the extra NPP under FACE could have resulted in a larger availability of labile substrate in 25
BGD
7, 4153–4180, 2010FACE did not affect N2-fixation and soil C
dynamics
M. R. Hoosbeek et al.
Title Page
Abstract Introduction
Conclusions References
Tables Figures
◭ ◮
◭ ◮
Back Close
Full Screen / Esc
Printer-friendly Version
Interactive Discussion
Discussion
P
a
per
|
Dis
cussion
P
a
per
|
Discussion
P
a
per
|
Discussio
n
P
a
per
|
N in 2006 under FACE. Usually, a priming effect is a temporal phenomenon, as was observed by Hoosbeek and Scarascia-Mugnozza (2009).
Afforestation of our experimental fields has increased the litter input in comparison with previous crops, resulting in an increase of NH4-N in the soil. This increase was significantly smaller under FACE between 2006–2008, probably due to the combination 5
of increased nitrification, microbial activity or plant uptake under FACE. Soil NO3-N
increased after 2005 which may also have been due to the increased turnover of SOM, while larger uptake under FACE may explain lower NO3-N. The N concentration in
AlnusandBetulaleaves was lower under FACE than under ambient CO2, which means
that the demand for more N in order to sustain higher NPP under FACE was at least in 10
part met by an increase of the N-use efficiency (NUE). A similar effect was observed by Calfapietra et al. (2007) in threePopulusspecies in POP-EuroFACE in central Italy. Since Alnus supports symbiotic N2-fixation, we hypothesized that it would be able
to gain extra N by increasing the C supply to N2-fixing bacteria. We did not observe this effect, the N uptake ratio (N2-fixation/soil N) did not change in high CO2treatment.
15
Alnusgrowing in elevated CO2did not use the extra available NPP (labile C) to increase
symbiotic N2-fixation in order to meet the higher N demand under higher NPP. Instead,
Alnusincreased its NUE.
Finzi et al. (2007) pointed out that some combination of increased N uptake from the soil and more efficient use of the N already assimilated by trees is necessary to sustain 20
the high rates of forest NPP under FACE. Based on a larger FACE data set including a wider variety of plants, Leakey et al. (2009) concluded that elevated CO2increases
NUE. At Oak Ridge, the FACE induced soil C accrual was accompanied by a significant increase in soil N, i.e. FACE did not affect the C/N ratio of the mineral soil. Jastrow et al. (2005) postulated that FACE also affected N cycling by some combination of 25
BGD
7, 4153–4180, 2010FACE did not affect N2-fixation and soil C
dynamics
M. R. Hoosbeek et al.
Title Page
Abstract Introduction
Conclusions References
Tables Figures
◭ ◮
◭ ◮
Back Close
Full Screen / Esc
Printer-friendly Version
Interactive Discussion
Discussion
P
a
per
|
Dis
cussion
P
a
per
|
Discussion
P
a
per
|
Discussio
n
P
a
per
|
decreased under FACE while the soil C/N ratio was not affected by FACE. From this we infer that at Bangor the major mechanism to sustain increased NPP under FACE is also based on increased NUE. This fits well with the conclusions of (Finzi et al., 2007) (Table 4) stating that on the one hand, at sites with N-limited growth, i.e. Duke Forest and Oak Ridge, trees increase N uptake from the soil supporting greater NPP, while 5
on the other hand, at sites without N-limitation, i.e. POP-EuroFACE and BangorFACE established on former agricultural soils, increased N-use efficiency seems to be the major mechanism sustaining increased NPP under FACE.
Acknowledgement. The development of the Bangor FACE site was funded by SRIF. We thank
the Forestry Commission Wales and CIRRE for support of the running costs.
10
References
Amarger, N., Mariotti, A., Mariotti, F., Durr, J. C., Bourguignon, C., and Lagacherie, B.: Esti-mate of symbiotically fixed nitrogen in field grown soybeans using variations in 15 N natural abundance, Plant Soil, 52, 269–280, 1979.
Arnone III, J. A. and Gordon, J. C.: Effect of nodulation, nitrogen fixation and CO2enrichment
15
on the physiology, growth and dry mass allocation of seedlings ofAlnus rubraBong., New Phytol., 116, 55–66, 1990.
Baldock, J. A. and Skjemstad, J. O.: Role of the soil matrix and minerals in protecting natural organic materials against biological attack, Org. Geochem., 31, 697–710, 2000.
Balesdent, J., Wagner, G. H., and Mariotti, A.: Soil organic matter turnover in long-term field
20
experiments as revealed by carbon-13 natural abundance, Soil Sci. Soc. A. J., 52, 118–124, 1988.
Buurman, P., Van Lagen, B., and Velthorst, E. J.: Manual for Soil and Water Analysis, Backhuys Publishers, Leiden, The Netherlands, 1996.
Cadish, G., Hairiah, K., and Giller, K. E.: Applicability of the natural15N abundance technique
25
to measure N2fixation inArachis hypogaeagrown on an Ultisol, Neth. J. Agr. Sci., 48, 31–45, 2000.
BGD
7, 4153–4180, 2010FACE did not affect N2-fixation and soil C
dynamics
M. R. Hoosbeek et al.
Title Page
Abstract Introduction
Conclusions References
Tables Figures
◭ ◮
◭ ◮
Back Close
Full Screen / Esc
Printer-friendly Version
Interactive Discussion
Discussion
P
a
per
|
Dis
cussion
P
a
per
|
Discussion
P
a
per
|
Discussio
n
P
a
per
|
Ceulemans, R., and Scarascia-Mugnozza, G.: Free-air CO2 enrichment (FACE) enhances biomass production in a short-rotation poplar plantation, Tree Physiol., 23, 805–814, 2003. Calfapietra, C., De Angelis, P., Gielen, B., Lukac, M., Moscatelli, M. C., Avino, G.,
Lago-marsino, A., Polle, A., Ceulemans, R., Scarascia-Mugnozza, G., Hoosbeek, M. R., and Cotrufo, M. F.: Increased nitrogen-use efficiency of a short-rotation polar plantation in
el-5
evated CO2concentration, Tree Physiol., 27, 1153–1163, 2007.
Canadell, J. G., Le Qu ´er ´e, C., Raupach, M. R., Field, C. B., Buitenhuis, E. T., Ciais, P., Con-way, T. J., Gillett, N. P., Houghton, R. A., and Marland, G.: Contributions to accelerating atmospheric CO2 growth from economic activity, carbon intensity, and efficiency of natural sinks, Proc. Natl. Acad. Sci. USA, 104(47), 18866–18870, 2007.
10
Davidson, E. A. and Janssens, I. A.: Temperature sensitivity of soil carbon decomposition and feedbacks to climate change, Nature, 440, 165–173, doi:10.1038/nature04514, 2006. DeLucia, E. H., Hamilton, J. G., Naidu, S. L., Thomas, R. B., Andrews, J. A., Finzi, A. C.,
Lavine, M., Matamala, R., Mohan, J. E., Hendrey, G. R., and Schlesinger, W. H.: Net primary production of a forest ecosystem with experimental CO2 enrichment, Nature, 284, 1177–
15
1179, 1999.
Domenach, A. M., Kurdali, F., and Bardin, R.: Estimation of symbiotic dinitrogen fixation in alder forest by the method based on natural15N abundance, Plant Soil, 118, 51–59, 1989. Finzi, A. C., Norby, R. J., Calfapietra, C., Gallet-Budynek, A., Gielen, B., Holmes, W. E.,
Hoos-beek, M. R., Iversen, C. M., Jackson, R. B., Kubiske, M. E., Ledford, J., Liberloo, M.,
20
Oren, R., Polle, A., Pritchard, S., Zak, D. R., Schlesinger, W. H., and Ceulemans, R.: In-creases in nitrogen uptake rather than nitrogen-use efficiency support higher rates of tem-perate forest productivity under elevated CO2, P. Nat. Acad. Sci. USA, 104, 14014–14019, http://www.pnas.org/cgi/doi/10.1073/pnas.0706518104, 2007.
Gielen, B., Calfapietra, C., Lukac, M., Wittig, V. E., De Angelis, P., Janssens, I. A.,
25
Moscatelli, M. C., Grego, S., Cotrufo, M. F., Godbold, D. L., Hoosbeek, M. R., Long, S. P., Miglietta, F., Polle, A., Bernacchi, C. J., Davey, P. A., Ceulemans, R., and Scarascia-Mugnozza, G. E.: Net carbon storage in a poplar plantation (POPFACE) after three years of free-air CO2enrichment, Tree Physiol., 25, 1399–1408, 2005.
Hamilton, J. G., DeLucia, E. H., George, K., Naidu, S. L., Finzi, A. C., and Schlesinger, W. H.:
30
Forest carbon balance under elevated CO2, Oecologia, 131, 250–260, 2002.
BGD
7, 4153–4180, 2010FACE did not affect N2-fixation and soil C
dynamics
M. R. Hoosbeek et al.
Title Page
Abstract Introduction
Conclusions References
Tables Figures
◭ ◮
◭ ◮
Back Close
Full Screen / Esc
Printer-friendly Version
Interactive Discussion
Discussion
P
a
per
|
Dis
cussion
P
a
per
|
Discussion
P
a
per
|
Discussio
n
P
a
per
|
doi:10.1111/j.1365-2486.2006.01258.x, 2006.
Hoosbeek, M. R., Lukac, M., Van Dam, D., Godbold, D. L., Velthorst, E. J., Biondi, F. A., Peressotti, A., Cotrufo, M. F., De Angelis, P., and Scarascia-Mugnozza, G.: More new carbon in the mineral soil of a poplar plantation under Free Air Carbon Enrichment (POPFACE): Cause of increased priming effect?, Global Biogeochem. Cy., 18, GB1040,
5
doi:1010.1029/2003GB002127, 2004.
Hoosbeek, M. R. and Scarascia-Mugnozza, G. E.: Increased litter build up and soil organic mat-ter stabilization in a poplar plantation afmat-ter 6 years of atmospheric CO2enrichment (FACE): Final results of POP-EuroFACE compared to other forest FACE experiments, Ecosystems, 12, 220–239, doi:10.1007/s10021-008-9219-z, 2009.
10
Houghton, R. A.: The contemporary carbon cycle, in: Biogeochemistry, edited by: Schlesinger, W. H., Elsevier, Amsterdam, 473–513, 2003.
Janssens, I. A., Freibauer, A., Ciais, P., Smith, P., Nabuurs, G. J., Folberth, G., Schla-madinger, B., Hutjes, R. W. A., Ceulemans, R., Schulze, E.-D., Valentini, R., and Dol-man, A. J.: Europe’s terrestrial biosphere absorbs 7 to 12% of Europen anthropogenic CO2
15
emissions, Science, 300, 1538–1542, 2003.
Jastrow, J. D., Miller, R. M., Matamala, R., Norby, R. J., Boutton, T. W., Rice, C. W., and Owensby, C. E.: Elevated atmospheric carbon dioxide increases soil carbon, Glob. Change Biol., 11, 2057–2064, doi:10.1111/j.1365-2486.2005.01077.x, 2005.
Karnosky, D. F., Zak, D. R., Pregitzer, K. S., Awmack, C. S., Bockheim, J. G., Dickson, R. E.,
20
Hendrey, G. R., Host, G. E., King, J. S., Kopper, B. J., Kruger, E. L., Kubiske, M. E., Lin-droth, R. L., Mattson, W. J., McDonald, E. P., Noormets, A., Oksanen, E., Parsons, W. F. J., Percy, K. E., Podila, G. K., Riemenschneider, D. E., Sharma, P., Thakur, R., S ˆober, A., S ˆober, J., Jones, W. S., Anttonen, S., Vapaavuori, E., Mankovska, B., Heilman, W., and Isebrands, J. G.: Troposheric O3 moderates responses of temperate hardwood forests to
25
elevated CO2: a synthesis of molecular to ecosystem results from the Aspen FACE project, Funct. Ecol., 17, 289–304, 2003.
Krull, E. S., Baldock, J. A., and Skjemstad, J. O.: Importance of mechanisms and processes of the stabilisation of soil organic matter for modelling carbon turnover, Funct. Plant Biol., 30, 207–222, 2003.
30
BGD
7, 4153–4180, 2010FACE did not affect N2-fixation and soil C
dynamics
M. R. Hoosbeek et al.
Title Page
Abstract Introduction
Conclusions References
Tables Figures
◭ ◮
◭ ◮
Back Close
Full Screen / Esc
Printer-friendly Version
Interactive Discussion
Discussion
P
a
per
|
Dis
cussion
P
a
per
|
Discussion
P
a
per
|
Discussio
n
P
a
per
|
Liberloo, M., Lukac, M., Calfapietra, C., Hoosbeek, M. R., Gielen, B., Miglietta, F., Scarascia-Mugnozza, G. E., and Ceulemans, R.: Coppicing shifts CO2stimulation of poplar productivity to above-ground pools: a synthesis of leaf to stand level results from the POP/EUROFACE experiment, New Phytologist, 182, 331–346, doi:10.1111/j.1469-8137.2008.02754.x, 2009. Lichter, J., Barron, S. H., Bevacqua, C. E., Finzi, A. C., Irving, K. F., Stemmler, E. A., and
5
Schlesinger, W. H.: Soil carbon sequestration and turnover in a pine forest after six years of atmospheric CO2enrichment, Ecology, 86, 1835–1847, 2005.
Lichter, J., Billings, S. A., Ziegler, S. E., Gaindh, D., Ryals, R., Finzi, A. C., Jackson, R. B., Stemmler, E. A., and Schlesinger, W. H.: Soil carbon sequestration in a pine for-est after 9 years of atmospheric CO2 enrichment, Glob. Change Biol., 14, 2910–2922,
10
doi:10.1111/j.1365-2486.2008.01701.x, 2008.
McMahon, S. M., Parker, G. G., and Miller, D. R.: Evidence for a recent increase in forest growth, P. Natl. Acad. Sci. USA, 107, 3611–3615, 2010.
Miglietta, F., Peressotti, A., Vaccari, F. P., Zaldei, A., De Angelis, P., and Scarascia-Mugnozza, G.: Free-air CO2enrichment (FACE) of a poplar plantation: the POPFACE
fumi-15
gation system, New Phytol., 150, 465–476, 2001.
Norby, R. J.: Nodulation and nitrogenase activity in nitrogen-fixing woody plants stimulated by CO2enrichment of the atmosphere, Physiol. Plantarum, 71, 77–82, 1987.
Norby, R. J., Hanson, P. J., O’Neill, E. G., Tschaplinski, T. J., Weltzin, J. F., Hansen, R. A., Cheng, W., Wullschleger, S. D., Gunderson, C. A., Edwards, N. T., and Johnson, D. W.:
20
Net primary productivity of a CO2-enriched deciduous forest and the implications for carbon storage, Ecol. Appl., 12, 1261–1266, 2002.
Norby, R. J., DeLucia, E. H., Gielen, B., Calfapietra, C., Giardina, C. P., King, J. S., Ledford, J., McCarthy, H. R., Moore, D. J. P., Ceulemans, R., De Angelis, P., Finzi, A. C., Karnosky, D. F., Kubiske, M. E., Lukac, M., Pregitzer, K. S., Scarascia-Mugnozza, G., Schlesinger, W. H., and
25
Oren, R.: Forest response to elevated CO2 is conserved across a broad range of productivity, P. Natl. Acad. Sci. USA, 102, 18052–18056, 2005.
Norby, R. J., Wullschleger, S. D., Hanson, P. J., Gunderson, C. A., Tschaplinski, T. J., and Jastrow, J. D.: CO2Enrichment of a deciduous forest: The Oak Ridge FACE Experiment, in: Managed Ecosystems and CO2, edited by: N ¨osberger, J., Long, S. P., Norby, R. J., Stitt, M.,
30
Hendrey, G. R., and Blum, H., Ecological Studies, Springer-Verlag, Berlin Heidelberg, 2006. Oades, J. M.: The role of biology in the formation, stabilization and degradation of soil structure,
BGD
7, 4153–4180, 2010FACE did not affect N2-fixation and soil C
dynamics
M. R. Hoosbeek et al.
Title Page
Abstract Introduction
Conclusions References
Tables Figures
◭ ◮
◭ ◮
Back Close
Full Screen / Esc
Printer-friendly Version
Interactive Discussion
Discussion
P
a
per
|
Dis
cussion
P
a
per
|
Discussion
P
a
per
|
Discussio
n
P
a
per
|
Scarascia-Mugnozza, G. E., Calfapietra, C., Ceulemans, R., Gielen, B., Cotrufo, M. F., De An-gelis, P., Godbold, D. L., Hoosbeek, M. R., Kull, O., Lukac, M., Marek, M., Miglietta, F., A., P., Raines, C., Sabatti, M., Anselmi, N., and Taylor, G.: Responses to elevated [CO2] of a short rotation, multispecies poplar plantation: the POPFACE/EUROFACE experiment, in: Man-aged Ecosystems and CO2, edited by: N ¨osberger, J., Long, S. P., Norby, R. J., Stitt, M.,
5
Hendrey, G. R., and Blum, H., Ecological Studies, Springer Verlag, Berlin, Heidelberg, New York, 173–195, 2006.
Schlesinger, W. H., Bernhardt, E. S., DeLucia, E. H., Ellsworth, D. S., Finzi, A. C., Hen-drey, G. R., Hofmockel, K. S., Lichter, J., Matamala, R., Moore, D., Oren, R., Pippen, J. S., and Thomas, R. B.: The Duke Forest FACE experiment: CO2 enrichment of a loblolly pine
10
forest, in: Managed Ecosystems and CO2, edited by: N ¨osberger, J., Long, S. P., Norby, R. J., Stitt, M., Hendrey, G. R., and Blum, H., Ecological Studies, Springer-Verlag, Berlin, Heidel-berg, 2006.
Six, J., Callewaert, P., Lenders, S., De Gryze, S., Morris, S. J., Gregorich, E. G., Paul, E. A., and Paustian, K.: Measuring and understanding carbon storage in afforested soils by physical
15
fractionation, Soil Sci. Soc. A. J., 66, 1981–1987, 2002.
Soil Survey Division Staff: Soil Survey Manual, USDA Handbook No. 18, United States De-partment of Agriculture, Washington, DC, 1993.
Sollins, P., Swanston, C., Kleber, M., Filley, T., Kramer, M., Crow, S., Caldwell, B. A., Lajtha, K., and Bowden, R.: Organic C and N stabilization in a forest soil: Evidence from sequential
20
density fractionation, Soil Biol. Biochem., 38, 3313–3324, 2006.
Teklehaimanot, Z., Jones, M., and Sinclair, F. L.: Tree and livestock productivity in relation to tree planting configuration in a silvopastoral system in North Wales, UK, Agroforest. Syst., 56, 47–55, 2002.
Temperton, V. M., Grayston, S. J., Jackson, G., Barton, C. V. M., Millard, P., and Jarvis, P. G.:
25
Effects of elevated carbon dioxide concentration on growth and nitrogen fixation in Alnus
glutinosain a long-term field experiment, Tree Physiol., 23, 1051–1059, 2003.
Van Groenigen , K. J., Six, J., Hungate, B. A., De Graaff, M. A., Van Breemen, N., and Van Kessel, C.: Element interactions limit soil carbon storage, P. Natl. Acad. Sci. USA, 103, 6571–6574, 2006.
30
BGD
7, 4153–4180, 2010FACE did not affect N2-fixation and soil C
dynamics
M. R. Hoosbeek et al.
Title Page
Abstract Introduction
Conclusions References
Tables Figures
◭ ◮
◭ ◮
Back Close
Full Screen / Esc
Printer-friendly Version
Interactive Discussion
Discussion
P
a
per
|
Dis
cussion
P
a
per
|
Discussion
P
a
per
|
Discussio
n
P
a
per
|
Vitousek, P. M., Cassman, K. G., Cleveland, C., Crews, T., Field, C. B., Grimm, N. B., Howarth, R. W., Marino, R., Martinelli, L., Rastetter, E. B., and Sprent, J. I.: Towards an eco-logical understanding of bioeco-logical nitrogen fixation, Biogeochemistry, 57/58, 1–45, 2002. Vogel, C. S., Curtis, P. S., and Thomas, R. B.: Growth and nitrogen accretion of dinitrogen-fixing
Alnus glutinosa(L.) Gaertn. under elevated carbon dioxide, Plant Ecol., 130, 63–70, 1997.
5
BGD
7, 4153–4180, 2010FACE did not affect N2-fixation and soil C
dynamics
M. R. Hoosbeek et al.
Title Page
Abstract Introduction
Conclusions References
Tables Figures
◭ ◮
◭ ◮
Back Close
Full Screen / Esc
Printer-friendly Version
Interactive Discussion
Discussion
P
a
per
|
Dis
cussion
P
a
per
|
Discussion
P
a
per
|
Discussio
n
P
a
per
|
Table 1.Initial soil conditions at the BangorFACE experimental site.
Plot CO2 Clay Silt Sand pH (KCl) NH4(g N m−2) NO3(g N m−2) Ctotal(g C m−2) Ntotal(g N m−2)
BGD
7, 4153–4180, 2010FACE did not affect N2-fixation and soil C
dynamics
M. R. Hoosbeek et al.
Title Page
Abstract Introduction
Conclusions References
Tables Figures
◭ ◮
◭ ◮
Back Close
Full Screen / Esc
Printer-friendly Version
Interactive Discussion
Discussion
P
a
per
|
Dis
cussion
P
a
per
|
Discussion
P
a
per
|
Discussio
n
P
a
per
|
Table 2. N concentration andδ15N ofAlnus andBetulaleaves and the fraction of N inAlnus taken up through N2-fixation (fn).
CO2treatment Species µg N g−1
dw δ15N fn
mean s.e. mean s.e. mean s.e.
Ambient CO2 Alnus 71.36 2.34 −0.74 0.16 0.61 0.02
Betula 64.05 1.84 2.60 0.10
FACE Alnus 60.48 3.41 −0.53 0.13 0.60 0.02
BGD
7, 4153–4180, 2010FACE did not affect N2-fixation and soil C
dynamics
M. R. Hoosbeek et al.
Title Page
Abstract Introduction
Conclusions References
Tables Figures
◭ ◮
◭ ◮
Back Close
Full Screen / Esc
Printer-friendly Version
Interactive Discussion
Discussion
P
a
per
|
Dis
cussion
P
a
per
|
Discussion
P
a
per
|
Discussio
n
P
a
per
|
Table 3.C and N contents of isolated soil fractions.
Soil C fraction CO2treatment Species g C m−2 g N m−2
mean s.e. mean s.e.
Coarse POM Ambient CO2 Alnus 788 173 64 15
>250 µm Betula 740 124 47 10
Fagus 727 122 45 11
Mix 673 93 47 7
FACE Alnus 993 196 64 29
Betula 941 42 64 13
Fagus 761 120 48 4
Mix 812 135 41 3
Fine POM Ambient CO2 Alnus 158 38 13 5
53–250 µm Betula 131 16 11 2
Fagus 138 21 12 2
Mix 149 31 10 2
FACE Alnus 168 19 13 3
Betula 224 43 17 3
Fagus 158 12 14 1
Mix 223 46 18 3
Micro-aggregate Ambient CO2 Alnus 504 59 32 6
protected POM Betula 610 26 43 5
53–250 µm Fagus 536 54 47 7
Mix 536 61 38 4
FACE Alnus 428 54 27 8
Betula 485 102 44 17
Fagus 439 42 30 6
BGD
7, 4153–4180, 2010FACE did not affect N2-fixation and soil C
dynamics
M. R. Hoosbeek et al.
Title Page
Abstract Introduction
Conclusions References
Tables Figures
◭ ◮
◭ ◮
Back Close
Full Screen / Esc
Printer-friendly Version
Interactive Discussion
Discussion
P
a
per
|
Dis
cussion
P
a
per
|
Discussion
P
a
per
|
Discussio
n
P
a
per
|
Table 4.Additional C sinks in the forest floor–soil systems and major vegetation and soil char-acteristics of selected forest FACE experiments (Scarascia-Mugnozza et al., 2006; Schlesinger et al., 2006; Norby et al., 2005, 2006; Finzi et al., 2007; Hoosbeek and Scarascia-Mugnozza, 2009; Lichter et al., 2008).
Duke Forest Oak Ridge POP-EuroFACE BangorFACE
Type of vegetation Coniferous Deciduous Deciduous Deciduous
NPP (g DM m−2
y−1
) 1400–1800 2100–2600 3100–3800 1112–1225
(ambient CO2– FACE)
Forest floor FACE C sink 52∗(yrs 1–6) 32∗
(g C m−2
y−1
) 30 (yrs 1–9)
Mineral soil FACE C sink 27 (0–15 cm) 44∗(0–5 cm) 1 (0–10 cm; yrs 1–6) 6 (0–10 cm)
(g C m−2
y−1
; soil depth) 28 (0–15 cm) 54 (0–10 cm; yrs 4–6)
Soil classification (USDA) Ustic Hapludalf Aquic Hapludult Pachic Xerumbrept Fluventic Dystrochrept
Soil texture Clay loam Silty clay loam Loam and silt loam Sandy loam
Relative soil fertility Low Intermediate High High
Soil pH 5.75 5.5–6.0 4.8–5.0 4.1–5.1
Base saturation Low High Low High
Vertical mixing – bioturbation No Yes Negligible Yes
Mechanism to sustain NPP Increased N uptake Increased N uptake Increased N-use Increased N-use
under FACE from the soil from the soil efficiency efficiency
BGD
7, 4153–4180, 2010FACE did not affect N2-fixation and soil C
dynamics
M. R. Hoosbeek et al.
Title Page
Abstract Introduction
Conclusions References
Tables Figures
◭ ◮
◭ ◮
Back Close
Full Screen / Esc
Printer-friendly Version
Interactive Discussion
Discussion
P
a
per
|
Dis
cussion
P
a
per
|
Discussion
P
a
per
|
Discussio
n
P
a
per
|
a
2500 2700 2900 3100 3300 3500
2004 2005 2006 2007 2008
T
o
ta
l
s
o
il
C
(
g
/m
2
)
Amb CO2 FACE
b
200 250 300 350
2004 2005 2006 2007 2008
T
o
ta
l
s
o
il
N
(
g
/m
2
)
Amb CO2 FACE
c
9,0 10,0 11,0 12,0
2004 2005 2006 2007 2008
S
o
il
C
/N
r
a
ti
o
Amb CO2 - Alnus Amb CO2 - Betula FACE - Alnus FACE - Betula
BGD
7, 4153–4180, 2010FACE did not affect N2-fixation and soil C
dynamics
M. R. Hoosbeek et al.
Title Page
Abstract Introduction
Conclusions References
Tables Figures
◭ ◮
◭ ◮
Back Close
Full Screen / Esc
Printer-friendly Version
Interactive Discussion
Discussion
P
a
per
|
Dis
cussion
P
a
per
|
Discussion
P
a
per
|
Discussio
n
P
a
per
|
a
0,00 0,10 0,20 0,30 0,40 0,50
2004 2005 2006 2007 2008
N
H
4
(
g
N
/
m
2 )
Amb CO2 FACE
b
0,0 2,0 4,0 6,0 8,0 10,0
2004 2005 2006 2007 2008
N
O
3
(
g
N
/
m
2 )
Amb CO2 FACE
BGD
7, 4153–4180, 2010FACE did not affect N2-fixation and soil C
dynamics
M. R. Hoosbeek et al.
Title Page
Abstract Introduction
Conclusions References
Tables Figures
◭ ◮
◭ ◮
Back Close
Full Screen / Esc
Printer-friendly Version
Interactive Discussion
Discussion
P
a
per
|
Dis
cussion
P
a
per
|
Discussion
P
a
per
|
Discussio
n
P
a
per
|
a
-28.50 -28.30 -28.10 -27.90 -27.70 -27.50 -27.30 -27.10
2004 2007
d
1
3
C
(
P
D
B
)
Amb CO2 FACE
b
Alnus Betula Fagus
0 100 200 300 400 500 600 700 800
N
e
w
s
o
il
C
(
g
C
/m
2
)
2
0
0
4
2
0
0
7