Experimental Evidene for a Light and
Broad Salar Resonane in D
+
!
+
+
Deay
Jussara M. de Miranda
for the
FermilabE791 Collaboration
CentroBrasileirodePesquisas Fsias,RiodeJaneiro
E-mail: jussaralafex.bpf.br
Reeived7January,2000
From asampleof 124051D +
!
+
+
wend (D +
!
+
+
)= (D +
!K +
+
) =
0:03290:0015 +0:0016
0:0026
. UsingaoherentamplitudeanalysistottheDalitzplotofthisdeay,we
ndstrongevidenethata salarresonane ofmass 483 +26
25
17MeV/ 2
andwidth338 +45
42 21
MeV/ 2
produesadeayfration ofapproximatelyonehalf.
I Introdution
Thelightestsalarandisosalarresonane,preditedin
modelsforspontaneousbreakingwithhiralsymmetry
suhastheNambu-Jona-Lazinolinearmodel[1℄and
itsQCDextension[2℄,remainwithoutanunambiguous
experimentalobservationtothisday. Experimentshave
presentedontroversialevidene forlow-mass
reso-nanes in partial wave analyses [3, 4, 5℄.
Determin-ing the existene and harateristis of suh partiles
haveimportant onsequenesfor the quarkmodel [6℄,
forunderstandinglowenergy interations[7,8℄and
forunderstandingtheI=1=2rule[9℄.
Three-body deays of mesons ontaining heavy
quarks often proeed as quasi-two body deays with
resonant intermediate states. The large oupling to
salar resonanes is the other frequent feature that
makes harm deays a relatively lean laboratory for
the study of salarresonanes. The large deay
fra-tionsofD
s !f
0
(980),andD
s !f
0
(1370)aregood
examples,togethertheyaountforalmost90%ofthe
totalD
s
!
+
+
width[10℄.
We present the study of the single Cabibbo
sup-pressed deay D +
!
+
+
. The amplitude
analysis of the deay determine its resonane
stru-ture. We measure deay frations to the established
resonanes[11℄: 0
(770), f
0
(980), f
2
(1270), f
0 (1370),
and 0
(1450). We nd that inluding an amplitude
foralightbroadsalarresonaneimprovesourt
sub-stantially. We measure the mass and width of suh
resonanetobe483 +26
25
17 MeV/ 2
and 338 +45
42 21
MeV/ 2
. Referringtothis +
resonaneas
the(500), wend thatD +
!(500) +
aounts
foralmosthalf ofthetotaldeayrate.
II The data sample
Thedatawereproduedby500GeV/ interations
invethinfoils(oneplatinum,fourdiamond)separated
bygapsof1.34to1.39m. Thedetetor,thedataset,
thereonstrution,andtheresultingvertexresolutions
havebeendesribed previously[12℄. After
reonstru-tion,eventswithevideneofwell-separatedprodution
(primary)anddeay(seondary)vertieswereretained
forfurtheranalysis. Fromthe3-prongseondaryvertex
andidates,weseleta +
+
samplewithinvariant
massrangingfrom1.7to2.1GeV/ 2
. Allharged
par-tilesareassumedto bepions.
Werequireaandidate'sseondaryvertexposition
to be leanly separated from the event'sprimary
ver-tex position andfrom thelosesttargetmaterial. The
sumofthemomentumvetorsofthethreetraksfrom
thisseondaryvertexmustpointtotheprimaryvertex.
Theandidate'sdaughtertraksmustpasslosertothe
seondaryvertexthantotheprimaryvertex,andmust
not point bak to the primary vertex. The resulting
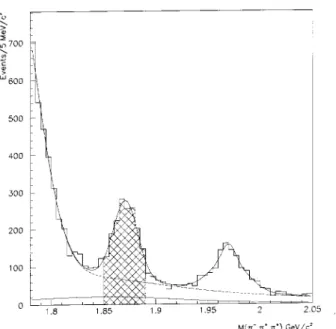
invariantmassspetrumisshownin Fig. 1.
WetthespetrumofFig. 1asthesumofD +
and
D +
s
signalsplusbakground. Toaountforthesignals'
non-Gaussiantails,wemodeleahsignalasthesumof
twoGaussiandistributionswiththesameentroid. We
model thebakgroundasthesumof fouromponents:
a general ombinatorial bakground, the reetion of
theD +
!K +
+
deay,reetionsof D 0
!K +
plus one extra trak, and D +
!
0
+
0
! 0
(770), 0
(770)! +
. TheD +
!K +
+
reetionisloatedbelow1.82GeV/ 2
inthe +
+
spetrum. Theotherharmbakgroundspopulate the
whole +
+
spetrum. Weuse MC simulationsto
determine the shape of eah identied harm
bak-ground in the +
+
spetrum. We assume that
the ombinatorial bakgroundfalls exponentially with
mass. The level of D 0
! K and D +
s
!
0
+
bakgroundsare determined using harm signal rates
measured in ourtotaleventsample andbranhing
ra-tios taken from the ompilation by the Partile Data
Group[11℄. Theparametersdesribing the
ombinato-rialbakgroundandtheleveloftheK +
+
reetion
are determined from ttingthe +
+
distribution.
Themass(entroid)andbothGaussianwidthsforeah
signaloatinourt. Thetnds124051D +
events
and85849D +
s
events.
Figure1. The +
+
eetivemassspetrum. Eventsin
thehathedareaareusedfortheDalitzplotanalysis.
TostudytheresonantstrutureofthedeayD +
!
+
+
, weonsiderthe1686andidateswith
invari-ant mass between1.85 and 1.89 GeV. Theintegrated
signal-to-bakgroundratio in this range is about 2:1.
Fig. 2showstheDalitzplotfortheseevents. The
hori-zontalandvertialaxesarethesquaresofthe +
in-variantmasses,andtheplothasbeensymmetrizedwith
respettothetwo +
's. Weseethelearbands
orre-spondingtothe 0
(770) +
,withavalleyintheentral
region,signatureofthedeayoftheDintoavetor
res-onaneanda. Alsolearisthebandatributedtothe
f
0 (980)
+
hannel. Weobserveas wellalarge
onen-trationofeventsinthelowmassregion. SeeFig. 3for
simulationsoftheindividualresonaneontributionsto
Weassumethattheombinatorialbakground
pro-duesnopartiular struture in theDalitzplot, apart
from the shape imposed by the detetor aeptane.
This soure is responsible for 729% of the overall
Dalitz-plot bakgound On the other hand, the harm
bakgounddoesproduespeistrutures. Theshape,
size and loation of the harm bakgound were
ob-tained using Monte Carlo simulations and previously
determined D 0
and D
s
prodution rates relative do
D +
in our data sample. The D 0
! K
+
,
repre-sents only 41% of the bakground and is loated in
thesymmetriornersoftheDalitzPlot. Weassoiate
theremaining249%bakgroundto theD +
s !
0
+
,
0
! 0
(770), 0
(770)! +
thatfalls,obviuously,
intheregion,itisjust distortedduetothe
kinemat-ial ut on the 3 invariant mass. This bakground
diersfromthesignaldeayto inthesense that it
doesnotpresentthevaleyin theentral region,result
ofangularmomentumonservation.
Figure2. D +
!
+
+
Dalitz plotdistribution. Sine
we have two identialpartiles this distribution was
sym-metrized.
III The amplitude formalism
The deay of a salar hadron into 3 spinless
daugh-terpartilesisompletelyspeiedwithtwodegreesof
freedom. Theonvenienthoie of observable are the
squared invariant mass of two two-body ombination
amongthedaughterpartiles. Thishoieismotivated
d = 1 (2) 3 1 32M 3 jAj 2 dm 2 12 dm 2 13 ; (1)
M is the three-body invariant mass and m 2
ij is the
squaredinvariantmassofdaughtersi andj.
The invariant amplitude Aholds all the dynamis
ofthedeay. Them 2
12 m
2
13
satterplot,the
Dalitz-Plot,isadisplayofthisdynamis. Thenextstepisto
omposeamodelforAandinvestigatehowitompares
tothedata.
Thedeaythroughresonantintermediatestates,j,
areviewedass-hannelproesseswhere theresonane
plays the role of massive propagators, represented by
relativisti Breit-Wigner funtions, BW
j 1
.
Momen-tum dependent form fators, F
D and F
R
desribethe
non-pointlikenatureoftheDmesonandtheresonane
respetively. The angular momentum onservation is
takenarebythefuntion M J
j
. Eahresonant
ampli-tude,A
j
iswritenas:
A j =BW j F D F R M J j ; (2) BW j = 1 m 2 m 2 0 +im 0 j (m ) ; (3) with (m )= 0 m 0 m p p 0 2J+1 F 2 R (p ) F 2 R (p 0 ) : (4) Above m
is the invariant mass of the two pions
forming a spin-J resonane. The funtions F
R are
the Blatt-Weisskopf dampingfators [14℄ that depend
on the spin of the resonane: F
0
= 1 for spin 0
partiles, F
1 = 1=
p
1+(rp
) 2
for spin 1 and F
2 =
1= p
9+3(rp ) 2 +(rp ) 4
for spin 2. The parameter
r is the radius of the resonane ( 3 fm) [14℄ and
p
= p
(m) the momentum of deay partiles at
mass m, measured in the resonane rest frame. The
spin part of the amplitude M
j
is dened equal to 1
for a spin-0 resonane, 2jp
3 jjp
1
jos for
spin-1 and 4 3 (jp 3 jjp 1 j) 2 (3os 2
1), where p
3 is the
3-momentum of the bahelor pion and p
1
is the
3-momentumoftheotherlikehargepion,bothmeasured
intheresonanerestframe;andistheanglebetween
pions1and3. Finally,eahresonantamplitudeisBose
symmeterizedA
i =A
i
[(12)3℄+A
i [(13)2℄
Thenon-resonantamplitudeisrepresentedbya
on-stant. The overall amplitude is written asa oherent
sumofalltheontributions:
A= 0 A 0 + n X j=1 j A j ; (5) where j =a j e iÆj
are omplexoeÆients,they
repre-senttherelativeontributionsofeahdeaymodeand
as well asnal state hadroniinterations. These
o-eÆients are the unknowns that should be extrated
from ts to thedata. Fig. 3weshowthe Dalitz-plot
ofeahindividualresonantstatethat ouldontribute
fortheabovesumintheD + ! + + deay. Notie
that being oeÆients and the individual amplitudes
omplex quantities, interfereneeets will takeplae
whenallthepieesattogether.
Figure 3. Dalitz-plot of the individual resonant
ontribu-tionstotheD + ! + + deay.
Toobtain theparameters a
j and Æ
j
we doa
max-imum likelihoodL t to thedata using MINUIT[15℄.
Inpratietheprogramndsparametersthatminimize
the quantity w = 2ln(L). We ompute the
likeli-hood, L, in termsof signal,P
S
, and bakground, P
B ;
probabilityfuntions(PDF's)ofthe +
+
invariant
mass, M, and the Lorentz invariants s
12 m 2 12 and s 13 m 2 13 : L= 1686 Y j=1 [P S +P B ℄ j ; (6) 1
Forthef
0 (980)
+
weuseaoupledhannelBreit-Wigner,followingtheparameterizationoftheWA76Collaboration[13℄,
P S = 1 N S g(M)"(s 12 ;s 13 )jAj
2
: (7)
Inthis equation N
S
is the normalizationonstant,
"(s
1 ;s
2
) is the aeptane fator, g(M) is a gaussian
funtion desribing the signal's +
+
observed
in-variant mass spetrum. A is the general amplitude
givenby equation 5,funtion of thet parametersa
j
and Æ
j
. With the exeption of the , the masses and
widths of all the resonanes were xed for all ts
re-ported here. Intable 1welist massand width values
used.
Table1. Massesand widths ofthe resonanesused in
the Dalitz plot t. Values for f
0
(980) and f
0 (1370)
ame from the Dalitz-plot analysis of the D
s ! + +
signalshowninFig. 1,alltheothersarelisted
[11℄.
resonane mass(GeV) width soure
f
0
(980) 0.978 g
=0.083 t
g
K
=-0.03
0
(770) 0.769 0.150 PDG
f
2
(1270) 1.275 0.185 PDG
f
0
(1370) 1.438 0.170 t
0
(1450) 1.465 0.310 PDG
Thebakgrounddistributionisgivenby
P B =b(M) 3 X i=1 b i N B i B i (s 12 ;s 13 ); (8)
b(M)isthefuntion desribingthebakground
distri-bution in the +
+
spetrum, b
i
are the relative
amountofeahbakgroundtypeandN
B
i
arethe
orre-spondingnormalizationonstants. B
i
arethe
probabil-itydistributions in theDalitz-plot ofeah bakground
type, they are displayed in Fig. 4. There are no free
parametersinthebakgrounddesriptionalthough we
vary b
i
to estimate the systemati unertainty in the
measured parameters. Fig. 4a is aplot of P
B and in
4bweplotthedetetoraeptane.
Figure4. a)Bakgrounddistributionb)Detetor
aeptane.
IV Results
Wehavetriedmanydierentmodelsforthesignal
am-plitude, partiularly in its respet to the (500)
reso-nane.Inourrstmodel,whihwewillrefertoasFit1
thesignalPDF inludesanon-resonantamplitudeand
amplitudes for D +
deaying to a +
and any of the
ve well-stablished resonanes [11℄: 0 (770), f 0 (980), f 2 (1270),f 0 (1370),and 0
(1450). Thetextrats
mag-nitudesandphasesofeahoftheamplitudesalongwith
theerrormatrixforthoseparameters. Wealulatethe
deayfrationsforeahamplitudeas:
f j R ds 12 ds 13 j j A j j 2 R ds 12 ds 13 P jk j j A j k A k j 2 : (9)
The integration runs overthe entire Dalitz-Plot.
No-tiethat due to interfereneeets thefrations ofall
modesdonotneessarilyaddsupto one. For this
rea-sonweare notableto measure exatlythe
intermedi-ate state branhing ratios. The Fit 1 results are
ol-leted in table 1. This t found the minimim value
w = 2ln(L) = 5138. In this model, the
non-resonant and the 0
(1450) +
apear to dominate,
fol-lowed by the 0
(770) +
amplitude. The qualitative
featuresofthistaresimilartothosereportedbyE691
[16℄andE687[17℄.
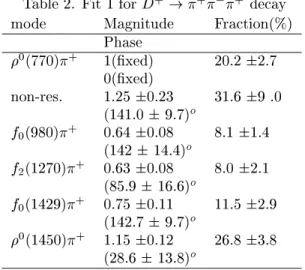
Table2. Fit1forD + ! + + deay
mode Magnitude Fration(%)
Phase
0
(770) +
1(xed) 20.22.7
0(xed)
non-res. 1.250.23 31.69.0
(141.09.7) o
f
0 (980)
+
0.640.08 8.1 1.4
(14214.4) o
f
2
(1270) +
0.630.08 8.0 2.1
(85.916.6) o
f
0
(1429) +
0.750.11 11.52.9
(142.79.7) o
0
(1450) +
1.150.12 26.83.8
(28.613.8) o
Toaessthequalityof eaht wedevelopedafast
Monte Carlo (MC) program whih produes
Dalitz-Plot event densities aounting for signal and
bak-gound PDF's, inluding detetor eÆieny and
gen-given in Fit 1 with that for the data, we produde a
2
distribution shown in Fig. 5. We observe bad 2
bins spread thoughtout the Dalitz-Plot with
partiu-larly bad bins in the low mass region. The 2
summed overall bins is 243.0 for 162 degreesof
free-dom, giving 2
=DOF =1:50. FFig. 5b displaysthe
+
square mass projetion for data and fast MC.
While the peaks orresponding to the 0
(770) +
and
thef
0 (980)
+
arewellrepresentedbythemodel,there
is a disrepany at the lower mass suggesting, along
with the relatively poor 2
, the possibility of another
resonantamplitude.
Figure5. Fit1:a) 2
distributionb)s12ands13projetions
for data(errorbars),fastMC(solid) andthe shadedarea
isthebakgouhddistribution.
Toinvestigatethepossibilitythatanotherresonane
ontributestotheD +
!
+
+
deay,weadda
sev-enthamplitudeto thesignalPDF. Weallowthemass
and the width to oat and asusume a salar angular
distribution. This t (Fit 2) nds values of 483 +26
25
MeV/ 2
and338 +45
42
MeV/ 2
respetivelyformassand
widthof thissixthresonantstate,thatwearerefering
toas(500). Theotherparametesofthetarelistedin
table3. WeobtainedforFit2,w= 2ln(L)= 5248
InFit2,the(500)amplitudeproduesthelargest
deay fration , 44%, with a relatively small
statisti-al error, 9%. The non-resonant fration, whih at
(3210)%wasthelargestinFit1,isnowonly(107)%.
Therstreportederrorsarestatistialfollowedbythe
systemati. Thepossiblesoures of systemati
uner-taintiesarethebakgroundmodel,thedetetor
aep-taneandthe(500)massandwidth. Wealso
investi-gatetheimpatofhavingpointlikehadrons,negleting
theformfatorsinthemodel.
Fig. 6ashowsthedistributionofthe 2
ofthedata
ifomparedwithafastMCsamplegeneratedwiththe
parametersout ofFit 2. Whenweprojetthis model
ontotheDalitzplot, 2
=DOF beomes149/162. Along
withthesigniativeimprovementintheglobal 2
we
note also thelak ofprefered badspots in the 2
dis-tribution. Inthe +
squaredmassprojetions,Fig.
6b, we see learly that this model desribes the data
well, inludingthe thelowmass regionwith the peak
at0.2GeV 2
= 4
.
Figure6.Fit2:a) 2
distributionb)s
12 ands
13
projetions
for data(errorbars),fastMC(solid) and theshadedarea
isthebakgouhddistribution.
We used hundreds of fast MC samples to test the
aurayof theerrorsestimated bythetter. The
to-talnumberofsignalandbakgoundeventsoftheseMC
ensemblesvariedaordingtogaussiandistributios
en-teredinthevaluesrelativetoourdataset. Theentral
value of al parameters are reprodued aurately and
the width of the (500) fration distribution is 0.12.
Toomparetheabilityofthetwomodelsof
represent-ingthedataweusedthequantityw= 2(L
L
0 ),
whereL
isalulated,foranygiveneventsample,
alulatedusingtheparametersoftable2. Inthedata
w = 110. In Fig. 7a the hashed area is the
distri-bution of w for samples of fast MC generated with
theparametersofFit2(table3). Thesolidlineonthe
samegurewasobtainedusingfastMCsamples
gener-ated with theparametes ofFit 1. Thetriangle marks
thedatapoint. Fromthisexeiseweonludethatthe
data event distribution is ompatible with the model
thatinludesthe(500)andisnotstatistialy
ompat-ible with themodel that inludes only well-stablished
resonatmodes.
Table3. Fit2forD +
! +
+
deay.
mode Magnitude Fration(%)
Phase
+
1.210.220.06 44.39.42.1
(205.78.05.2) o
0
(770) +
1(xed) 30.53.12.2
0(xed)
non-res. 0.570.190.09 9.97.02.7
(74.517.85.7) o
f
0 (980)
+
0.460.050.02 6.61.30.4
(163.310.33.4) o
f
2 (1270)
+
0.800.060.03 18.92.50.4
(53.37.52.9) o
f
0 (1429)
+
0.300.090.03 2.51.50.8
(107.117.80.6) o
0
(1450) +
0.190.090.02 1.11.00.3
(339.227.510.9) o
It remains to be answered ifthe extrasalar
reso-nane istheonlypossibleexplanationforthedata
dis-tribution. Withtheintentionofansweringthisquestion
we tried some other models. We allowed the seventh
amplitudetobeavetor,
vetor
oratensor,
tensor
res-onaneandwetriedaswellatoyBreit-Wignerwithout
a phase,
BW2
. Thetoy model tests the phase
varia-tion expeted by a Breit-Wigner amplitude. In eah
ase we allowed the mass and width of the new
ob-jetto oat. Thevetorresonanemodelonvergesto
poorlydenedvaluesofthemassandwidth: 719182
MeV/ 2
and 1156879MeV/ 2
; the tensormodelto
more poorly dened values: 2223607 MeV/ 2
and
10961269;andthetoymodelto43112 MeV/ 2
and26935MeV/ 2
. Asatestofthemodels,weagain
projetthethevetor,tensor,andtoymodelsontothe
Dalitzplot and obtain 2
=DOF = 194/162,155/162,
and 158=162, respetively. For these models, we also
ndw =78, 16,and 31whereMC experiments
pre-dithwi61,51,and27whenthedataisgenerated
withthe salarparameters andthe negativesof those
valueswhentheMCdataisgeneratedaordingtothe
vetor,tensor,andtoymodelparameters,asshowFigs.
6b,andd. Thesestatistialtestsstronglyexludethe
vetormodel. They learlyprefer thesalarmodel to
thetensorandtoymodels. Notethattheentralvalue
forthetensormassiswellabovethresholdforD +
deay
andthenegativewidth is anindiationthat no
physi-allymeaningfultensorresonanetsthedata. Inthe
toymodel,theextraamplitudeinterferesstronglywith
alargenonresonantamplitude,leadingtoan
unphysi-allylargesumofresonantfrations.
V Conlusion
Insummary,from 124051D +
!
+
+
wehave
measured (D +
!
+
+
)= (D +
!K
+
+
). In
anamplitude analysis of a sample with S:B 2:1 we
ndstrongevidenethat asalarresonanewithmass
483 +26
25
17 MeV/ 2
and width 338 +45
42
21 MeV/ 2
produesadeayfration50%. Alternative
explana-tionsofthedatafailtodesribeitaswell. The
promi-neneofan isosalar+ +
amplitudein this deay
a-ordswellwithourobservationthatisosalar+ +
am-plitudesproduealargemajorityofallD +
s
!
+
+
deays[10℄.
Aknowledgements
We gratefully aknowledge the assistane of the
stas of Fermilab and of all the partiipating
insti-tutions. This researh was supported by the
Brazil-ianConselhoNaionaldeDesenvolvimentoCientoe
Tenologio,CONACyT(Mexio),theIsraeliAademy
of Sienes and Humanities, the U.S. Department of
Energy,theU.S.-IsraelBinationalSiene Foundation,
andtheU.S.NationalSiene Foundation. Fermilabis
operatedbytheUniversitiesResearhAssoiation,In.,
Figure 7. w = 2(L
i L
salar
). Inall plots the hashedhistograms were obtained from Fast MC samples generated
aordingtotheparametersoftable3. Thetriangles arethedatapointsandforthesolidlinehistogramsweusedfastMC
generated bythe modelwithouta resonane (a),withthe tensor (b), withthetoyBreit-Wigner withoutphase()and
withthevetor.
Referenes
[1℄ Y. Nambu and G.Jona-Lasinio, Phys. Rev.122, 345
(1961).
[2℄ R. Delburgo, M.S. Sadron, Phys. Rev.Lett 48,379
(1982).
[3℄ WA102Collaboration,D.Barberiesetal.,Phys.Lett.
B453,332(1999).
[4℄ CLEO Collaboration, D.M. Asner et al.,
hep-[5℄ GAMS Collaboration, D. Alde et al., Phys. Lett. B
397,350(1997).
[6℄ N.Tornqvist,hep-ph/9904342.Toappear inthe
Fras-atiPhysisSeriesVol.XXX(1997).
[7℄ K.Erkelene,Phys.Rep.C13,190(1974).
[8℄ M.R.Pennington,hep-ph/9905241.
[10℄ E791Collaboration,\StudyoftheD +
s
!
+
+
de-ay and measurement of f
0
masses and
widths". To appear at the proedings of DAFNE99.
http://wwwsis.lnf.infn.it/dafne99.
[11℄ Partile DataGroup,C.Caso etal.,Eur.Phys.Jour.
C3,1(1998).
[12℄ Eue. Phys. J. Diret 4, 1 (1999) and referenes
therein; J. A. Appel, Ann. Rev.Nul. Part. Si. 42,
367 (1992), D. J. Summerset al., Proeedings ofthe
XXVII th
RenontredeMoriond, Eletroweak
Intera-tions and UniedTheories, Les Ars, Frane(15 -22
Marh1992)417;S.Amatoetal.,Nul.Instr.Meth.A
324,535(1993).
[13℄ WA76 Collaboration,T.A. Armstrongetal.,Z. Phys.
C51,351(1991).
[14℄ ArgusCollaboration,AlbrehtH. etal.Phys.Lett. B
308,435(1993).
[15℄ F. James,\MINUIT, Funtion Minimization and
Er-rorAnalysis", CERNProgram Librarylong Write-up
D506(1994).
[16℄ E691Collaboration,Anjos,J.etal.Phy.Rev.Lett.62,
125(1989).
[17℄ E687Collaboration,FrabettiP.L.,etal.Phys.Lett.B