Abstract
If steel manufactures usually comply with the minimum code speci-fications, the nominal yield strength of rebar can however be signif-icantly exceeded in many countries, depending on the steel manu-facturing processes. Such an increase in yield strength can have negative effects on the flexural behavior of beams designed as ten-sion controlled, and reduce their ductility, an essential property in seismic resisting structures. An experimental and analytical study of the flexural behavior of reinforced concrete (RC) beams was conducted through the investigation of the Moment-Curvature relationships and the ultimate steel strains. The main variable was the level of the actual steel yield stress as compared to the nominal value. It was found that unexpectedly high values of steel yield stress reduce the beam ductility and violate the tension-control condition which was enforced in the design stage. Appropriate design corrections are proposed to account for high yield stress values in order to achieve the desired ductility of beams while maintaining the moment capacities.
Keywords
Reinforced concrete, beam flexure, ductility, moment curvature, yield strength
Flexural Behavior of Beams Reinforced with Steel
Bars Exceeding the Nominal Yield Strength
1 INTRODUCTION
While much attention has been given to the effect of the variability of concrete strength and prop-erties on the response of reinforced concrete structures, there is little, if any, information on the effects of variability of steel strength. This lack of interest may be explained by the assumed assur-ance that steel manufactures are always complying with minimum code specifications. However, steel mechanical properties are sometimes exceeding the minimum nominal strength values for a specific grade of steel. This happens in many countries as there are different steel producers who adopt different methods of manufacturing. The mechanical properties of steel are governed by the
Abdelhamid Charif a Shehab M. Mourad b M. Iqbal Khan c
a King Saud University,
b King Saud University,
[email protected] c King Saud University,
http://dx.doi.org/10.1590/1679-78251683
production technique, chemical compositions, mechanical working of rebar, and the method of heat treatment as described by Davis et al. (1982). Seismic standards have been developed with the aim of allowing steel to yield without rupture during an earthquake, in order to enhance seismic energy absorption of the structure and avoid collapse. For this purpose, steel bars should possess high strength with sufficient ductility and low variation in yield strength to experience large number of inelastic cycles of deformation with large plastic strains. In this regard, most international specifica-tions outline and control the mechanical properties requirements for rebar to be used in seismic resistant systems as reported by Milbourn (2010), and shown in Table 1.
Rebar Specifications Steel
Grade
Strength requirements Ratio = Actual/Nominal
Ductility requirements
fy nominal
(MPa) fy ratio fu ratio Elongation (%)
Chinese Standard GB 1449.2:2007
HRB400E 400 1.3 1.25 16
HRB500E 500 1.3 1.25 15
Australian/New Zealand Standard AS/NZS
4671:2001
300 E 300 1.27 1.15, 1.5 15
500 E 500 1.20 1.15, 1.4 10
British Standard BS 4449:2005
B500B 500 1.30 1.08 5
B500C 500 1.30 1.15, 1.35 7.5
American Standard ASTM A706 – ASTM
A615- 09b
Grade 60 420 1.29 1.25 14 : =10-19 mm
12 : =22-36 mm
Grade 80 550 1.23 1.25 12 : =10-36 mm
Table 1: Mechanical properties requirements for seismic resistant rebars.
The increase in both yield and ultimate strengths of rebars will certainly improve the member’s strength but however it may also affect adversely the member’s ductility. This is particularly im-portant for beams which are usually designed as tension controlled members, where at the ultimate state, tension steel should exceed the yield limit and reach a minimum strain of 0.005 as specified by ACI-318R-11 (2011). For such beams, steel bars will sufficiently yield before concrete reaches its compressive crushing strength allowing significant increase in deflections, and showing enough warning before failure. For such reasons, beams with a minimum tensile steel strain of 0.005 are considered to be fully ductile. An unsuspected increase in yield strength may therefore change the tension control of a beam and violate the minimum 0.005 strain condition.
effects of steel ratio and yield level on both deformability and strength of RC beams, and made appropriate recommendations in order to achieve the desired level of ductility without adversely affecting the strength by combining compression and transverse steel.
In the Middle East and Gulf Region, there are at least six producers of deformed rebars, all complying with ASTM A 615M specifications. Steel is manufactured using either tempered or quenched processes to produce bars with minimum yield strength of 420 MPa, and minimum ulti-mate strength 620 MPa. However, large differences in yield strength values are noticed among pro-ducers using different manufacturing processes, leading to substantially different mean-to-nominal yield strength ratios. There is consequently a substantial risk that a beam initially designed to fail in a ductile mode may fail in a brittle manner. It is therefore necessary to investigate the effect of the increase in rebar yield strength on beam ductility.
The objective of the present study is to investigate the effect of local manufactured steel on the flexural behavior of beams in terms of ductility and moment capacity. The investigation is per-formed experimentally and verified analytically. In addition, a parametric study is conducted to demonstrate the effect of high yield strength of rebars on the ductility and bending capacity of beams for different steel ratios and beam sections.
2 EXPERIMENTAL INVESTIGATION
2.1 Variation of Steel Strength
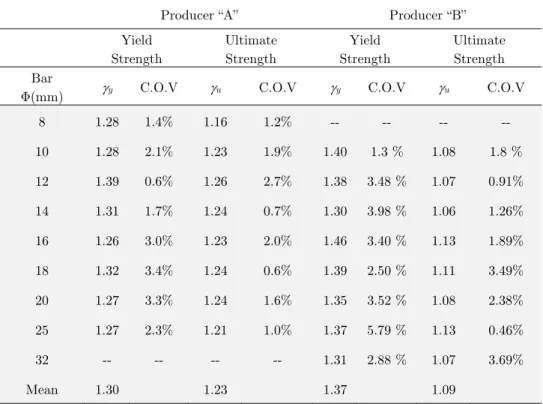
In the first part of the experimental investigation, random samples were taken from two different local steel producers “A” and “B” that are confirming to ASTM A 615M grade 60, but with unspeci-fied manufacturing processes. The nominal yield and ultimate strengths are 420 MPa and 620 MPa respectively. Three specimens were tested for each bar diameter, the yield and and ultimate strengths were recorded as well as the mean values and coefficient of variation. The ratio of mean yield strength to nominal yield value (y) and the ratio of mean ultimate strength to nominal ulti-mate value (u) were computed for each rebar diameter, and the results are shown in Table 2 for both producers “A” and “B”. In fact both yield and ultimate strengths vary considerably from small to large diameters even for the same steel producer. For producer “A”, the ratio of mean yield stress to nominal value varies from 1.26 to 1.39, while the ultimate ratio ranges is from 1.16 to 1.26. For producer “B”, the range variation is 1.30 to 1.46 in yield stress and 1.06 to 1.13 in ultimate strength.
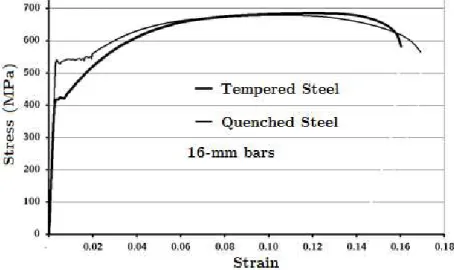
rebars manufactured by both tempering and quenching processes are shown in Figures 1a and 1b respectively. There is a significant variation in yield strength whereas the ultimate strengths are quite close. The quenched process delivered a yield stress much higher than the nominal value. In addition, the rebars develop a yield plateau until a strain less than or equal to 0.02, which is then followed by nonlinear hardening until the ultimate strength is reached at about 0.10 strain. It is anticipated that such high values of yield strength, will have a significant effect on the flexural be-havior of beams.
Producer “A” Producer “B”
Yield Strength
Ultimate Strength
Yield Strength
Ultimate Strength Bar
Φ(mm) y C.O.V u C.O.V y C.O.V u C.O.V
8 1.28 1.4% 1.16 1.2% -- -- -- --
10 1.28 2.1% 1.23 1.9% 1.40 1.3 % 1.08 1.8 %
12 1.39 0.6% 1.26 2.7% 1.38 3.48 % 1.07 0.91%
14 1.31 1.7% 1.24 0.7% 1.30 3.98 % 1.06 1.26%
16 1.26 3.0% 1.23 2.0% 1.46 3.40 % 1.13 1.89%
18 1.32 3.4% 1.24 0.6% 1.39 2.50 % 1.11 3.49%
20 1.27 3.3% 1.24 1.6% 1.35 3.52 % 1.08 2.38%
25 1.27 2.3% 1.21 1.0% 1.37 5.79 % 1.13 0.46%
32 -- -- -- -- 1.31 2.88 % 1.07 3.69%
Mean 1.30 1.23 1.37 1.09
Table 2:Variation of yield and ultimate strengths of different rebars from different local producers.
Bar Φ (mm)
Tempered steel re-bars
Quenched steel re-bars
y u y u
10 1.00 1.06 1.40 0.97
16 1.01 1.10 1.43 1.15
18 1.00 1.07 1.31 1.11
20 0.99 1.09 1.30 1.11
Figure 1a: Typical stress-strain curves for 16-mm rebars.
Figure 1b: Typical stress-strain curves for 20-mm rebars.
2.2 Flexural Behavior of Beam Specimens
steel. The flexural reinforcement was provided in two layers. One 8-mm bar was used in compres-sion side to fix the stirrups. Shear reinforcement of all beams was designed according to ACI-318R-11 in order to avoid shear failure. The effective depth corresponding to each failure steel strain was computed based on the assumption that the ultimate compressive strain in concrete is 0.003, and the nominal yield stress of both groups is 420 MPa. The computed effective depths corresponding to groups “T” and “Q” were 425.9 mm and 444.0 mm respectively.
The specimens were instrumented to provide strain measurements; two strain gauges were in-stalled on tension steel and compression steel of beam specimens at mid span. The strain gauges in the tension steel were placed in the bottom layer of the flexural reinforcement. One linear voltage differential transducer (LVDT) with 50 mm travel was used to measure mid span deflections. The load was monitored using load cells at third points. The beams were simply supported and two equal concentrated loads were applied at third point of the span, as shown in Figure 3. The load was applied by 10000 kN upgraded Amsler press with an electronic control using a 2000 kN measur-ing range option. Load was applied continuously at a displacement rate of 2 mm per minute up to failure. Load, deflections and strains were recorded using a data acquisition system.
Figure 2: Details of beam specimens.
The measured moment-curvature relationships of the four specimens are shown in Figure 4. The values of ultimate moments, curvatures and ductility are given in Table 4. It is noticed that speci-mens 0.0065 and Q-0.0065 exhibit higher curvature and ductility as compared to specispeci-mens T-0.004 and Q-T-0.004, because of their lower steel reinforcement. However, specimens made of quenched rebars; Q-0.004 and Q-0.0065, exhibit higher ultimate moments with less curvature and ductility as compared to those specimens made of tempered steel, T-0.004 and T-0.0065. Such be-havior was expected since “Q” rebars have higher yield strength resulting in reduction of the steel strain at failure.
Figure 4: Moment-curvature relationship of the tested beam specimens.
Specimen Ultimate
moment(kN.m)
Curvature at first yield
y
(mm-1)Ultimate curvature
u(mm-1)
Curvature ductility
y u
/
T-0.004 281.4 0.009795 0.02895 2.96
T-0.065 213.15 0.009600 0.08670 9.03
Q-0.004 301.1 0.009979 0.02834 2.84
Q-0.065 262.5 0.008761 0.05330 6.08
Table 4: Experimental results of beams reinforced with Tempered and Quenched steel.
3 ANALYTICAL MOMENT-CURVATURE RELATIONSHIP
dz
dy
y
dA
y
M
dz
dy
z
dA
z
M
dz
dy
dA
N
z y
(1)N is the axial force, My and Mz are bending moments about Y-axis and Z-axis respectively.
Integration of stress resultants (1) over arbitrary shaped sections may be performed numerically or analytically. There are many methods of numerical integration computing area integrals (1) such as those described by Sfakianakis (2009), Bonet et al. (2006), Batistuta et al. (2007), and Char-alampakis et al. (2008). Area integrals can be transformed to border integrals using Green’s theo-rem with appropriate numerical techniques as reported by Fafitis (2001), Zupan and Saje (2005), and Charif et al. (2014). Analytical integration is only possible with some particular models and with any polynomial form. This efficient method is used here and is described in details by Charif et al. (2014). Integral relations (1) can be expressed with respect to neutral axis coordinates (
,
), as shown in Figure 5. The normal strain depends on the coordinate
only:
0
(2)0
and
are the centroid normal strain and curvature respectively. Integrals (1) become:
d
d
M
d
d
M
d
d
N
z y)
(
sin
cos
1
)
(
cos
sin
1
)
(
1
0 0 (3)Figure 5: General section under axial force and biaxial bending (a): Inclined neutral axis in global axes
Applying Green transformations to equations (3) leads to:
A z A y Ad
M
d
M
d
N
)
(
sin
cos
2
1
)
(
cos
sin
2
1
)
(
1
0 2 0 2 (4)Integrals (4) may be determined analytically for some concrete models and in particular for all polynomials as detailed by Charif et al. (2014). A computer program implementing the previous method was developed and used to deliver the moment-curvature relationships.
4 VERIFICATION OF THE ANALYTICAL MODEL
Figure 6: Material models used in the analytical verification.
Figure 7: Experimental and theoretical moment-curvature relationships for beams with tempered rebars.
5 PARAMETRIC INVESTIGATION
It was further decided to explore the effects of some important variables on the flexural behavior of beams reinforced with rebars having high yield strength. Among those variables are; section type (drop beam or shallow beam), main tension steel ratio, and steel yield strength. Standard concrete, with 25-MPa compression strength, is again used throughout this investigation with the model shown in Figure 6.
a) Section type
Two commonly used section types were selected; 260 x 500 mm drop beam and 500 x 1200 mm shallow beam. The latter is used for architectural reasons in order to hide beams and constrain their thickness to that of the slab. With a smaller depth, the shallow beams are expected to be more expensive since they need higher amount of steel and larger area of concrete to resist the same ulti-mate moments that drop beams can resist. The two selected beam sections have the same gross section inertia but the shallow beam contains almost three times more material.
b) Steel ratio
Assuming a standard yield stress of 420 MPa and an elastic modulus of 200 GPa, the corre-sponding maximum steel ratio for tension control as derived by McGregor et al. (2008) is:
01613
.
0
85
.
0
8
3
1 'max
y c
f
f
(5)y c
f
f
,
,
' 1
are the depth factor of the equivalent rectangular concrete stress block, concrete com-pression strength, and steel yield stress.Three different steel ratios “ρ” that cover the practical range in design were used in this investi-gation. These are: 0.4ρmax , 0.6ρmax, and ρmax.
c) Yield stress
As was noted, the actual steel yield strength is generally greater than its nominal value of 420 MPa for Grade 60, and the excess may reach 60% (670 MPa) in some cases. The following percent-ages of increase in yield strength were selected in this investigation; 0% (control), 15%, 30%, 45% and 60%. The values of ultimate steel strain and end of yielding plateau strain were taken 0.1 and 0.01 respectively.
A typical steel model (control case) used in this investigation is shown in Figure 9. The descending branch recorded in the experimental curves of Figures 1a and 1b is ignored. Table 5 shows the studied values of increase in yield strength, and the corresponding values of yield and ultimate strengths. The studied beam cases are summarized and identified in Table 6 for both the drop and shallow beams.
Increase in Yield
strength 0%
15
% 30% 45% 60%
Yield stress (MPa) 420 483 546 609 672
Ultimate stress (MPa) 620 660 700 740 780
Figure 9: Typical stress-strain curve for steel used in the analytical mode.
Drop Beams ( 260x500mm) Shallow Beams
(1200x300mm)
Code No of bars Code No of bars ρ/ρmax Yield
increase DB- 0.4 – 0
1 layer 3Φ18
SB- 0.4- 0
1 layer
6Φ20 0.4
0%
DB- 0.4- 15 SB- 0.4- 15 15%
DB- 0.4- 30 SB- 0.4- 30 30%
DB- 0.4- 45 SB- 0.4- 45 45%
DB- 0.4- 60 SB- 0.4- 60 60%
DB- 0.6- 0
1 layer 3Φ22
SB- 0.6 - 0
1 layer
9Φ20 0.6
0%
DB- 0.6- 15 SB-0.6- 15 15%
DB- 0.6- 30 SB- 0.6- 30 30%
DB- 0.6- 45 SB- 0.6- 45 45%
DB- 0.6- 60 SB- 0.6- 60 60%
DB- 1.0 – 0
2 layers 3Φ20 2Φ20+Φ18
SB- 1.0- 0
1 layer
12Φ22 1.0
0%
DB- 1.0- 15 SB- 1.0- 15 15%
DB- 1.0- 30 SB- 1.0- 30 30%
DB- 1.0- 45 SB- 1.0- 45 45%
DB- 1.0- 60 SB- 1.0- 60 60%
Table 6: Identification of studied beam cases.
6 RESULTS AND DISCUSSION
a) Moment-curvature relationships
As can be noted, the ultimate beam curvature decreases and the ultimate moment increases when the steel ratio or/and the steel yield strength increase. Shallow beams experienced higher ul-timate moments and ulul-timate curvatures as compared to those of drop beams because of their larg-er section. Such reductions in beams ultimate curvatures due to the increase in the steel yield strength can result in negative impact as far as ductility is concerned.
Figure 10a: Moment-curvature of studied drop beams (ρ / ρmax = 0.4).
Figure 10b: Moment-curvature of studied drop beams (ρ / ρmax = 0.6).
Figure 11a: Moment-curvature of studied shallow beams (ρ / ρmax = 0.4).
Figure 11b: Moment-curvature of studied shallow beams (ρ / ρmax = 0.6).
Figure 11c: Moment-curvature of studied shallow beams (ρ / ρmax = 1.0).
b) Steel strain and ductility
yield strength reduces the ultimate steel strains especially for larger steel ratios. Both beam sections exhibit the same behavior with almost the same values of ultimate steel strains. Although the beam sections were designed as tension controlled members with a strain greater than 0.005, the ultimate steel strains can go below the 0.005 limit of tension failure control. Such violation cases occur when the steel ratio is equal to max and the increase in yield stress exceeds 20%. Such concerning behav-ior is observed for both drop beam and shallow beam sections.
The curvature ductility of beam sections was computed by dividing the ultimate curvature by the first yield curvature. The effect of the increase in steel yield strength on the curvature ductility is shown in Figure 13, for different steel ratios and beam sections. The reduction of curvature duc-tility is obvious with the increase in steel yield strength and the steel ratio for both beam sections. In fact shallow beam case (SB-1.0- 60) with max steel ratio and increase of 60% in steel yield strength becomes compression controlled as steel does not reach the yield value, as can be noticed in Figure 13, resulting in zero ductility.
Figure 12: Variation of ultimate steel strains with the increase in steel yield strength.
7 PROPOSED SOLUTION
The increase in steel yield strength has a negative impact by reducing the beam ductility and a positive effect by increasing the beam’s moment capacity. However in seismic design it is required to provide sufficient ductility without reducing the ultimate moment capacity. To achieve such a goal with an unexpected increase in steel yield strength, a new procedure for computing the maxi-mum tension steel ratio, above which compression reinforcement is required, is proposed.
The modified maximum steel ratio is derived from the standard expression (5) and takes into account the yield strength increase through the ratio of actual to nominal value of yield strength “y“. The newly proposed expression is :
y y
c
f
f
1 'modified max
85
.
0
8
3
)
(
(6)Such an equation will reduce the max by the factor (1/y), and allows the beam to exhibit ten-sion control failure and avoid reduction in ductility. However, this will reduce the maximum mo-ment capacity when using tension steel only. In order to increase the beam’s ultimate momo-ment ca-pacity without exceeding the modified maximum steel ratio, compression steel must be added.
Such a proposed solution is demonstrated for the case DB-1.0-60 where max is equal to 0.01613 (520 + 118) and 60% increase in yield strength. The ultimate moment and ductility are 367.145 kN.m, and 1.0483 respectively. The corresponding modified maximum steel ratio will be 0.01613/1.6 = 0.0101 (322 ) with steel yield strength equal to 420 x 1.6 = 672 MPa. This case is denoted as DB-0.6-60. The resulting moment-curvature relationship is compared with that of DB-1.0-60 in Figure 14. The enhanced ductility reached 1.8688 but with a lower ultimate moment capacity of 291.08 kN.m. The second modification is to increase its ultimate moment capacity to reach that of DB-1.0-60 (367.145 kN.m) by adding compression steel of 218, and the same amount at tension side so that the total tension steel will be 520, this case is denoted as DB-M2-60. The resulting moment-curvature relationship is compared with those of previous cases in Figure 14. Both en-hanced ductility and moment capacity are achieved even by using steel with 60% increase in yield strength. However, the increase in amount of reinforcements needed for such a modification for DB-M2-60 reaches about 14% increase as compared to DB-1.0-60.
Figure 14: Moment-curvature relation of the proposed drop beam DB-M2-60.
Figure 15: Moment-curvature relation of the proposed drop beam SB-M2-60.
8 CONCLUSIONS
favora-ble. While for concrete any strength increase may effectively be welcome without concern, for steel however an unexpected increase in yield strength may reduce the structural ductility and violate the tension-control condition of reinforced concrete beams. This violation would be even more dan-gerous if combined with an unexpected reduction in concrete strength. The higher than nominal yield values of some steel rebars produced by some manufacturers can no longer be considered fa-vorable.
From the experimental tensile tests on rebars manufactured by both tempering and quenching processes, it was shown that the ratios of mean to nominal values for yield strength “ y” are higher for rebars manufactured by quenching process, and can reach values up to 1.40. The effect for such high yield strengths was investigated experimentally on full-scale beams. Results showed the nega-tive effect in terms of ductility reduction. It was also shown that specimens made of quenched re-bars exhibit higher ultimate moments with less curvature and ductility as compared to those speci-mens made of tempered steel. Such behavior was expected since rebars having higher yield strength will not be able to experience the whole yielding plateau before concrete failure. The analytical inte-gration method of stress resultants described in this work is very efficient. It deals with any com-plex shaped section and can be performed on any polynomial model and other specific models. The method was used to compare moment-curvature with experimental results and the comparison was very good. The effects of both high yield value and reinforcement ratio observed in the experimental part are confirmed by the analytical study. Some important variables affecting the flexural behavior of beams reinforced with rebars having high yield strength, were investigated. The effect of section type and level of yield strength on the beam curvature and the ultimate steel strain were explored. The ultimate beam curvature decreases and the ultimate moment increases by increasing the steel ratio and the steel yield strength. In addition, the increase in steel yield strength reduces the ulti-mate steel strains especially for higher steel ratios. Both drop and shallow beam sections exhibit the same behavior with almost the same values of ultimate steel strains. Although the beam sections were designed as tension controlled members with a strain greater than 0.005, the ultimate steel strains can be reduced below this limit. Such violation cases occur when the steel ratio is equal to
max and the increase in yield stress exceeds 20%. Such an undesirable behavior is observed for both drop beam and shallow beam sections. These negatives effect on ductility can be avoided by reduc-ing the maximum allowed tension steel ratio by a suggested factor “1/ y”.
Acknowledgment
The authors would like to acknowledge the financial support and express their gratitude to the Deanship of Scientific Research at King Saud University for funding the work through the research group project No. RGP-VPP-105.
References
ACI Committee 318 (2011), “Building code requirements for structural concrete (ACI 318-2011), American Concrete Institute, Farmington Hill, Michigan.
Al-Haddad, M. (1995), ''Curvature ductility of R.C beams under low and high strain rates'' ACI Structural Journal, Vol. 92, No. 5, pp. 526-534.
Allorani, M., et al. (2012), “Tensile Strain limits for ductile design of RC beams reinforced with Saudi rebars” Senior Undergraduate Project CE 499-32/33-I-02/2, Department of Civil Eng., King Saud University.
Batista J., Sousa M. Jr., Muniz C. (2007), “Analytical integration of cross-section properties for numerical analysis of reinforced concrete, steel and composite frames”, Engineering Structures, (29),618-625
Bonet J.L., Barros M.H.M., Romero M.L. (2006), “Comparative study of analytical and numerical algorithms for designing reinforced concrete sections under biaxial bending”, Computers and Structures, Vol.84, pp.2184-2193 Charalampakis A.E., Koumousis V.K. (2008), “Ultimate strength analysis of composite sections under biaxial bend-ing and axial load”, Advances in Engineerbend-ing Software 39, 923-936
Charif A., Shannag J., Dghaither S. (2014), “Ductility of reinforced lightweight concrete beams and columns”, Latin American Journal of Solids and Structures, Vol.7 No 11, pp.1251-1274
Davis, H. E., et al. (1982), “The Testing of Engineering Materials,” McGraw-Hill, 4th ed.
Fafitis A. (2001), “Interaction surfaces of RC sections in biaxial bending”, Jnl Struct Eng, ASCE, 127(7):840–6. MacGregor J.G., White J.K. (2008), “Reinforced Concrete: Mechanics and Design”, 5th edition, by, Prentice-Hall. Milbourn, D. (2010), “Metallurgical Benefits of Vanadium Microalloying in Producing High Strength Seismic Grade Rebar”, Proceedings of International Seminar on Production and Application of High Strength Seismic Grade Rebar Containing Vanadium Beijing China.
Sfakianakis M.G. (1999), “Biaxial bending with axial force of reinforced, composite and repaired concrete sections of arbitrary shape by fiber model and computer graphics”, Journal of Structural Engineering,125(6):672–83.
Si Youcef, Y., Chemrouk M. (2012), “Curvature Ductility Factor of Rectangular Sections Reinforced Concrete Beams”, World Academy of Science, Engineering and Technology, Vol.6, pp.11-20
Todeschini C.E., Bianchini A.C., Kesler C.E. (1964), “Behavior of concrete columns reinforced with high strength steels,” ACI Journal Proceedings, Vol. 61, No. 6, pp. 701–716.
Zhou K.J.H., Ho J.C.M., Su R.K.L., “Flexural Strength and Deformability Design of Reinforced Concrete Beams”, The Twelfth East Asia-Pacific Conference on Structural Engineering and Construction, Procedia Engineering 14 (2011) 1399–1407