Abstract— Cognitive radio technology is in fast development and is
considered a possible solution to improve the efficiency of radio spectrum use. Many studies have been recently carried out in order to improve spectrum-sharing techniques between primary and secondary users. This paper investigates one of the basic decision problems faced by a cognitive radio: given a time window of a specific size, a secondary user (SU) should decide if it will use it or not, minimizing the chances of collision with a primary user (PU). For this purpose, an algorithm is proposed that does not require previous information about PU occupancy behavior. The proposed algorithm shows very good performance when compared to three other methods recently proposed to tackle with this problem.
Index Terms—Spectral vacancies, spectrum sharing, cognitive radio.
I. INTRODUCTION
It is well known that frequency bands solely allocated to primary services (licensed spectrum
holders) are generally underused and limit the development of new telecommunications services. As
discussed by Thomas [1], there is still much conservatism in the simultaneous use of spectrum bands
by primary and secondary users in terms of licensing and protection against interference.
Cognitive radio has been proposed as a technology for dealing with spectrum-sharing problems and
improving the efficiency spectrum use. The prediction of the occurrence of white spaces, defined as
time intervals during which a frequency channel will go unoccupied by the primary user in a certain
geographic region, is an existing challenge to be overcome in order to enable an optimized operation
of these systems. The sensing of the channel and the decision to use it on a single time-slot basis
generates severe latency due to the processing and coordination involved and can reduce the transfer
rate of desired information. Therefore, this decision should be taken for continuous blocks of
time-slots.
The prediction method proposed in this paper deals with the most basic decision problem faced by
cognitive radios: given a time window of a specific size, the secondary user (SU) should decide if it
will use it or not, keeping to a minimum the probability of collision with the primary user (PU). The
information that the SU has access to is the past-observed behavior of the PU.
Section II of the paper reviews some methods, recently developed by other authors, for solving this
problem. Section III formally presents the problem to be solved as well as the proposed solution and
the underlying algorithm. Section IV describes the measurements campaign [2] that provided
Spectral Vacancies Prediction Method for
Cognitive Radio Applications
A. Canavitsas, L. da Silva Mello, M. Grivetspectrum occupancy data to test the proposed algorithm. Section V shows the performance
comparison of the proposed method with other methods found in the technical literature. Finally,
Section VI presents the conclusions of the work.
II. RELATED WORKS
Soleimani et al [3] developed a dynamic handoff procedure based on decreasing handoff rate as
well as increasing overall secondary users' throughput. Using a Hidden Markov Model (HMM), the
secondary user predicts the next primary user's arrival based on past observation and a model which is
learned from past data. The idle probability of target channels is used to improve the accuracy of the
scheme. Simulation results show that, considering handoff rate and packet delivery ratio, the proposed
scheme is efficient for light loaded traffic.
Game Theory is also a fertile ground to deal with frequency spectrum inefficiencies [4] but as far as
the authors could observe, it is more concerned with the situation of spectral sharing by several
cognitive users or networks. Furthermore, it does require the definition of utility functions that could
be difficult de assess or define.
On these lines, Jing et al [5] investigated cooperative spectrum prediction and local prediction.
They proposed a local spectrum prediction method in which each secondary user senses the current
channel state and uses a Hidden Markov Model (HMM) to predict the future channel states. They also
proposed a cooperative spectrum prediction method based on a coalitional game-based approach, in
which the secondary users are considered as players who attempt to form coalitions and cooperatively
predict the future channel status. The results indicate that the prediction accuracy can be improved
through cooperation.
The recent work of Akhtar el al [6] presents a novel spectrum decision scheme, which according to
the authors, remains an unexplored area in cognitive radio research. The proposed decision making
scheme is based on the fusion of three key channel parameters i.e. channel idle time, channel
occupancy status and channel performance, thereby facilitating the secondary user to occupy the
targeted channel without impairing the licensed user’s communication while maintaining its own QoS
requirements. Decision structural function is used as an evaluation measure to check the robustness of
the proposed scheme.
Barnes and Maharaj [7] proposed a method to improve the performance of cognitive radios
increasing secondary users flow and reducing data degradation of information sent by the primary
user. A channel switching simulator was developed to evaluate the performance of the primary users,
wherein the Hidden Markov chain is implemented to model and predict the behavior of primary user.
According to then, the performance of the cognitive system can be enhanced if the UP behavior is
adequately modeled. Thus, significant gains in system performance can be obtained using a prediction
Zao et al [8] combine the sensing and prediction to enhance the spectrum utilization and reduce the
interference on the primary user. In addition, they propose an effective solution using the dual optimal
theory.
Gulnur et al [9] proposed methods that are based on the correlation and linear regression analysis of
the previous decisions, to further forecast the future spectrum status. Since these prediction
mechanisms solely depend on individual sensing histories of secondary users, they are suitable for
implementation in cognitive radio ad hoc networks.
Guknur and Oktug [10] also propose a method for predicting spectrum holes by defining service
classes among CR users and accomplish spectrum sharing mechanism accordingly.
III. PROPOSED ALGORITHM
A. Problem statement
Consider the situation in which a secondary user (SU) wishes to opportunistically use a channel
assigned to a primary user (PU). For this purpose, the SU probes the channel, checking at each time
slot if it is occupied by PU (busy) or not (idle) in order to capture de PU’s occupancy statistical
behavior. Considering t as the present moment, SU captures the channel status (busy or idle) at time
slots t, t-1, …., t-N (observation window) and wishes to decide how to behave (in terms of occupation
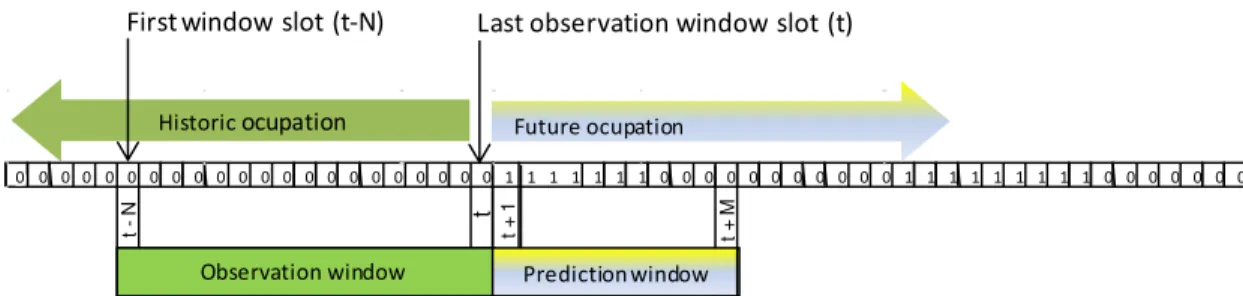
or not) at time slots t+1, t+2, …., t+M (prediction window), as indicated in Figure 1. Please notice that
no further information is assumed to be known except the observed channel status data during the
observation window.
It is important to realize that this work is based on the assumption that the window sizes M and N
are somehow established and the goal here is to do the best under these circumstances. It is obvious
that parameter M and N have an impact on the collision statistics, but this is not treated here although
it is conceived that some form of optimization can be proposed in order to seek for good values for M
an N as far the successful occupancy of the prediction window is concerned.
Fig. 1. Historic and future occupation, observation and prediction windows
We initially assume that M and N are small when compared with the average times of activity and
idle periods exhibited by the PU. This is convenient because one can then assume that it is unlikely
that observation and prediction windows do cover more than one pair of busy and idle cycles. Hence,
Historicocupation
Primeiro slot da janela
Last observation window slot (t) First window slot (t-N)
0 0 0 0 0 0 0 0 0 0 0 0 0 0 0 0 0 0 0 0 0 1 1 1 1 1 1 1 0 0 0 0 0 0 0 0 0 0 0 1 1 1 1 1 1 1 1 1 0 0 0 0 0 0 0
t
t
-N
t
+
1
t
+
M
Observation window
0
denoting by Xk the channel state due to PU activity (0=idle; 1=busy) and in the absence of occupancy
observation errors, there are two possible cases for the observation window:
• Case 1: Xt-k = 0 for all k in {0, 1, …L-1} and Xt-k = 1 for all k in {L, L+1, …N-1} • Case 2: Xt-k = 1 for all k in {0, 1, …L-1} and Xt-k = 0 for all k in {L, L+1, …N-1}
Please notice that the cases are direct consequences of the assumption made in the last paragraph.
Nevertheless, in real situations there are observation errors. We assume that each element of the
observed sequence {Xt-k, k={0, 1, …M-1}} can be independently corrupted by noise in such a way
that state inversion occurs with a fixed probability smaller than 1/2.
These considerations allows us to conclude that the elements of the above sequence can be treated
as independent, Bernoulli-distributed random variables where {Xt-k, k={0, 1, …L-1}} are Bernoulli(p)
while {Xt-k, k={L, L+1,…N-1}} are Bernoulli(1-p).
Case 1 corresponds to the situation where p<1/2 and Case 2 is associated with p>1/2. So, the
problem to solve is this: taking into account the observation window has produced the values {Xt, Xt-1, …, Xt-(N-1)} for the channel status, we want to properly estimate the values of p and L that will be used
for the prediction scheme. The decision of occupying the prediction window will be based upon these
two quantities.
B. Proposed solution
In a nutshell, we follow here the classical statistical methodology [11] where the main idea is to
access the likelihood of the observed sequence {Xt, Xt-1, …Xt-(N-1)} as a function of L and p and then
finding values for these parameters that lead to its maximization. By doing this, we are pursuing the
best estimation line of work when no extra information is given about the data.
Since the observation errors are statistically independent, which is a quite fair assumption, the
likelihood of the observed sequence is given by:
(1)
where:
It is relatively simple to note that: Xt
N
=
(
Xt, Xt-1,..., Xt- ( N-1))
L Xt N
( )
=( )
1- p (1- Xt-i) .pXt-ii=0 L-1
Õ
é ë
ê ù
û
ú. p(1- Xt-i)
. 1
( )
- p Xt-ii=L N-1
Õ
é ë
ê ù
û
ú=
=
( )
1- p L- SL
-( )
.pSL
-é ëê
ù ûú. p
N-L-SL +
(
)
. 1( )
- p SL+é ëê
ù ûú=
=pN- L-SL -+S
L +
(
)
. 1( )
- p(
L-S-L+SL+)
=pN- j( )L. 1
( )
- p j ( )LSL- = Xt- i
i=0 L-1
å
SL+ = Xt- i
i=L N-1
å
= Xt- ii=0 N-1
å
- Xt- ii=0 L-1
å
=S- SL--• if then is maximum when p=0
• if then is maximum when p=1
• if then is maximum when
From the above we can conclude that in all cases, is maximized when . To
avoid possible numeric underflows during its computation, the log likelihood function is used. Its
optimal value is then given by:
(2)
whose maximum in L can be found by brute force with low computational cost.
Unfortunately, when the estimated L is small, the sensitivity of the p estimator is often high because
small bursts of 0’s or 1’s can be solely caused by observation errors. To mitigate this undesirable
effect, when estimated L is smaller than a threshold Lbound, which should be found by experimentation,
we decide to estimate p by means of the empirical error frequency in the whole sequence.
Although rare, it is possible that more than one PU cycle of activity/idleness can occur inside the
observation window. Again, this effect can be mitigated by re-applying the (L, p) estimation in the
observation sub-window where L* was found in the first phase.
From a formal point of view, the proposed (L, p) estimation algorithm is described below, step by
step:
j
( )
L =N L X( )
tNj
( )
L =0 L Xt N( )
j
( )
L Ï{ }
0, N L Xt N( )
p=1- j( )
LN
L Xt N
( )
p=1- j( )
LN
Lopt Xt N
( )
=(
N- j( )
L)
.log 1- j( )
L Næ è
ç ö
ø
÷+ j
( )
L .log j( )
L N æ è ç ö ø ÷Xt,Xt-1,...,X
t- ( L*-1)
(
)
____________________________________________________________________________________
1: Calculate j
( )
L =L+ Xt-ii=0
N-1
å
- 2. Xt-ii=0
L-1
å
for LÎ{1,2,..., N}2 : Calculate L*
that maximize Lopt Xt N
( )
=(
N- j( )
L)
.log 1- j( )
L Næ è
ç ö
ø
÷+ j
( )
L .log j( )
L N æ è ç ö ø ÷3: If L*<
Lbound then
4: p**= 1
N Xt-i i=0
N-1
å
L**=Lbound
5 : Else, for LÎ{1,2,..., L*},
6: Calculate L** that maximize Lopt Xt N
( )
=(
N- j( )
L)
.log 1- j( )
L Næ è
ç ö
ø
÷+ j
( )
L .log j( )
L N æ è ç ö ø ÷7 : Let p**=
1- j L
**
( )
N 8 : end if9: return the pair (L**, p**)
The proposed method for the SU occupancy of the prediction window is simple, and it is based
upon the estimation of the pair (L,p), as discussed in previous section. It can be stated as follows: if
the estimated p is less or equal to 1/2, the prediction window is fully used by the SU, since it is more
likely that this window is made by 0’s. Otherwise, prediction window is simply not used by SU.
C. Performance evaluation
In order to access the quality of the proposed estimation procedure, a computer program was built
that:
i. for fixed values for M and N, randomly selects several values for L and p;
ii. for each one of these pair of values:
a. a long binary sequence with these characteristics is generated;
b. parameters L and p are estimated by the proposed method.
iii. these estimated parameters are then confronted with the real ones, and their statistical
relative differences are evaluated.
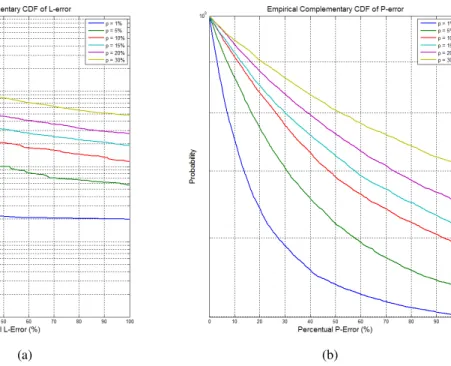
A series of 10000 cases were generated, and for each of them the statistical behavior of relative
L-error, namely , and P-error, namely, , were evaluated for several
values of channel observation errors.
Figure 2 illustrates the complementary cumulative distribution functions of these relative errors for
values of observation error ranging from 1% to 30%. In Figure 2(a) we can see that, if observation
error does not exceed 5%, then the probability the relative L-error does exceed 0% is 3%, while in
Figure 2(b) the probability the relative P-error does exceed 50% value in 63% of the cases.
(a) (b)
Fig. 2. Complementary CDF of L-error and P-error behavior
It is important to notice that the P-error is of little significance in the sense that what matters is if
both Pestimated and Preal are simultaneously below or above 1/2. According to figure 2(b), if we have
measurement errors not superior to 30%, no more than 10% of the cases violate the mismatch
mentioned.
IV. EXPERIMENTAL DATABASE
In order to produce real data from a typical cognitive radio environment, a measurement campaign
was performed in the city of Campinas, São Paulo, Brazil, where the 450-470 MHz frequency band
was monitored in the urban environment. Taxi radio companies, highway concessionaires, airlines
administrative communications, transport companies and oil refineries use this frequency band for
voice services. These are examples of Private Limited Service primary users.
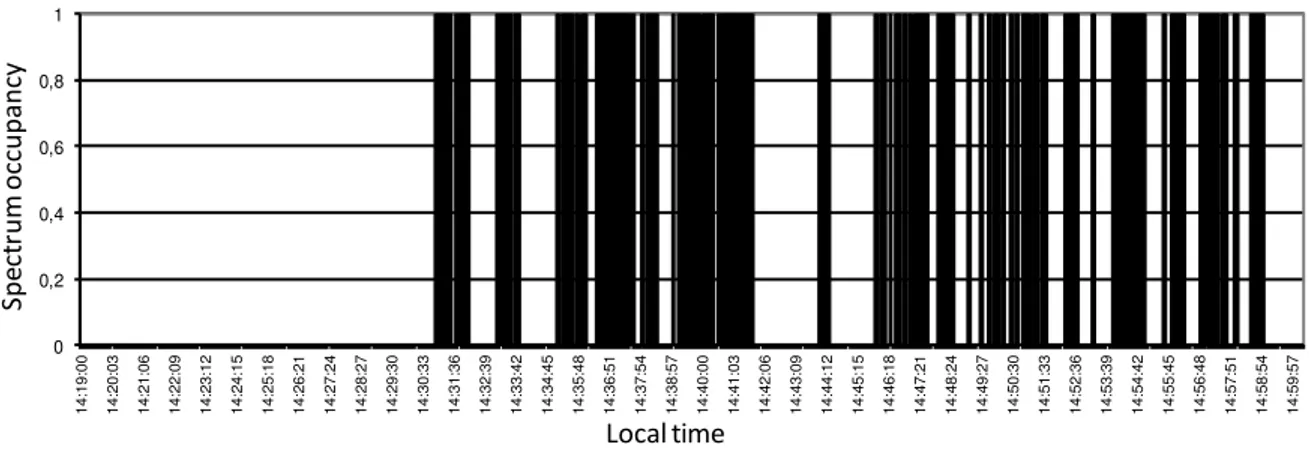
A representative example of the results obtained is shown in Figure 3 for the 457.530 MHz channel
that, monitored during the period from 14:19:00 to 15:59:57 hours, had an occupation of 34% of time.
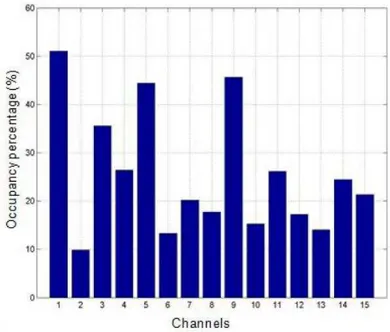
Individual channels percentage of occupancy are displayed on Figure 4. The overall average
occupancy during the measurements period was around 26% of the time, which indicates high
idleness in the time domain.
Fig. 3. Time series of spectrum occupancy at 457.530 MHz in Campinas, Brazil
Fig. 4. Channel occupancy in the 450-470 MHz band in Campinas, Brazil
The audio records were individually analyzed to identify the periods of conversation and the black
and white spaces within the conversations, as illustrated in Figure 5. Channel occupancy was detected
by means of techniques described in [12] and [13] and are also explained in [14]. Although subjected
to human interpretation, the eventual errors introduced should not produce significant impact on the
results.
Fig. 5. Definition of the parameters measured
The results of these measurements allowed the statistical assessment of relevant data parameters
such as: i) time between conversations, ii) black and white space durations and iii) number of voice
bursts in each conversation. Using this characterization, an arbitrary number of random input
sequences can be generated for simulation purposes, in which the statistical similarity with the
collected real data is totally preserved. It is important to notice that these generated sequences are
P
re
s
e
n
c
e
o
f
v
o
ic
e
b
u
rs
ts
Time line TBC 1
Time Between Conversations –TBC(n)
Beginning of the first black space.
TBC 2
Conversation 1
Human intervention is needed to identify the conversation.
Conversation 2
TBC (n)
Quantity of Speech Bursts within the conversation–QSB(n)
statistically indistinguishable from the original measured sequence thus allowing that collected
statistics of performance indicators do present statistical significance.
V. SIMULATION RESULTS AND COMPARISON WITH OTHER METHODS
Gulnur et al [6] recently proposed three methods to deal with the spectrum vacancy prediction
problem that perform well when compared with other techniques found in the literature. The methods
are:
• prediction based on the Pearson correlation coefficient (Method 1);
• linear regression-based prediction (Method 2);
• prediction based on auto-correlation (Method 3).
In this article, they compare the performance of the above methods with those proposed by Zao et al
in [8] and simulations results have showed that the former outperforms the latter. Due to this reason,
we only compare our proposed method with those in [6].
The performance evaluations discussed here are based on those used in the majority of articles in
this field, namely, the System Utility (SU) and the PU Disturbance Ratio (DR) that, for the sake of
clearness, are explained below:
• System Utility (SU) is the ratio between the successful use of spectral vacancies and the total white spaces detected. It expresses how efficient the secondary user opportunistically uses the primary
user idle periods. Ideally, this value should be as close as possible to 100%.
• PU Disturbance Ratio (DR) is the ratio between the number of slots in which the secondary user has allocated its transmissions by the number of slots that the primary user was transmitting. It
expresses the unwanted impact of the secondary user actions on the primary user channel’s use.
Ideally, this value should be as close as possible to 0%.
Several input sequence of length 107 were synthetically generated preserving the statistics observed
in the real measured data as above discussed. For each one of them, the mean and standard deviation
of the performance indicators DU e DR where evaluated for several values channel status error
probability and observation and prediction window sizes. In the majority of cases, the method here
proposed outperformed those obtained by the three methods presented in [6].
In order to illustrate a typical comparison result, figures 6 and 7 do present such a comparison for
the case where prediction windows respectively have lengths 1000 and 600 and for error probabilities
ranging from 0% to 20%. From there we can observe that the proposed method statistically
outperformed all others in both performance indicators.
One interesting by-product of the method here presented and visible in these figures, is its observed
insensibility of the System Utility statistics to the chosen range of error probability. For the large
Fig. 6. SU and DU as a function of error probability for observation/prediction window sizes of 1000/600
VI. CONCLUSIONS
A low computational cost algorithm for spectral vacancies prediction was developed to allow a
secondary user (SU) to decide, based on the observation of the primary user (PU) occupancy on a past
observation window of fixed size, whether to occupy a future window minimizing the disturbance of
the primary user transmissions. The method does not require previous information about PU
occupancy statistics, only the data collected in each observation window.
To test the proposed method in a typical scenario, real data collected from a measurement campaign
on a voice radio-communications system operating in the 450-470 MHz band was deployed.
Performance tests shown that the method in question outperformed three other methods recently
proposed to deal with this problem, as far as System Utility and Disturbance Ratio are the
performance indicators.
This comparison has shown the robustness and superiority of the proposed method, for error
probabilities in the range 0%-20% and prediction window size from 500 to 3000 samples. As a last
detail, it is important to acknowledge that the greater the size of the prediction window, the smaller is
the need for probing channel status, which in general requires precious computational resources.
ACKNOWLEDGMENT
CNPq (National Research Council, Brazil) supported this work under covenant 573939/2008-0
(INCT-CSF).
REFERENCES
[1] Thomas G., Fast detection of spectral white spaces for cognitive radio networks IEEE MILCOM 2009, Univ. of Louisiana at Lafayette, Lafayette, LA, USA - October, 2009.
[2] Canavitsas A., da Silva Mello L., Grivet M. Spectrum Occupation Modeling on the 450 MHz Band for Cognitive Radios Application. EUCAP 2013 - Gothenburg, Sweden - April, 2013.
[3] Soleimani T., Azad Q., Kahvand M., Sarikhani, R. Handoff reduction based on prediction approach in Cognitive Radio Networks ICCT 2013, - Guilin, China - Nov. 2013
[4] Silverman, S.J. Game Theory and Software Define Radios, Military Communication Conference, 2006 – MILCOM 2006, IEEE.
[5] Jing T, Xing X, Cheng W, Huo Y., Cooperative spectrum prediction in multi-PU multi-SU cognitive radio networks. ICCR 2013 - Beijing, China - Nov. 2013
[6] Akhtar, A.N., Rashdi, A., Arif, F., Fusion Based Spectrum Decision Framework for Cognitive Radio Users - Mobile and Multimedia Networks (WoWMoM), 2015 IEEE 16th International Symposium on a World of Wireless - Boston, MA – USA
[7] Barnes S.D., Maharaj M.T., Prediction based channel allocation performance for cognitive radio. International Journal of Electronics and Communications pp.336-345 Volume 68, Issue 4, April 2014. [8] Zhao Z., Wang L.l, Ding G., Wei S., Enhanced Spectrum Decision Based on the Combination of Sensing
and Prediction - Cross Strait Quad-Regional Radio Science and Wireless Technology Conference (CSQRWC), 2011 – Harbin - China
[9] Gulnur S., Uyanik, Canberk B., Oktug S., Predictive Spectrum Decision Mechanisms in Cognitive. Radio
Networks GC’12 Workshop: Ad Hoc Networking with MIMO and Cognitive Radio, - Anaheim, California,
USA - Dec. 2012.
[11]Cox D.R., Principles of Statistical Inference, Cambridge University Press, 2006.
[12]Maharjan S., Takada K., Experimental Study of Energy Detector Prototype for Cognitive Radio System. IEICE Technical Report, SR-2007-52(2007-11), Hiroshima International University, Hiroshima, Japan. [13]Kim J., Jeffrey A., Sensitive White Space Detection with Spectral Covariance Sensing. IEEE Transactions
on Wireless Communications, Vol. 9, No. 9, September 2010.