THE QUANTUM METROLOGY TRIANGLE EXPERIMENT:
QUANTIZATION TESTS OF AN ELECTRON PUMP
S. Sassine∗, B. Steck∗, N. Feltin∗, L. Devoille∗, B. Chenaud∗, W. Poirier∗, F. Schopfer∗, G. Spengler∗, O. Séron∗, F. Piquemal∗, S. Lotkhov†
∗Laboratoire National de Métrologie et d’Essais (LNE),
29 avenue Roger Hennequin, F-78197 Trappes, France
†Physikalisch-Technische Bundesanstalt (PTB),
Bundesallee 100, D-38116 Braunschweig, Germany
ABSTRACT
We present our experimental set-up and discuss the results obtained with the quantum metrological triangle (QMT) ex-periment. This experiment consists in realizing Ohm’s law with the three effects used and investigated in quantum elec-trical metrology: the Josephson effect (JE), the quantum Hall effect (QHE) and the single electron tunneling effect (SET). The aim is to check the consistency of the phenomenologi-cal constantsKJ,RK andQX associated with these effects and theoretically expressed with the fundamental constantse
andh(elementary charge and Planck constant, respectively). Such an experiment is a contribution for a new definition of electrical units in the International System (SI).
KEYWORDS: electrical metrology, low current measure-ments, cryogenic current comparator, quantum metrological triangle, quantum current standard.
1
INTRODUCTION
More than twenty years ago, profound changes occurred in electrical metrology with the introduction of quantum physics. The quantum effects enabled the development of standards that are more stable, more robust, more
repro-Artigo submetido em 12/10/2009 (Id.: 01057) Revisado em 27/03/2010, 22/10/2010
Aceito sob recomendação do Editor Associado Prof. Sebastian Yuri Caval-canti Catunda
ducible and more accurate. Since this time, the reference standards of resistance and electrical voltage are based on quantum Hall (QHE) and Josephson effects (JE), which are linked to the von Klitzing constant RK and the Josephson constantKJ, respectively. These quantum effects insure for the corresponding units, the ohm and the volt, a high level of reproducibility (as high as a few parts in 1011for the JE and a few parts in 109
for the QHE) and a unique representation all over the world. Thus nowadays, since an accurate cur-rent standard is not available, the ampere is experimentally produced by means of the practical volt and ohm originating from the JE and QHE, respectively, via the Ohm’s law.
At the same time, the advent of the single-electron devices can pave the way for developing a new current standard with an accuracy better than that obtained with the material stan-dards up to now (Zimmerman and Keller 2003; Graber and Devoret 1992). The principle is based on a phenomenon called single-electron tunneling (SET) which ensures a quan-tized flow of charges through a nano-device. For 15 years, the development of the nanofabrication has made possible the realization of these quantum devices enabling the manip-ulation of individual electrons.
The basic principle is represented in figure 1 and consists in applying a “quantum” Ohm’s law (Piquemal and Genevès 2000):
VJ=RH.ISET (1)
Figure 1: Principle of the QMT.ǫJ ,ǫKandǫerepresent the correc-tion factors onKJ,RK,QX.
VJ andRHdenote the Josephson voltage and the Hall resis-tance respectively. ISET corresponds to a current generated by a SET device. This is the direct way for closing the QMT.
Another method is the indirect way which consists in devel-oping a quantum capacitance standard from SET devices, called Electron Counting Capacitance Standard (ECCS). This experiment firstly implemented by the NIST allowed to successfully closing the QMT with a relative standard uncer-tainty of 9.2 parts in 107 (Keller, Zimmerman and Eichen-berger 2007) . The principle is simply based on the natural definition of capacitance. The experimental set-up is com-pletely described in (Keller, Zimmerman and Eichenberger 2007).
In our experiment, the SET devices are metallic 3-junctions single electron pumps in aluminium consisted of two gate electrodes and on-chip resistors at the ends in order to re-duce the co-tunneling effect (Lotkhovet al. 2001; Stecket al. 2008) . The quantized current generated by this pump is theoretically equal toe.fSET (fSET denotes the pumping frequency applied to the gates) and is measured through a cryogenic current comparator (CCC), which allows to am-plify the low SET current with a metrological accuracy.
Practically, the closure of the QMT is a measurement of the
productRKKJQX, theoretically equal to 2 (KJ = 2e/his the Josephson constant,RK=h/e2the von Klitzing constant andQX = ean estimate of the electron charge). Checking the equalityRKKJQX = 2 at an uncertainty level of 1 part in 108
is the ultimate aim of this experiment and will be a significant contribution to the redefinition of electrical units from (h,e).
Moreover, the development of a SET current standard could lead to the definition of a quantum ampere as the product of the elementary charge and a frequency. The classical def-inition of the ampere is: “The ampere is that constant cur-rent which, if maintained in two straight parallel conduc-tors of infinite length, of negligible circular cross-section, and placed 1 metre apart in vacuum, would produce between these conductors a force equal to 2×10⁻⁷newton per metre
of length”. This definition fixingµ0(vacuum permeability)
allows relating the electrical units to the mechanical units via a force, but the experimental realization of the current unit called “ampere balance” is not used any more. In this exper-iment, a current flew through two coils and the interaction force between these two coils was measured. The main limi-tation of this standard was due to the imperfect determination of the geometry of the coils, so the ultimate achieved uncer-tainty was 5×10⁻⁶(Elmquistet al.2001).
In the context of the current discussion about revising the SI based on fundamental constants, the use of a quantum am-pere standard could be the most suitable way for the “mise en pratique” of the ampere if it is redefined as: “The am-pere is the electrical current equivalent to the flow of exactly 1/(1.602 176 487×10−19) elementary charges per second”
(Mills et al. 2006) . This definition fixes the elementary charge as exactly 1.602 176 487×10−19A·s. The value of etaken here is the 2006 CODATA recommended value.
2
EXPERIMENTAL DESCRIPTION
Our implementation of the direct closure of the QMT is shown in figure 2: the current supplied by the SET source is amplified, then feeds a resistorRcalcalibrated againstRK by means of the QHE and the voltage induced at the termi-nals of the resistor is compared, in real time, with the voltage
Figure 2: Our experimental set-up for the direct closure of QMT.
for the very accurate comparison of resistances. It can be also used as an amplifier with a very accurate known gain (better than 10−8
) (Gay,Piquemal and Genevès 2000; Gal-lop and Piquemal 2006) . It also has an excellent current resolution (around 1 fA/Hz1/2 in the white noise regime). The QMT’s CCC consists of two windings ofN1 = 20000
turns andN2= 1 turn embedded in a superconducting
toroï-dal shield associated with a magnetic flux detector which is a DC SQUID (Superconducting Quantum Interference De-vice), and its gain is exactly equal to the winding ratio (G=
N1/N2). The first winding is directly connected to the pump
and is flowed by the quantized currentISET while the sec-ond winding is fed by a feedback current IF B = G.ISET supplied by a home-made external stable current source. The synchronization between the Josephson array and the current supplied by the SET device is ensured by Digital Analogi-cal Converters (DAC) driven by a computer (not represented in figure 2). The working principle of the home-made cur-rent source is the following : the voltage signal coming from a DAC, which supplies the main value of the feedback sig-nal (adjusted to a value close to 20000.ISET), and the feed-back signal of the Squid electronics (the small deviation mea-sured by the Squid), are isolated seperately through high in-put impedance differential amplifiers. Then these voltage signals are summed and then converted to current through a voltage-current conversion circuit having a current range
be-tween 20 nA and 1µA. A scheme of this home-made current source is presented in figure 3.
In practice, the relation (1)becomes:
VJ =Rcal.G.ISET (2)
Preliminary results obtained with the complete QMT set-up have demonstrated the feasibility of the experiment. The null detector (which is an Agilent 3458A 81/2 Digit Multime-ter) shown in figure 2 measures the difference between the Josephson voltage and the voltage drop at the terminals of the calibrated resistor,Vd = VJ-VR, withVR = Rcal.IF B. From this datum and for testing the measurement bench, the quantity∆e/ehas been determined in the following way:
∆e
e =
Qx−eCODAT A
eCODAT A
(3) where
Qx=
1
G.fSET.Rcal
.
n JfJ
KJ −
Vd
(4)
Figure 3: Scheme of the home-made current source.
3
RESULTS
The various parameters of the SET pump have been esti-mated from the experimental stability diagram as described in a previous paper (Steck et al. 2008) . The three junc-tion capacitancesCL,Cm,CR(left, middle and right resp.) have been found to be CL = 115 aF, Cm = 80 aF, CR = 115 aF. The two gate electrodes controlling the charging states of the islands have capacitances ofCg1= 35 aF, Cg2
= 30 aF. The parameters characterizing the cross-talking ef-fect due to the proximity of islands, defined in (Stecket al.
2008) , have been found to bef1 = 0.3 andf2 = 0.25. A
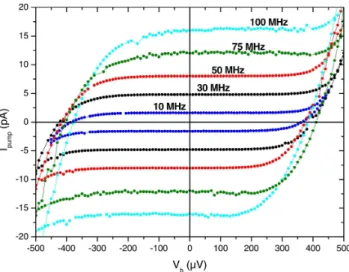
white noise level close to 3 fA/Hz1/2 has been measured with the complete measuring system at 1 Hz. A large se-ries of current plateau measurements (Ipump/Vbias) has been performed with the complete experimental set-up (figure 2) in the frequency range 10–100 MHz by measuring the volt-age at theRcal terminals by means of a multimeter (figure 4). Negative current steps have been carried out by phase shifting the second harmonic signal (Stecket al.2008) .
As expected, when the frequency is increased the plateau width decreases and the centre of the plateau where the co-tunnelling is minimized shifts towards larger bias voltage.
As shown in figure 5 (blow-up of two current steps for 10 MHz and 30 MHz pumping frequencies) the current plateau
Figure 4: A series of current plateaus in the frequency range 10–100 MHz.
is flat over a relatively large bias voltage range, 350µV for 30 MHz and 390µV for 10 MHz, within the noise floor∆Inf = 40 fA. These results are similar to those obtained in inter-nal feedback mode where the output current of the SQUID electronics is fedback directly to the SQUID and not in the secondary winding of the CCC (Stecket al.2008).
-200 -100 0 100 200 300 1.55 1.60 1.65 4.75 4.80 4.85 4.90 30 MHz
Ipu
m p ( p A )
Vb (µV)
10 MHz 40 fA
centre of the plateau
Figure 5: Blow-up of two current plateaus obtained at 10 MHz and 30 MHz pumping frequencies. The hatched parts represent the 40 fA noise for a 5 minutes measuring time.
to reduce random uncertainty. The bias voltage is adjusted in such a way that the generated current corresponds to the center of the plateau. Investigations about the time domain stability of a R-pump have demonstrated that 1/f noise oc-curs very early after roughly 100 s (Stecket al. 2008). The appearance of a 1/fregime displays high correlations among the measurable quantities and limits the reduction of the ran-dom uncertainty. The1/f noise can be avoided by periodi-cally reversing the SET current with modifying, for instance, the phase shift between the two gate harmonic signals.
As a consequence, the complete system including the sta-ble current source and the DC SQUID has to be especially designed for quick (roughly at the rate of 1 Hz) periodic inversions of the current. The synchronization between the Josephson array and the current supplied by the SET device is ensured by Digital Analogical Converters (DAC) driven by a computer (not represented in the figure 2).
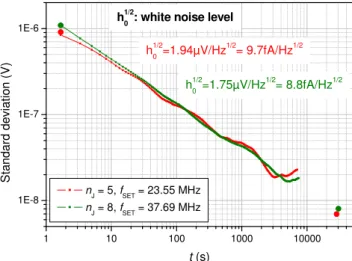
From measurements carried out over measuring time as long as 10 hours, Allan standard deviations have been calculated for two different frequencies and reported in figure 6. Five (eight, resp.) junctions of the Josephson array have been bi-ased for balancing the potential drop induced by the current of the pump driven at 23.55 MHz (37.69 MHz, resp.).
The Allan standard deviation, firstly developed by the time and frequency community, is used for describing the noise nature over long time ranges and for revealing the possible correlations among data. Moreover, it is a convenient statisti-cal tool because in white noise regime,i.e. when the data are uncorrelated, the Allan variance and the experimental vari-ance of the mean are unbiased estimates of the theoretical variance. As a consequence, the experimental standard de-viation of the mean (ESDM), recommended in the GUM for
1 10 100 1000 10000
1E-8 1E-7 1E-6
h1/2
0 : white noise level
h1/20 =1.75µV/Hz1/2= 8.8fA/Hz1/2
n
J = 5, fSET = 23.55 MHz
n
J = 8, fSET = 37.69 MHz
S ta n d a rd d e v ia ti o n ( V )
t (s)
h1/20 =1.94µV/Hz1/2= 9.7fA/Hz1/2
Figure 6: Allan standard deviations (dots and lines) and experimental standard deviation of the mean (large points) calculated for two dif-ferent frequenciesfSET= 23.55 MHz and 37.69 MHz corresponding to 5 and 8 biased junctions of the Josephson array respectively.
characterizing the type A uncertainty, can directly be read on the Allan deviation curve shown in figure 6 since this curve varies according to aτ−1/2
-law distinguishing a white noise regime.
From measurements ofVdin readout of the null detector, the quantity∆e/e, discrepancy betweenQX and the CODATA recommended value ofe(Lotkhovet al.2001) has been cal-culated and reported in figure 7. For each value, the ESDM calculated through Allan deviation is given. Within one run corresponding to 6 measurements (figure 7) and with a given adjustment of the parameters, a consistent set of data has al-lowed to achieve a weighted random uncertainty of 4 parts in 106
. A similar result (7 parts in 106
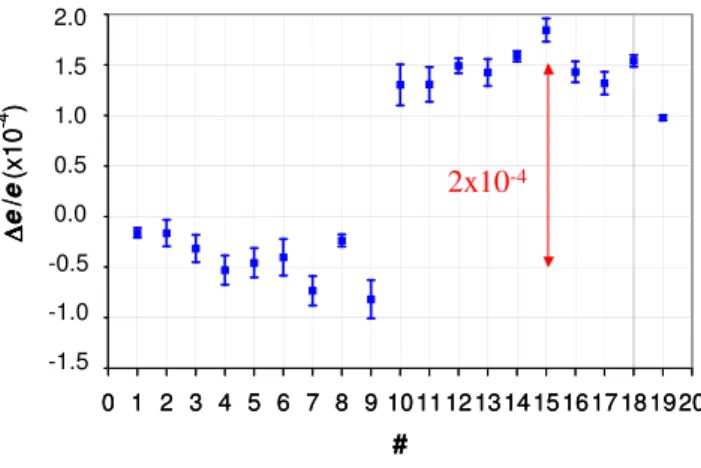
) has been obtained with a second pumping frequency (fSET = 23.55 MHz) and 5 bi-ased Josephson junctions. However, discrepancies as large as 1.5 parts in 104
have been measured on the absolute value of SET current from a run to the other (figure 8). Some changes on the experimental set-up (shielding, ground. . . ) are in progress in order to suppress these irreproductibilities.
4
CONCLUSION
0
1
2
3
4
5
6
7
8
1.1
1.2
1.3
1.4
1.5
1.6
1.7
Number of measurement
ur
= 4
⋅
10
-6f
SET= 37.69 MHz
n
J= 8
∆
e
/
e
×
1
0
-40
1
2
3
4
5
6
7
8
1.1
1.2
1.3
1.4
1.5
1.6
1.7
Number of measurement
ur
= 4
⋅
10
-6f
SET= 37.69 MHz
n
J= 8
∆
e
/
e
×
1
0
-4Figure 7: A series of 6 measurements performed at a 37.69 MHz pumping frequency over a run. The blue point is the weighted mean associated with its relative uncertaintyur.
-1.5E-04 -1.0E-04 -5.0E-05 0.0E+00 5.0E-05 1.0E-04 1.5E-04 2.0E-04
0 1 2 3 4 5 6 7 8 9 10 11 12 13 14 15 1617 18 19 20
# ∆∆∆∆ e / e (x 1 0 -4 ) 0.5 1.0 1.5 2.0 -0.5 0.0 -1.0 -1.5 2x10⁻⁴ -1.5E-04 -1.0E-04 -5.0E-05 0.0E+00 5.0E-05 1.0E-04 1.5E-04 2.0E-04
0 1 2 3 4 5 6 7 8 9 10 11 12 13 14 15 1617 18 19 20
# ∆∆∆∆ e / e (x 1 0 -4 ) 0.5 1.0 1.5 2.0 -0.5 0.0 -1.0 -1.5 2x10⁻⁴
Figure 8: Discrepancies observed from one run to another forfSET = 37.69 MHz and 8 biased junctions.
the aluminium devices (Fujiwara, Nishiguchi and Ono 2008; Blumenthalet al. 2007). Consequently the set-up described in this work will be able to be used to verify the quantization of the current they supply.
Afterwards, checking the equalityRKKJQX= 2 with lower uncertainties for preparing the new S.I. induces the use of a new type of CCC and/or implementation of a new SET candi-date. For instance, CCCs consisted of more sensitive SQUID are presently developed in our laboratory.
Finally, in case that the 10−8 targeted uncertainty was achieved in the QMT and the watt balance experiments, then the set of experiments {QMT, watt balance, calculable ca-pacitor (in which the 10−8
uncertainty is already achieved)} could be an alternative for replacing the calculation given by the relatione= [2αh/(µ0c)]
1/2
in the CODATA adjustment by a direct determination ofe[8,16].
In summary, in the framework of a modification of the SI, the
closure of the QMT will have major implications for electri-cal units. Indeed, a successful outcome both for the Watt balance and for the QMT would make it possible to link the kilogram tohand the Ampere toe. In this case, a determi-nation ofeand a sufficient confidence in the relationsKJ= 2e/handRK=h/e2are needed. As shown above, the QMT can strengthen this confidence and allows a determination of the charge quantumQXin the SI of units.
AKNOWLEDGMENTS
This work was partially funded by the French National Research Agency project n°ANR-05-JCJC-0089-01 and by the European Community’s Seventh Framework Program “ERA-NET PLUS” (Grant Agreement N°217257) within the EURAMET Joint Research Project “REUNIAM”.
REFERENCES
Blumenthal, M.D.et al.(2007). Gigahertzquantized charge pumping.Nature Physics, 3, pp. 343-347.
Elmquist, R.E.et al. (2001). The ampere and electrical-standards.Journal of Research of the National Institute ofStandards and Technology, 106, pp. 65-103.
Fujiwara, A., K. Nishiguchi, and Y. Ono (2008).Nanoam-pere charge pump by single-electron ratchet using siliconnanowire metal-oxide-semiconductor field-effect transistor.Applied Physics Letters, 92:4, pp. 042102.
Gallop, J. and F. Piquemal (2006). in The SQUIDHand-book,Applications of SQUIDs and SQUID Systems.Vol. II, Ch. 9, p. 95, Eds. J. Clarke and A. Braginski. Weinheim,Wiley-VCH.
Gay, F., F. Piquemal, and G. Genevès (2000). Ultralow noise amplifier based on a cryogenic current compara-tor.Review of Scientific Instruments, 71:12, pp. 4592-4595.
Graber, H. and M.H. Devoret (1992). Single ChargeTun-neling. NATO Advanced Studies Institute, Series B: Physics, Vol.294. Plenum, New York.
Keller, M.W., A.L. Eichenberger, J.M. Martinis, and N.M. Zimmerman(1999). A capacitance standard based on counting clectrons.Science, 285, pp. 1706-1709.
Keller, M.W., F. Piquemal, N. Feltin, B. Steck, and L.Devoille (2008). Metrology triangle using a Watt bal-ance, a calculablecapacitor and a single-electron tunnel-ing device.Metrologia,45:3, pp. 330-334.
Elec-tron Counting CapacitanceStandard, ECCS-1. Metrolo-gia, 44:6, pp. 505-512.
Likharev, K.K. and A.B. Zorin (1985). Theory of theBloch-wave oscillations in small Josephson junctions. Jour-nalof Low Temperature Physics, 59, pp. 347-382.
Lotkhov, S.V., S.A. Bogoslovsky, A.B. Zorin, and J.Niemeyer (2001). Operation of a three-junction single-electron pumpwith on-chip resistors. Applied Physics Letters, 78:7, pp.946-948.
Mills, I.M., P.J. Mohr, T.J. Quinn, B.N. Taylor, and E.R. Williams(2006). Redefinition of the kilogram, ampere, kelvin and mole: aproposed approach to implementing CIPM Recommendation 1 (CI-2005).Metrologia, 43:3, pp. 227-246.
Mohr, P.J., B.N. Taylor, and D.B. Newell (2008). CO-DATArecommended values of the fundamental physical constants: 2006.Review of Modern Physics, 80:2, pp. 633-730.
Piquemal, F. and G. Genevès (2000). Argument for adirect realization of the quantum metrological trian-gle.Metrologia, 37:3, pp. 207-211.
Steck, B.et al. (2008). Characterization andmetrological investigation of an R-pump with driving frequencies up to100 MHz.Metrologia, 45:4, pp. 482-491.