Corresponding Author: Department of Civil Engineering, Universiti Putra Malaysia (UPM), 43400 Serdang, Selangor, Malaysia. Tel: 603-89466459, Fax: 603-86567129
1
Helmi Z.M. Shafri and
2Paul M. Mather
1
Department of Civil Engineering,
Universiti Putra Malaysia, (UPM), 43400 Serdang, Selangor, Malaysia
2
Geographic Information Science Research,
the University of Nottingham, NG7 2RD Nottingham, UK
Abstract: It is common in hyperspectral remote sensing studies to perform analysis based on derivative spectroscopy. However, this technique is particularly sensitive to noise in the data. Thus, noise removal is essential before any derivative analysis. Various methods of noise removal are described in the literature. A newly developed method based on the wavelet transform appears promising, though there is little practical guidance on its use. In this study, the investigation of several important parameters that govern Wavelet-Based Denoising (WBD) is undertaken. The optimal parameter settings are then evaluated for use in spectral analysis using field Spectroradiometer hyperspectral data.
Key words: Wavelets, denoising, hyperspectral
INTRODUCTION
Several methods have been used to smooth noisy signals, including the Fourier transform, the Savitzky-Golay local polynomial, the mean filter, Gaussian functions, and so on. However, these methods have characteristics that could reduce their effectiveness in dealing with noisy signals. In recent years, a new method known as wavelet shrinkage has been introduced to the scientific community. It is said to offer a more efficient and statistically rigorous approach to signal processing. Among the advantages of the wavelet shrinkage method is that it can be used to reduce the level of noise while preserving the significant features of the original data[1]. However, practical guidance on the use of the wavelet-based denoising is hard to find[2] and the use of wavelet transform in the analysis of hyperspectral data is very limited[3].
MATERIALS AND METHODS
Wavelet-based denoising (WBD): The aim of WBD methods is to recover a true signal f from an observation vector
y
i measured at n equally spaced pointst
i, with additive noiseεi
. The value of n(number of observations) is assumed to be the power of two. For signals not to the power-of-two sizes, zeroes are added to the one or both ends of the signal until the power-of-two size is achieved.
( )
f
yi= ti + εi, i = 1,2,…..n (1)
(Adapted from[4]).
The WBD procedure involves three major steps: forward transformation of the signal to the wavelet domain, wavelet coefficient reduction and transformation of the wavelet coefficients back to the original signal domain[5,6]. Several fundamental decisions have to be made regarding: the selection of the value of the threshold (t) to distinguish signal and noise, the mother wavelet and the choice of thresholding method, as well as the optimal resolution level or scale for diagnosing.
For a data series of length n the first level (n/2) detail coefficients are selected. The median absolute deviation (MAD) is calculated by (i) determining the median of the absolute values of the n/2 selected detail coefficients (MED1) and (ii) the median of the absolute deviations (MAD) from MED1. Following[7], a Universal Threshold t is defined as
t= 2log(n)MAD / 0.6745 (2)
where n is the data series length. This method adopts the ‘global’ thresholding principle in which one constant threshold value is used for all coefficients across all levels.
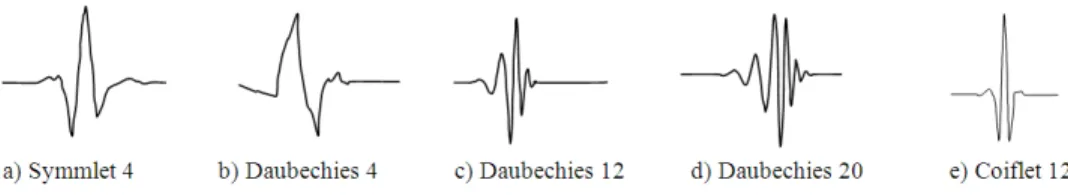
Fig. 1: The mother wavelets used in this study
Users of the wavelet transform must specify in advance the nature of the filter functions that are to be used. These functions are known as ‘mother wavelets’, and they differ in terms of their symmetry and smoothing properties. The synthetic data were used to assess the effects of the use of a range of different mother wavelets (Daubechies 4, Daubechies 12, Daubechies 20, Coiflet 12, and Symmlet 4). The experience gained from these experiments allowed the specification of a number of guidelines, which were then used in noise removal and derivative analysis of the field and airborne spectroscopy data. Figure1 shows the shapes of the mother wavelets investigated in this study.
A second analysis investigated the properties of two different methods of noise thresholding, known as hard and soft thresholding. Thresholding is a way of subdividing the wavelet coefficients into two sets, one of which represents information while the other represents noise. Noise is associated with the coefficients with values less than the threshold. They are assumed to contain no important information. The denoised signal is constructed from the remaining wavelet coefficients. Soft and hard thresholding are the most widely used methods proposed for this purpose. In hard thresholding, the wavelet coefficients are compared to the value of the threshold. Then, all the coefficients that are smaller than the absolute threshold are eliminated or suppressed to zero. The other wavelet coefficients are left unchanged.
Thirdly, as the wavelet transform is hierarchical in nature, the effects of noise estimation using different levels of resolution were considered. The resolution level is also known as the decomposition level or scale. It refers to the level beyond which the wavelet thresholding is applied. For a discrete signal with finite length 2M, the maximum number of decomposition level that can be investigated is M[8]. At each decomposition level, a signal is decomposed into approximation coefficients and detail coefficients. The approximation signal is then iteratively processed over a number of stages specified. The highest or finest resolution level contains most of the high frequencies in the signal and the coarsest resolution contains the average of the signal.
RESULTS AND DISCUSSION
In this analysis, Walker Error (WE) measure was employed. The WE measure was calculated by taking
the wavelet coefficients of the raw data (f) and the wavelet coefficients of the denoised data (g), computing the sum of the absolute differences between f and g, then dividing this sum by n, the number of wavelet coefficients[9].
WE = f g
n
−
∑
(3)
In this first part of the simulation study, the effects of the different mother wavelets are investigated. Hard thresholding and resolution level of eight were used as the constant parameters.
Effects of different wavelet bases: Figure 2 shows the mean WE values for three noise levels using different wavelets in denoising the contaminated sine wave. The mean WE increase as the noise level increases for all the wavelets. In general, Daubechies 20 wavelet gives the lowest WE while Symmlet 4 wavelet gives the highest WE.
Effects of different thresholding types: After gaining some idea of the most suitable wavelet, the user next has to determine whether to use soft or hard thresholding. This section presents the results of an investigation of the influence of hard and soft thresholding on the denoising result. Daubechies 20 was used as the mother wavelet on the basis of results reported in the preceding section, and a resolution level of eight was chosen. The performance of the hard and soft threshold techniques was investigated for a range of noise levels.
Figure 3 shows the mean RMSE and mean WE for the hard and soft thresholding for different noise levels using the Daubechies 20 wavelet. The WE increases as the noise level increases for both hard and soft thresholding, but the values of the mean WE using hard thresholding are significantly lower than using soft thresholding.
Fig. 2: Mean WE against different noise levels (0%, 15% and 30%) for the different mother wavelets
Fig. 3: Mean WE of hard and soft thresholding for different noise levels using Daubechies 20 wavelet
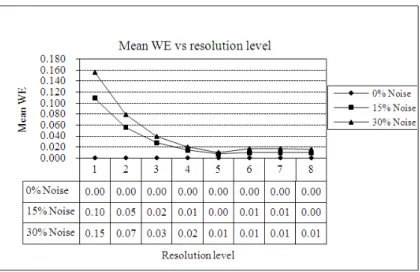
The constant parameters are the Daubechies 20 and hard thresholding for the different noise levels. The length of the signal is 1024 points, which means that it has 10 decomposition levels (from 210 = 1024). However, only levels one to eight are evaluated to avoid denoising too much into the coarser levels.
Figure 4 shows the trend of the WE with respect to different resolution levels. In general, the WE decrease as the resolution level increases. The lowest error is achieved at the resolution level of five, then the error begins to rise again but only slightly. This indicates that, in general, if an optimal resolution level is used, the best denoising result can be obtained (i.e. at resolution level of five).
Application to field spectroscopy data: The field spectroscopy data used in this study were acquired from the La Mancha, Spain study site collected by using an ASD field Spectroradiometer. This instrument has a very high spectral resolution and a spectral sampling interval of 1 nm after processing to reflectance. A green vegetation spectrum obtained by field measurement
using the ASD instrument and its first derivative spectrum is shown as in Fig. 5. The first derivative spectrum is significantly noisy which indicates that the reflectance spectrum itself is inherently noisy. Since the ‘clean’ spectrum is unknown, assessment of the quality of the denoised or smoothed data and the resulting first derivative curves is subjective and based on a visual assessment only.
Fig. 4: Mean WE against resolution level for different noise levels
Fig. 5: A green vegetation spectrum from the ASD spectral library in the range of 0.350 to 0.861 µ m (left) and its noisy first derivative spectrum (right)
Fig. 6: The wavelet-based denoised green vegetation spectrum (left) and its first derivative (right). Pseudo-Gibbs phenomena are seen at the ends of the derivative spectrum
The first derivative spectrum derived from the denoised data is more easily interpreted than the equivalent first derivative curve derived from raw data. However, the WBD method suffers from the introduction of pseudo-Gibbs phenomena[11] at the end points of the spectrum,
interpretable derivative spectrum.
CONCLUSION
The WBD procedure is able to reduce the amount of noise and help to extract important features from the first derivative analysis. However, the major concern brought out in this paper is the presence of ripples (the pseudo-Gibbs phenomenon) that are introduced into the derivative spectrum by the application of the WBD method. The following guidelines for the use of the wavelet-based denoising technique is suggested;
Mother wavelet: the longer the wavelet filter vector the smoother will be the output. The selection of the mother wavelet should also depend on the properties of the input signal and on the desired outcome, Thresholding type: it was found that hard thresholding performs better than soft thresholding, Resolution level: the decomposition level at which denoising is applied should be moderate.
Proper treatment of the boundary problem is also required; otherwise the pseudo-Gibbs phenomenon
will affect the usability of the results. How the ripples affect the entire first derivative spectrum is unknown but their presence are certainly quite disturbing if one’s aim is to obtain a smooth derivative analysis. An elegant way to overcome this problem is to use more sophisticated procedures to deal with the pseudo-Gibbs and boundary problems. The ability to effectively remove noise from hyperspectral data will facilitate advanced analysis to be carried out on hyperspectral data such as spectral derivative technique. This will open up new possibilities for the modeling, assessment and analysis of remote sensing data in many agricultural, environmental and engineering applications.
ACKNOWLEDGEMENT
The authors would like to thank NERC-EPFS UK for the loan of the ASD Spectroradiometer equipment for the field spectroscopy measurement in La Mancha, Spain.
Chemometrics and Intelligent Laboratory Systems,
49: 151-161.
2. Horgan, G., 1998. Wavelets for SAR image smoothing. Photogrammetric Engineering and Remote Sensing,64: 1171-1177.
3. Bruce, L.M., C. Morgan and S. Larsen, 2001. Automated detection of subpixel hyperspectral targets with continuous and discrete wavelet transforms. IEEE Trans. Geosci. Remote Sensing,
39: 2217-2226.
4. Kovac, A. and B.W. Silverman, 2000. Extending the scope of wavelet regression methods by coefficient-dependent thresholding. J. Am. Stat. Assoc.,95: 172-183.
5. Donoho, D.L. and I.M. Johnstone, 1994. Ideal spatial adaptation by wavelet shrinkage. Biometrika,81: 425-455.
6. Taswell, C., 2000. The what, how and why of wavelet shrinkage denoising. Computing in Science and Engineering, 2: 12-19.
7. Donoho, D. L., 1995. Denoising by soft-thresholding. IEEE Transactions on Information Theory,41: 613-627.
8. Addison, P. S., 2002. The Illustrated Wavelet Transform Handbook. IOP Publishing, pp: 78. 9. Walker, J. S., 1999. A Primer on Wavelets and
their Scientific Applications. CRC Press, pp: 82-83.
10. Loizides, M., 1996. Wavelets theory and applications in signal and image processing. M.Sc. Thesis, The University of Manchester Institute of Science and Technology.