Radiographic evaluation of orthodontic treatment by means of four
different cephalometric superimposition methods
Marcos Augusto Lenza1, Adilson Alves de Carvalho2, Eduardo Beaton Lenza2, Mauricio Guilherme Lenza2, Hianne Miranda de Torres3, João Batista de Souza4
How to cite this article: Lenza MA, Carvalho AA, Lenza EB, Lenza MG, Torres HM, Souza JB. Radiographic evaluation of orthodontic treatment by means of four different cephalometric superimposition methods. Dental Press J Orthod. 2015 May-June;20(3):29-36. DOI: http://dx.doi.org/10.1590/2176-9451.20.3.029-036.oar
Submitted: November 19, 2013 Revised and accepted: August 03, 2014
Contact address: Marcos Augusto Lenza
Al. Americano do Brasil, 904 Setor Marista - CEP: 74180-010 Goiânia, Goiás - Brazil
E-mail: [email protected]
1 Full professor, Universidade Federal de Goiás (UFG), School of Dentistry,
Goiânia, Goiás, Brazil.
2 Professor, Faculdades Unidas do Norte de Minas (FUNORTE)/Instituto Lenza
de Pós-Graduação, Postgraduate program in Orthodontics, Goiânia, Goiás, Brazil.
3 PhD resident in Clinical Dentistry, Universidade Federal de Goiás (UFG),
School of Dentistry, Goiânia, Goiás, Brazil.
4 Associate professor, Universidade Federal de Goiás (UFG), School of Dentistry,
Goiânia, Goiás, Brazil.
» The authors report no commercial, proprietary or financial interest in the prod-ucts or companies described in this article.
DOI: http://dx.doi.org/10.1590/2176-9451.20.3.029-036.oar
Introduction: Despite discussion on the merit of various cephalometric superimposition methods, there remains a need to assess which one can be used in daily practice with reasonably accuracy and less working time. Objective: The aim of this study was to investigate four methods of cephalometric superimposition by means of assessing the longitudinal changes in craniofacial morphology caused by growth and response of adolescents with Class I malocclusion to orthodontic treatment involving first premolar extraction.
Methods: Pretreatment (T1) and post-treatment (T2) standardized lateral cephalometric radiographs of 31 adolescents (20 females and 11 males), with Angle Class I malocclusion and indication of premolar extraction, participated in this study. Radiographs were digitized, traced and had structures identified by means of a cephalometric software. Four superimposition methods were used: Björk structural method, Steiner/Tweed SN line, Ricketts N-Ba line at N-point and Ricketts N-Ba line at CC-point. Positional changes were quantified by horizontal and vertical linear changes in the following cephalometric landmarks: anterior/posterior nasal spine (ANS and PNS), gnathion (Gn), Gonion (Go), Pogonion (Pog), A-point and B-point. Differences between T1 and T2 in horizontal and vertical positional changes for all superimposition methods were assessed by one-way analysis of variance (ANOVA) and Bon-ferroni correction (p < 0.05). Results: There were no statistically significant differences among the cephalometric superimposition methods or when patients’ sex was considered. Conclusion: Björk structural method, Steiner/Tweed SN line, Ricketts N-Ba line at N-point and Ricketts N-Ba line at CC-point methods were reliable and presented similar precision when the overall facial changes due to active growth and/or orthodontic treatment were examined.
Keywords:Orthodontics. Growth. Radiology.
Introdução: apesar dos debates sobre os méritos dos vários métodos de sobreposição cefalométrica, ainda há necessidade de se avaliar quais deles poderiam ser utilizados na prática diária, com razoável precisão e menor tempo de trabalho. Objetivo: o objetivo desta pesquisa foi investigar quatro métodos de sobreposição cefalométrica, avaliando as mudanças longitudinais na morfologia craniofacial causadas pelo cres-cimento e resposta ao tratamento, em adolescentes com má oclusão de Classe I tratados ortodonticamente com extração de primeiros pré--molares. Métodos: foram usadas telerradiografias laterais pré-tratamento (T1) e pós-tratamento (T2) de 31 adolescentes (20 do sexo femini-no e 11 do sexo masculifemini-no), com Classe I de Angle e indicação de extração de pré-molares. As radiografias foram digitalizadas, traçadas e as estruturas, identificadas com um software cefalométrico (Radiocef, Radio Memory, Belo Horizonte, Brasil). Quatro métodos de sobreposição foram utilizados para avaliar mudanças de posição devidas ao crescimento e/ou tratamento: método Estrutural de Björk; método Steiner/ Tweed linha SN; Ricketts linha N-Ba no ponto N; e Ricketts linha N-Ba no ponto CC. As mudanças posicionais avaliadas pelos métodos de sobreposição foram quantificadas por mudanças lineares horizontais e verticais nos seguintes pontos cefalométricos: espinha nasal anterior (ENA), espinha nasal posterior (ENP), gnátio (Gn), Gônio (Go), Pogônio (Pog), Ponto A e Ponto B. Mudanças de posição horizontal e ver-tical entre T1 e T2 para todos os métodos de sobreposição foram avaliadas por análise de variância (ANOVA) e teste de Bonferroni (p < 0,05).
Resultados: não houve diferença estatística significativa entre os métodos de sobreposição cefalométrica em toda a amostra ou quando o sexo dos pacientes foi considerado. Conclusão: de acordo com a metodologia aplicada nesse estudo, os métodos de sobreposição cefalométrica Estrutural de Björk, de Steiner/Tweed linha SN, Ricketts linha N-Ba no ponto N e de Ricketts linha N-Ba no ponto CC foram confiáveis e com precisão semelhante para examinar as alterações faciais globais devidas ao crescimento ativo e/ou tratamento ortodôntico.
INTRODUCTION
The need to visualize and understand the behavior of craniofacial structures in response to orthodontic treatment and continuous growth and development has motivated the emergence of several cephalometric superimposition techniques.1-6 Different anatomical structures, cephalometric landmarks, lines and planes of reference have been used for this purpose, allowing quantitative analysis of growth and treatment based on changes of the facial skeleton of a particular indi-vidual over a period of time.7-11
Cephalometric superimposition is of great im-portance when assessing orthodontic-orthope-dic treatment response and orthognathic surgery outcomes.11-14 Pretreatment and post-treatment ceph-alometric tracings should be carefully superimposed in order to provide reliable assessment of orthodontic/ growth structural changes.13 Longitudinal changes in craniofacial morphology caused by growth and treat-ment response can be measured by superimposing a series of lateral cephalograms, using relatively stable landmarks, such as cranial base, cranial points, lines or regional contours, as reference.15
Several superimposition methods have been de-scribed in the literature. Björk and Skieller4,5 state-of-the-art structural superimposition method based on Björk implant studies on craniofacial growth has been used widely. Superimposition is made on speciic ana-tomical bone structures. This method, however, relies on the quality of the radiograph, particularly with re-gard to optimal contrast and density. Steiner/Tweed SN line method,2 Ricketts6 N-Ba line at N-point and Ricketts N-Ba line at CC-point methods have also been described in the literature. Superimposition on the cranial base provides an overall assessment of growth and treatment changes of facial structures. It will not identify speciic sites of growth, but will aid assessment of the amount and direction of maxillary and mandibular growth, as well as the overall displace-ment of teeth and associated sot tissue changes.
Superimposition methods have revealed deficien-cies or difficulties in comparison to others.16,17 Some studies9,18 demonstrate inaccuracy of cephalometric superimposition methods; while others13,19,20 suggest the use of more than one method in order to increase the procedure reliability, provide additional informa-tion and make it possible to assess sagittal skeletal and
dental changes more accurately. Although some prac-titioners may opt to do so, it is time consuming and may not be ideal in private settings. Nevertheless, this is not to suggest that cephalometric superimposition is not a useful measurement tool used to assess the extent of dentofacial changes. Rather, studies13,16,17 indicate that it may be used with sufficient degree of accuracy for clinical diagnosis and treatment.
The most significant limitation of cephalometric superimposition is that three-dimensional changes are measured in two dimensions. The advent of cone-beam computed tomography has provided new insights of three-dimensional changes induced by normal growth and orthodontic treatment. Will it be the substitute for the traditional superimposi-tion methods used today? Nevertheless, the present emphasis on minimizing radiation exposure prevents the use of such diagnosis resource on routine conven-tional orthodontic practice.21,22
Which superimposition method is best suited to assess changes caused by growth and/or orthodontic treatment response? Are superimposition methods equally accurate and reliable? The aim of this study was to assess four different methods of cephalometric superimposition by means of examining the results of Angle Class I treatment of growing individuals treated with upper and lower premolar extractions.
MATERIAL AND METHODS
The present study was approved by Universidade Federal de Goiás Institutional Review Board under protocol number 055/2007.
Sample selection
This retrospective observational study was con-ducted on pre (T1) and post (T2) treatment standard-ized lateral cephalometric radiographs of 31 ado-lescents (20 females and 11 males) with mean age of 13 years and 4 months at T1 and 17 years and 6 months at T2. Radiographs were obtained from the archives of Universidade Federal de Goiás, School of Dentistry, postgraduate program in Orthodontics.
lateral cephalometric radiographs at the beginning and end of treatment, which allowed clear visualiza-tion of dentoskeletal structures, soft tissue and facial contour, were included. These individuals did not present any systemic conditions that could hinder the results of the study.
Cephalometric superimposition analysis
All pre and post-treatment lateral cephalometric ra-diographs were digitized with a resolution of 150 dpi by means of a latbed scanner (Hewlett-Packard Com-pany, Palo Alto, Ca, USA) attached to a transparency reader. Images were saved in TIFF format. Each ceph-alogram was traced and all anatomical structures nec-essary for the superimposition methods were identiied (Fig 1). Both tracing and superimposition procedures were performed by the same operator. Data were col-lected by means of Radiocef Studio 2.0 cephalometric sotware (Radiomemory, Belo Horizonte, Brazil).
Four superimposition methods were used to assess the positional changes caused by orthodontic treat-ment and associated growth, taking into account the stability of reference points, as well as their precision and visualization, and ease of the method:
• Björk structural method (M1): radiographs were superimposed on the reference bone structures in the anterior cranial base, as described by Björk and Ski-eller.4,5 Anterior contour of sella turcica wall, anterior contour of the median cranial fossa, the mean inter-section point of the lower contours of the anterior cli-noid processes, the inner surface of the frontal bone, contour of the cribriform plate, contours of the bi-lateral frontoethmoidal crests and contour of the me-dian border of cerebral surfaces of the orbital roofs.
• Steiner/Tweed SN line method2,3 (M2): radio-graphs were superimposed on the SN line with regis-tration at the S-point.
• Ricketts N-Ba line at N-point method6 (M3): radiographs were superimposed on the N-Ba line with registration at the N-point.
• Ricketts N-Ba line at CC-point method6 (M4): radiographs were superimposed on the N-Ba line with registration at the CC-point (center of the cra-nium) where the Ba-N plane intersects the Ptm-gna-thion line.
The positional changes assessed by the superimposi-tion methods were quantiied on the basis of horizontal
and vertical linear changes in the following cephalo-metric landmarks: anterior nasal spine (ANS), poste-rior nasal spine (PNS), gnathion (Gn), gonion (Go), pogonion (Pog), A-point and B-point; following the criteria described by Baumrind and Frantz.7,8,9
Post-treatment tracings were then superimposed on pre-treatment ones so as to quantify the horizon-tal and vertical positional changes according to each superimposition method. Vertical alterations were measured in millimeters with a line perpendicular to Frankfort horizontal plane (FHP), whereas hori-zontal alterations were also measured in millime-ters with a horizontal line perpendicular to Nasion (Nperp) (Fig 2). Seven horizontal measurements (ANS-Nperp, A-Nperp, PNS-Nperp, B-Nperp, Pog-Nperp, Gn-Nperp, Go-Nperp) were calculated to compare the displacement (expressed in milli-meters) of the cephalometric landmarks assessed by Björk structural, Steiner/Tweed SN line, Ricketts N-Ba line at N-point and Ricketts N-Ba line at CC-point superimposition methods. Seven vertical mea-surements (ANS-FHP, A-FHP, PNS-FHP, B-FHP, Pog-FHP, Gn-FHP, Go-FHP) were also calculated.
A reference coordinate system was established for pre and post-treatment cephalometric radiographs. For the vertical measurements obtained by a line perpen-dicular to the Frankfort horizontal plane, the X-axis was used; all measurements below this axis were nega-tive while those above it were posinega-tive. For the hori-zontal measurements obtained by a line perpendicular to the nasion-perpendicular (Nperp) line, the Y-axis was used; all measurements to the let of this axis were negative while those to the right were positive.
Raw numbers were registered in an Excel spread-sheet for later statistical calculations. The positional change of each landmark was then compared within this coordinate system for each superimposition method.9 Pre and post-treatment differences deter-mined the horizontal and vertical linear changes of the cephalometric landmarks.
Error of the method
Figure 1 - Anatomical structures and reference cephalometric landmarks used in the study; 1. sella turcica, 2. nasal and frontal bones, 3. orbit, 4 . ex-ternal acoustic meatus, 5. maxilla, 6. mandible, 7. upper and lower central incisors, 8. upper and lower first molars, 9. soft tissue profile.
Figure 2 - Cephalometric landmarks: 1. S (sella), 2. N (nasion), 3. Po (porion),
4. Or (orbitale), 5. Ba (basion), 6. ANS (anterior nasal spine), 7. PNS (posterior nasal spine), 8. A-point, 9. B-point, 10. Pog (pogonion), 11. Gn (gnation),
12. Go (gonion). Cephalometric planes: NPerp (nasion-perpendicular) and FHP (Frankfort horizontal plane).
irst and second cephalometric measurements was deter-mined for each radiograph, and casual error calculated by Dahlberg23 formula: E2 = Σ d2/2n, in which “d” represents the diference between the values obtained in the irst and second measurements and “n” represents the number of cases in which measurements were repeated. Systematic error was calculated by paired t-test, according to Hous-ton.24 Signiicance level was set at P < 0.05.
Statistical analysis
Descriptive statistics (mean and standard deviation) were calculated for all measurements obtained by the superimposition methods in both observational periods. Paired t-test was used to assess the amount of displace-ment according to each superimposition method on pre and post-treatment cephalometric radiographs. Difer-ences in the amount of horizontal and vertical positional changes between T1 and T2 were assessed by one-way analysis of variance (ANOVA) and Bonferroni test for all superimposition methods. Data were analyzed by SPSS for Windows (SPSS 17.0, SPSS Inc, Chicago, III). Difer-ences were considered statistically signiicant at P < 0.05.
RESULTS
Changes caused by growth and/or orthodontic treat-ment, assessed by four cephalometric superimposition
methods, were quantiied by horizontal and vertical linear alterations in the following cephalometric land-marks: anterior nasal spine (ANS), posterior nasal spine (PNS), gnathion (Gn), gonion (Go), pogonion (Pog), A-point (subspinale) e B-point (supramentale). A total of seven horizontal and seven vertical measurements were carried out. The amount of positional changes was calculated by the diference between pre and post-treatment cephalometric measurements for each su-perimposition method.
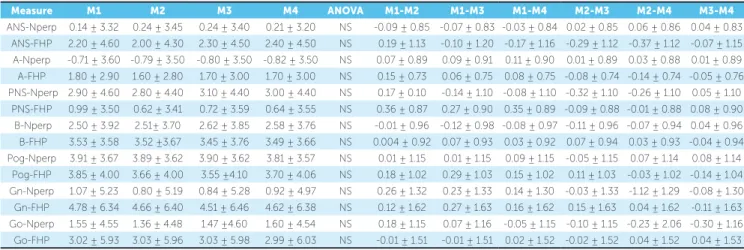
The calculated reliability coefficient for ex-aminer reliability was 0.97 for all measurements, which yields sufficient reliability. Tables 1, 2 and 3 present mean and standard deviation values (ex-pressed in millimeters) of horizontal and vertical differences between the cephalometric measure-ments (difference = final value (T2) - initial val-ue (T1)) of Björk structural (M1), Steiner/Tweed SN line (M2), Ricketts N-Ba line at N-point (M3) and Ricketts N-Ba line at CC-point (M4) superim-position methods for the whole sample, and com-pared according to individuals’ sex. Positive values mean that the cephalometric measurement at T2 was greater than T1 — that is, the cephalometric land-mark was further from the Nperp line (horizontal) or from Frankfort horizontal plane (vertical) at T2
Nperp line
1 1
5 5
3 Frankfort horizontal plane
3
7
7
4 4
8 8
9 10
11 12
9 9
9 9
2 2
6
Table 1 - Mean and standard deviation (in millimeters) of differences in horizontal (NPerp) and vertical (FHP) cephalometric measurements among Björk structural (M1), Steiner SN line (M2), Ricketts N-Ba line at N-point (M3) and Ricketts N-Ba at CC-point (M4) superimposition methods for the whole sample (n = 31).
Values = mean ± standard deviation. Student’s t-test. p < 0.05 ANOVA (one-way). Bonferroni. NS = nonsignificant.
Measure M1 M2 M3 M4 ANOVA M1-M2 M1-M3 M1-M4 M2-M3 M2-M4 M3-M4
ANS-Nperp 0.14 ± 3.32 0.24 ± 3.45 0.24 ± 3.40 0.21 ± 3.20 NS -0.09 ± 0.85 -0.07 ± 0.83 -0.03 ± 0.84 0.02 ± 0.85 0.06 ± 0.86 0.04 ± 0.83 ANS-FHP 2.20 ± 4.60 2.00 ± 4.30 2.30 ± 4.50 2.40 ± 4.50 NS 0.19 ± 1.13 -0.10 ± 1.20 -0.17 ± 1.16 -0.29 ± 1.12 -0.37 ± 1.12 -0.07 ± 1.15
A-Nperp -0.71 ± 3.60 -0.79 ± 3.50 -0.80 ± 3.50 -0.82 ± 3.50 NS 0.07 ± 0.89 0.09 ± 0.91 0.11 ± 0.90 0.01 ± 0.89 0.03 ± 0.88 0.01 ± 0.89 A-FHP 1.80 ± 2.90 1.60 ± 2.80 1.70 ± 3.00 1.70 ± 3.00 NS 0.15 ± 0.73 0.06 ± 0.75 0.08 ± 0.75 -0.08 ± 0.74 -0.14 ± 0.74 -0.05 ± 0.76 PNS-Nperp 2.90 ± 4.60 2.80 ± 4.40 3.10 ± 4.40 3.00 ± 4.40 NS 0.17 ± 0.10 -0.14 ± 1.10 -0.08 ± 1.10 -0.32 ± 1.10 -0.26 ± 1.10 0.05 ± 1.10
PNS-FHP 0.99 ± 3.50 0.62 ± 3.41 0.72 ± 3.59 0.64 ± 3.55 NS 0.36 ± 0.87 0.27 ± 0.90 0.35 ± 0.89 -0.09 ± 0.88 -0.01 ± 0.88 0.08 ± 0.90 B-Nperp 2.50 ± 3.92 2.51± 3.70 2.62 ± 3.85 2.58 ± 3.76 NS -0.01 ± 0.96 -0.12 ± 0.98 -0.08 ± 0.97 -0.11 ± 0.96 -0.07 ± 0.94 0.04 ± 0.96
B-FHP 3.53 ± 3.58 3.52 ±3.67 3.45 ± 3.76 3.49 ± 3.66 NS 0.004 ± 0.92 0.07 ± 0.93 0.03 ± 0.92 0.07 ± 0.94 0.03 ± 0.93 -0.04 ± 0.94 Pog-Nperp 3.91 ± 3.67 3.89 ± 3.62 3.90 ± 3.62 3.81 ± 3.57 NS 0.01 ± 1.15 0.01 ± 1.15 0.09 ± 1.15 -0.05 ± 1.15 0.07 ± 1.14 0.08 ± 1.14
Pog-FHP 3.85 ± 4.00 3.66 ± 4.00 3.55 ±4.10 3.70 ± 4.06 NS 0.18 ± 1.02 0.29 ± 1.03 0.15 ± 1.02 0.11 ± 1.03 -0.03 ± 1.02 -0.14 ± 1.04
Gn-Nperp 1.07 ± 5.23 0.80 ± 5.19 0.84 ± 5.28 0.92 ± 4.97 NS 0.26 ± 1.32 0.23 ± 1.33 0.14 ± 1.30 -0.03 ± 1.33 -1.12 ± 1.29 -0.08 ± 1.30 Gn-FHP 4.78 ± 6.34 4.66 ± 6.40 4.51 ± 6.46 4.62 ± 6.38 NS 0.12 ± 1.62 0.27 ± 1.63 0.16 ± 1.62 0.15 ± 1.63 0.04 ± 1.62 -0.11 ± 1.63 Go-Nperp 1.55 ± 4.55 1.36 ± 4.48 1.47 ±4.60 1.60 ± 4.54 NS 0.18 ± 1.15 0.07 ± 1.16 -0.05 ± 1.15 -0.10 ± 1.15 -0.23 ± 2.06 -0.30 ± 1.16
Go-FHP 3.02 ± 5.93 3.03 ± 5.96 3.03 ± 5.98 2.99 ± 6.03 NS -0.01 ± 1.51 -0.01 ± 1.51 0.02 ± 1.52 -0.02 ± 1.52 0.04 ± 1.52 0.04 ± 1.53
Table 2 - Mean and standard deviation (in millimeters) of differences in horizontal (NPerp) and vertical (FHP) cephalometric measurements among Björk struc-tural (M1), Steiner SN line (M2), Ricketts N-Ba line at N-point (M3) and Ricketts N-Ba at CC-point (M4) superimposition methods for females (n = 20).
Values = mean ± standard deviation. Student’s t-test. p < 0.05 ANOVA (one-way). Bonferroni. NS = nonsignificant.
Measure M1 M2 M3 M4 ANOVA M1-M2 M1-M3 M1-M4 M2-M3 M2-M4 M3-M4
ANS-Nperp -0.58 ± 3.28 -0.53 ± 3.29 -0.53 ± 3.30 -0.45 ± 3.20 NS -0.05 ± 1.04 -0.13 ± 1.02 -0.03 ± 1.03 -0.08 ± 1.00 0.01 ± 1.04 0.11 ± 1.00 ANS-FHP 1.20 ± 4.22 1.14 ± 4.18 1.08 ± 4.19 1.16 ± 4.24 NS 0.05 ± 1.33 0.11 ± 1.30 0.03 ± 1.34 0.05 ± 1.32 -0.02 ± 1.33 -0.08 ± 1.33
A-Nperp -1.20 ± 3.70 -1.20 ± 3.60 -1.10 ± 3.60 -1.10 ± 3.60 NS 0.03 ± 1.10 -0.04 ± 1.10 -0.03 ± 1.10 -0.07 ± 1.10 -0.06 ± 1.10 0.01 ± 1.10
A-FHP 1.50 ±2.90 1.60 ± 2.80 1.50 ± 2.90 1.50 ± 2.90 NS -0.07 ± 0.90 0.07 ± 0.90 -0.02 ± 0.91 0.14 ± 0.90 0.06 ± 0.91 -0.07 ± 0.91 PNS-Nperp 2.30 ± 4.40 2.30 ± 4.40 2.30 ± 4.30 2.10 ± 4.30 NS 0.02 ± 1.40 0.05 ± 1.40 0.17 ± 1.34 0.03 ± 1.40 0.14 ± 1.40 0.11 ± 1.40
PNS-FHP 0.51± 2.87 0.43 ± 2.75 0.44 ± 3.01 0.30 ± 2.92 NS 0.06 ± 0.90 0.04 ± 0.84 0.05 ± 0.89 -0.01 ± 0.89 -0.05 ± 0.89 0.01 ± 0.89 B-Nperp 3.28 ± 2.88 3.22 ± 2.79 3.24± 2.84 3.23 ± 2.84 NS 0.06 ± 0.89 0.04 ± 0.90 0.05 ± 0.92 -0.01 ± 0.88 -0.05 ± 0.89 0.01 ± 0.85 B-FHP 3.71±3.11 3.73 ± 3.08 3.68 ± 3.20 3.73 ± 3.08 NS -0.02 ± 0.97 0.03 ± 0.99 -0.01 ± 0.97 0.05 ± 0.99 0.05 ± 0.97 -0.04 ± 0.99
Pog-Nperp 3.91± 3.67 3.89 ± 3.62 3.90 ± 3.62 3.81 ±3.57 NS 0.01 ± 1.15 0.01 ± 1.12 -0.02 ± 1.10 0.07 ± 1.14 0.26 ± 1.29 0.08 ± 1.14 Pog-FHP 3.17 ± 4.23 3.16 ± 4.19 3.08 ± 4.26 3.16 ± 4.22 NS 0.006 ± 1.33 0.08 ± 1.34 0.004 ± 1.33 0.07 ± 1.34 -0.02 ± 1.33 -0.08 ± 1.34 Gn-Nperp 1.97 ±5.27 1.68 ± 5.23 1.64 ± 5.37 1.61 ± 4.95 NS 0.28 ± 1.66 0.32 ± 1.68 0.36 ± 1.62 0.03 ± 1.68 0.07 ± 1.61 0.03 ± 1.63
Gn-FHP 2.99 ± 4.79 3.05 ± 4.86 2.83 ± 4.87 3.00 ± 4.78 NS -0.06 ± 1.53 -0.16 ± 1.50 -0.01 ± 1.51 0.22 ± 3.34 0.05 ± 1.53 -0.17 ± 1.53 Go-Nperp 2.25 ± 4.43 2.21 ± 4.36 2.18 ± 4.46 2.38 ± 4.27 NS 0.04 ± 1.38 0.06 ± 1.41 -0.13 ± 1.38 0.02 ± 1.40 -0.17 ± 1.36 -0.02 ± 1.38
Go-FHP 1.48 ± 4.97 1.51 ± 5.09 1.48 ± 5.09 1.42 ± 5.16 NS -0.02 ± 1.59 -0.07 ± 1.59 0.05 ± 1.60 0.02 ± 1.61 0.08 ± 1.62 0.06 ± 1.62
Table 3 - Mean and standard deviation (in millimeters) of differences in horizontal (NPerp) and vertical (FHP) cephalometric measurements among Björk struc-tural (M1), Steiner SN line (M2), Ricketts N-Ba line at N-point (M3) and Ricketts N-Ba at CC-point (M4) superimposition methods for males (n = 11).
Values = mean ± standard deviation. Student’s t-test. p < 0.05 ANOVA (one-way). Bonferroni. NS = nonsignificant.
Measure M1 M2 M3 M4 ANOVA M1-M2 M1-M3 M1-M4 M2-M3 M2-M4 M3-M4
ANS-Nperp 1.70± 3.90 1.30 ± 3.80 1.40 ± 3.80 1.30 ± 3.60 NS 0.32 ± 1.64 0.26 ± 1.64 0.36 ± 1.61 -0.06 ± 1.62 0.03 ± 1.58 0.09 ± 1.59 ANS-FHP 1.46 ± 3.10 1.65 ± 3.41 1.41 ± 3.13 1.49 ± 3.18 NS -0.18 ± 1.39 0.05 ± 1.33 -0.02 ± 1.34 0.23 ± 1.40 1.49 ± 0.95 -0.08 ± 1.35
A-Nperp 0.09 ± 3.55 -0.05 ± 3.26 -0.23 ±3.53 -0.26 ± 3.45 NS 0.15 ± 1.45 0.33 ± 1.51 0.36 ± 1.49 0.17 ± 1.45 0.20 ± 1.43 0.02 ± 1.49 A-FHP 2.12 ± 3.18 1.57 ± 2.99 2.08 ± 3.38 2.09 ± 3.20 NS 0.54 ± 1.32 0.04 ± 1.40 0.02 ± 1.36 -0.50 ± 1.36 -0.53 ± 1.38 -0.02 ± 1.40 PNS-Nperp 4.05± 4.90 3.60 ± 4.30 4.55 ± 4.31 4.60 ± 4.37 NS 0.45 ± 1.97 -0.49 ± 1.97 -0.55 ± 1.98 -0.95 ± 1.83 -1.00 ± 1.85 -0.05 ± 1.89
PNS-FHP 1.73 ± 4.26 0.90 ± 4.31 1.14 ± 4.38 1.17 ± 4.38 NS 0.82 ± 1.75 0.590 ± 1.76 0.55 ± 1.76 0.23 ± 1.77 -0.26 ± 1.77 -0.03 ± 1.79 B-Nperp 1.07 ± 5.22 1.22 ± 4.84 1.51 ± 5.21 1.41 ± 4.97 NS -0.14 ± 2.15 -0.43 ± 2.22 -0.34 ± 2.17 -0.28 ± 2.14 -0.19 ± 2.09 0.09 ± 2.17 B-FHP 3.19 ± 4.45 3.14 ±4.70 3.02 ± 4.75 3.06 ± 4.68 NS 0.04 ± 1.95 0.16 ± 1.96 0.13 ± 1.95 0.11 ± 2.01 0.08 ± 2.00 -0.03 ± 2.05
Pog-Nperp -0.56± 4.96 -0.79 ± 4.94 -0.61 ± 5.01 -0.30 ± 5.01 NS -0.82 ± 2.38 -1.00 ± 2.40 -1.03 ± 2.34 -0.21 ± 2.25 -0.22 ± 2.22 -0.02 ± 2.24 Pog-FHP 8.04 ± 7.66 7.58 ± 7.96 7.56 ± 8.01 7.57 ± 7.99 NS 0.51 ± 1.51 0.68 ± 1.54 0.42 ± 1.52 0.17 ± 1.60 -0.09 ± 1.58 -0.27 ± 1.61
Gn-Nperp 0.26± 4.69 -1.16 ± 4.50 0.17 ± 4.75 0.17 ± 4.87 NS 0.83 ± 3.70 1.07 ± 3.48 1.02 ± 3.51 0.24 ± 0.93 0.18 ± 0.94 -0.05 ± 0.34 Gn-FHP 8.04 ± 7.66 7.58 ± 9.96 7.56 ± 8.01 7.57 ± 7.99 NS 0.23 ± 2.11 0.23 ± 2.13 -0.25 ± 2.13 -0.17 ± 2.12 -0.48 ± 2.10 0.05 ± 3.41 Go-Nperp 0.26 ± 4.69 -0.16 ± 4.50 0.17 ± 4.75 0.17 ± 4.87 NS -0.41 ± 1.38 0.02 ± 0.31 -0.05 ± 0.45 0.43 ± 1.34 0.35 ± 1.49 -0.30 ± 2.14
in comparison to T1. Negative values mean that the cephalometric measurement at T2 was lower than T1 — that is, the cephalometric landmark is closer to the Nperp line (horizontal) or to Frankfort hori-zontal plane (vertical) at T2 in comparison to T1.
One-way analysis of variance (ANOVA) and Bonferroni test were used to assess the mean val-ues of each variable and, thus, indicate the positional change of all cephalometric landmarks according to each superimposition method. Paired t-test was used to assess the amount of displacement for every two superimposition methods over pre and post-treat-ment differences. Significance level was set at 5%.
Comparison among Björk structural, Steiner SN line, Ricketts N-Ba line at N-point and Ricketts N-Ba line at CC-point superimposition methods, with regard to positional horizontal and vertical linear changes from the cephalometric landmarks anterior nasal spine (ANS), posterior nasal spine (PNS), gnathion (Gn), gonion (Go), pogonion (Pog), A-point, B-point to NPerp line and Frank-fort horizontal plane, demonstrated no statistically significant difference (P > 0.05) among the four methods of cephalometric superimposition for any one of the measurements investigated in the whole group or when individual’s sex was considered.
DISCUSSION
Serial radiographic cephalometry has been used since it was simultaneously but independently dis-covered by Hofrath25 and Broadbent26 in 1931, as a means of measuring craniofacial changes caused by growth and/or treatment. However, its clinical appli-cation resulted in confusion and misunderstanding. For this reason, accuracy of cephalometric mea-surements has always been questioned. Validity and reliability of superimposition methods have been a source of research of different studies9,18 investi-gating the magnitude of superimposition errors and the extent of potential positional changes of facial structures.27
The principle behind cephalometric superimpo-sition is to compare radiographs taken at different time intervals, most often pre and post-treatment or even longer, in which radiographs taken years post-retention are included. This comparison pro-vides the orthodontist with a general overview of
growth and/or treatment outcomes through changes of the facial skeleton by comparing linear and angu-lar measurements on serial cephalograms of the same patient. However, lateral cephalometric radiographs taken at different time intervals and by different op-erators are difficult to reproduce with a satisfactory degree of accuracy.
Positional changes of the anatomical structures caused by growth and/or treatment are studied by means of cephalometric radiographs superimposed to one another on structures that are considered sta-ble over a period of time. Broadbent1 was the first to publish a technique for superimposition of suc-cessive cephalometric films which demonstrated a child’s facial growth. Traditionally, the method of best fit has been used, meaning that bone structures that apparently do not change over time are used. It was thought that superimposition of such structures allowed growth and/or treatment changes in other skeletal structures to be demonstrated. Anterior cra-nial base superimposition proposed by De Coster28 was based on that principle.
Other superimposition methods have been pro-posed. Simpler methods based on two or three easily identified cephalometric landmarks have been used. Thus, the sella-nasion line, with sella as the register-ing landmark, was proposed as an ideal superimposi-tion method by Steiner2 and Tweed3. However, this method implies that sella is stable and that an increase in the SN line would be due to positional changes of the nasion. Ricketts6 developed a superimposi-tion method based on the posterior region of the cra-nial base and the nasion-basion line, reasoning that growth of the spheno-occipital synchondrosis would play an important role until the end of puberty. Melsen29 found that sella is not stable during growth due to remodeling of the fossa. In addition, the author found that nasion and basion changed considerably in position, direction and the amount of growth, which made them unreliable structures on which cephalo-metric superimposition could be based.
Perhaps the most important limitation of tra-ditional cephalometric radiographic measurement is that three-dimensional changes are measured in only two dimensions. Cone-beam computed to-mography certainly offers new knowledge on the changes caused by growth and/or orthodontic treat-ment. However, the present emphasis on mini-mizing radiation exposure still prevents the use of this new diagnostic modality on a routine basis in Orthodontics.15,16
Cephalometric superimposition has evoked much confusion and controversy.30 Basically, all meth-ods of superimposition have been used through the years whereby landmarks and lines, which serve as the registration points and guides to orient images, were traced. Most often double images of bilateral structures are not consistent in serial cephalometric radiographs due to head positioning; for this reason, anatomical or structural landmarks are not consis-tently identifiable. Thus, different superimposition methods have different degrees of accuracy. Each one of these methods has specific limitations associ-ated with the error of the method.
The four methods of cephalometric superimposi-tion assessed in this study yielded acceptable results and, when compared, did not present statistically different results. Sexual dimorphism was not present when male and female groups were compared. Thus, the clinical choice of any superimposition method will provide the orthodontist with important in-formation on growth and/or treatment outcomes. There was a high degree of reliability and precision when the cephalometric landmarks were digitally identified by Radiocef software. Intraexaminer er-ror values after twenty-one days were similar and with no statistically significant differences in com-parison to the first cephalometric measurements.
Vasconcelos et al31 compared the use of Radiocef 2.0 cephalometric sotware to Dentofacial Planner 7.02 cephalometric sotware. The authors concluded that regardless of which method was used, there was sig-niicant similarity of results. Additionally, no statisti-cally signiicant diferences were found when digital and manual tracings were compared, which conirms the reliability of the sotware used in the present study.
Some studies demonstrate7,8,9,32,33 that it is common to ind errors inherent to superimposition methods, and that the orthodontist should not base his clinical decision on one method alone to interpret the efects of growth and/or orthodontic treatment. As a result, the authors suggested the use of more than one cepha-lometric superimposition method in order to obtain additional clinical information.9,10,21,22,34
The source of error may afect the reliability of ceph-alometric superimposition. Errors in cephalometry are unavoidable. They come from various sources and arise at any stage of the cephalometric procedure.35 Problems may arise due to the cephalometric imaging technique itself, quality of the original radiograph, operator’s care and expertise, the protocol used to record superimpo-sition, distortions, landmark identiication and tracing errors, and also due to errors associated with growth and remodeling of the anatomical structure.
Stability and precision of some anatomical sites or cephalometric landmarks are a matter of great concern because there is no such thing as stable points, lines of reference or anatomical structures which would allow accurate superimposition during growth and develop-ment.13,36 For Baumrind, Miller and Molthen,9 cepha-lometric superimposition methods have the common objective of providing information about positional changes caused by growth and development and/or orthodontic treatment, but may also lead to diferent re-sults according to the reference area used by each meth-od. In this study, however, no statistically diference was observed among the superimposition methods used.
CONCLUSION
The results of this study suggest that Björk struc-tural, Steiner SN Line, Ricketts N-Ba line at N-point and Ricketts N-Ba line at CC-point superimposition methods are equally reliable and present a similar degree
of accuracy to demonstrate horizontal and vertical po-sitional changes, thereby allowing the orthodontist to perform an overall assessment of the efects occurring due to growth and/or orthodontic treatment.
1. Broadbent BH. The face of the normal child. Angle Orthod. 1937;7(4):183-208. 2. Steiner C. Cephalometrics in clinical practice. Angle Orthod. 1959;29:8-29. 3. Tweed CH. Evolutionary trends in orthodontics: past, present, and future. Am J
Orthod. 1953;39(2):81-108.
4. Björk A, Skieller V. Facial development and tooth eruption: an implant study at the age of puberty. Am J Orthod. 1972;62(4):339-83.
5. Björk A, Skieller V. Normal and abnormal growth of the mandible: a synthesis of longitudinal cephalometric implant studies over a period of 25 years. Eur J Orthod. 1983;5(1):1-46.
6. Ricketts RM. A four-step method to distinguish orthodontic changes from natural growth. J Clin Orthod. 1975;9:208-15.
7. Baumrind S, Frantz RC. The reliability of head ilm measurements: 1. Landmark identiication. Am J Orthod. 1971;60(2):111-27.
8. Baumrind S, Miller D, Molthen R. The reliability of head ilm mensurements: 2. Dentitional angular and linear measures. Am J Orthod. 1971;60(5):505-17. 9. Baumrind S, Miller D, Molthen R. The reliability of head ilm measurements. 3.
Tracing superimposition. Am J Orthod. 1976;70(6):617-44.
10. McDowell RM. The use of lateral head radiographs for evaluating orthodontic results as distinguished from growth changes. Part I. Technique and statement of problem. Am J Orthod Oral Surg. 1941;27:59-74.
11. Ghafari J, Engel FE, Laster LL. Cephalometric superimposition on the cranial base: a review and a comparison of four methods. Am J Orthod Dentofacial Orthop. 1987;91(5):403-13.
12. Bergersen EO. A comparative study of cephalometric superimposition. Angle Orthod. 1961;31(4):216-29.
13. Arat ZM, Turkkahraman H, English JD, Gallerano RL, Boley JC. Longitudinal growth changes of the cranial base from puberty to adulthood. A comparison of diferent superimposition methods. Angle Orthod. 2010;80(4):537-44. 14. Kolokitha O-E, Topouzelis N. Cephalometric methods of prediction in
orthognathic surgery. J Maxillofac Oral Surg. 2011;10(3):236-45. 15. Graber LW, Vanarsdall RL, Vig KWL. Diagnosis and treatment planning in
orthodontics: current principles and techniques. 5th ed. St. Louis: Mosby; 2012. 16. Houston WJB, Lee RT. Accuracy of diferent methods of radiographic
superimposition on cranial base structures. Eur J Orthod. 1985;7(2):127-35. 17. Buschang PH, LaPalme L, Tanguay R, Demirjian A. The technical reliability of
superimposition on cranial base and mandibular structures. Eur J Orthod. 1986;8(3):152-6.
18. Lundstrom A, Woodside DG. Individual variation in growth directions expressed at the chin and the midface. Eur J Orthod. 1980;2(2):65-79.
19. Zampieri RF, Henriques JFC, Freitas MR, Janson GRP. Estudo comparativo entre técnicas de superposição cefalométrica totais. Rev Dental Press Ortod Ortop Facial. 2005;10(6):141-56.
REFERENCES
20. Gliddon MJ, Xia JJ, Gateno J, Wong HTF, Lasky RE, Teichgraeber JF, et al. The accuracy of cephalometric tracing superimposition. J Oral Maxillofac Surg. 2006;64(2):194-202.
21. Halazonetis DJ. Cone-beam computed tomography is not the imaging technique of choice for comprehensive orthodontic assessment. Am J Orthod Dentofacial Orthop. 2012;141(4):403, 405, 407 passim.
22. Silva MAG, Wolf U, Heinicke F, Bumann A, Visser H, Hirschf E. Cone-beam computed tomography for routine orthodontic treatment planning: a radiation dose evaluation. Am J Orthod Dentofacial Orthop. 2008;133(5):640e1-5. 23. Dahlberg G. Statistical methods for medical and biological students. London:
George Allen and Unwin; 1940.
24. Houston WJB. The analysis of errors in orthodontic measurements. Am J Orthod. 1983;83(5):382-90.
25. Hofrath H. Die Bedeutung der Röntgenfern-und Abstandsaufnahme für die Diagnostik der Kieferanomalien. Fortschr Kieferorthop 1931;1:232-58. 26. Broadbent BH. A new X-ray technique and its application to orthodontia. Angle
Orthod. 1931;1:45-66.
27. Pancherz H, Hansen K. The nasion-sella reference line in cephalometry: a methodologic study. Am J Orthod. 1984;86:427-34.
28. De Coster L. The familial line, studied by a new line of reference. Trans Eur Orthod Soc. 1952;28:50-5.
29. Melsen B. The cranial base: the postnatal development of the cranial base studied histologically on human autopsy material. Acta Odontol Scand Suppl. 1974;32:1-126.
30. Duterloo HS, Planché PG. Handbook of cephalometric superimposition. Chicago: Quintessense; 2011.
31. Vasconcelos MHF, Janson G, Freitas MR, et al. Avaliação de um programa de traçado cefalométrico. Rev Dental Press Ortod Ortop Facial. 2006;11(4):44-54. 32. Baumrind S, Ben-Bassat Y, Bravo LA, Korn EL. Partitioning the components
of maxillary tooth displacement by the comparison of data from three cephalometric superimpositions. Angle Orthod. 1996;66(2):111-24. 33. Houston WJB, Maher RE, McElroy D, Sherrif M. Sources of error in
measurements from cephalometric radiographs. Eur J Orthod. 1986;8(3):149-51. 34. Bergersen EO. A comparative study of cephalometric superimposition. Angle
Orthod. 1961;31:216-29.
35. You QL, Hägg U. A comparison of three superimposition methods. Eur J Orthod. 1999;21:717-25.
36. Steuer I. The cranial base for superimposition of lateral cephalometric radiographs. Am J Orthod. 1972;61(5):493-500.