www.ambi-agua.net E-mail: [email protected]
Rev. Ambient. Água vol. 12 n. 3 Taubaté – May / Jun. 2017
Hydrological modeling of the Ribeirão das Posses – An assessment
based on the Agricultural Ecosystem Services (AgES) watershed
model
doi:10.4136/ambi-agua.2073
Received: 30 Dec. 2016; Accepted: 12 Apr. 2017
Patrícia Porta Nova da Cruz1*; Timothy R. Green2; Ricardo de Oliveira Figueiredo1; Anderson Soares Pereira1; Holm Kipka3; Sandra Isay Saad4; Jonathan Mota da Silva5;
Marco Antonio Ferreira Gomes1
1Empresa Brasileira de Pesquisa Agropecuária (EMBRAPA), Jaguariúna, SP, Brasil
Embrapa Meio Ambiente (CNPMA)
2United States Department of Agriculture (USDA)
Agricultural Research Service (ARS), Fort Collins, Colorado, USA Water Management and Systems Research Unit
3Colorado State University (CSU), Fort Collins, Colorado, USA
Department of Civil & Environmental Engineering
4Universidade de São Paulo (USP), São Paulo, SP, Brasil
Instituto de Energia e Ambiente
5Universidade de São Paulo (USP), São Paulo, SP, Brasil
Instituto de Astronomia, Geofísica e Ciências Atmosféricas
*Corresponding author: e-mail:[email protected],
[email protected], [email protected], [email protected], [email protected],
[email protected],[email protected], [email protected]
ABSTRACT
Southeastern Brazil has recently experienced drought conditions that have impacted watershed conservation and the management of water quality and quantity for agricultural and urban demands. The Ribeirão das Posses watershed is being monitored as a headwater of the Jaguarí River, which is one of the contributing rivers of the Cantareira Reservoir Complex in the state of São Paulo. The landscape has changed over the last century from native forests to more homogeneous vegetation for pastures, crops and some forest plantations of eucalyptus, which have cumulative impacts on water yield and quality. Currently, the Projeto Conservador
das Águas (Water Conservationist Project) has planted small areas with native species
Rev. Ambient. Água vol. 12 n. 3 Taubaté – May / Jun. 2017
impacts of land use changes on stream water quantity and quality. Such information can be used in programs of payments for ecosystem services.
Keywords: climate, ecosystem services, hydrology, water conservation, watershed model.
Modelagem hidrológica do Ribeirão das Posses - Uma avaliação
baseada no modelo Serviços Agrícolas Ecossistêmicos (AgES)
da bacia
RESUMO
A recente estiagem no Sudeste do Brasil tem impactado a conservação de bacias hidrográficas e a gestão da qualidade e quantidade da água para as demandas agrícolas e urbanas. A Bacia do Ribeirão das Posses está sendo monitorada por ser uma bacia de cabeceira da Bacia do Rio Jaguari, importante contribuinte do Sistema Cantareira no estado de São Paulo. A paisagem foi alterada no século passado, a partir de florestas nativas para uma vegetação mais homogênea como pastos, campos agrícolas e florestas de eucalipto, que geram impactos cumulativos sobre a quantidade e qualidade da água. Atualmente, o Projeto Conservador das Águas tem restaurado pequenas áreas com vegetação nativa para a recuperação de áreas degradadas. O objetivo dessa pesquisa foi avaliar a quantidade da água na Bacia do Ribeirão das Posses usando dados observados e dados da simulação de respostas hidrológicas. O modelo de bacia “Serviço Agroecossistêmico” (AgES) é aplicado para simular a variação no armazenamento e movimento da água nas áreas terrestres. O período de simulação (2009-2014) foi definido em função da disponibilidade dos dados de vazão e meteorológicos para calibrar e testar o modelo. Dados de entrada requisitados, calibração do modelo para ajuste à vazão medida e a sensibilidade do modelo aos dados de chuva são discutidos neste artigo. O modelo calibrado pode ser utilizado para estimar vazões durante períodos com dados ausentes e, no futuro, para analisar os impactos de mudança de uso da terra sobre a quantidade e qualidade da água. Essas informações podem ser usadas em programas de pagamentos por serviços ambientais.
Palavras-chave: clima, conservação da água, hidrologia, modelo de bacia hidrográfica, serviços ecossistêmicos.
1. INTRODUCTION
In 2014, Southeastern Brazil experienced a severe drought which has impacted the water quality and quantity for various demands. Increasing concerns exist about the watersheds of the Piracicaba, Capivari and Jundiaí Rivers, that cover an area of 15,303 km2 in the states of São Paulo (92.6% of the area) and Minas Gerais (7.4% of the area), and form a management region “PCJ Basins” (Bacias PCJ). In the 1990's, PCJ committees were created by federal and state
legislation to direct the management of the PCJ Basins.
Rev. Ambient. Água vol. 12 n. 3 Taubaté – May / Jun. 2017
The entire Jaguari watershed covers an area of 4,320 km2, including the vital headwater areas mentioned before. Originally covered by dense vegetation of the Atlantic Forest biome
(Mata Atlântica), these headwater areas were converted to primarily agricultural lands, with
beef and mostly dairy production serving as the primary source of revenue for farmers. Productivity is relatively low, as most farms are small, grazing potential is limited, and the labor force is aging (Gavaldão, 2009).
Inadequate agricultural management is an important factor contributing to deteriorating water production and quality (Solbé, 1986). According to DeFries and Eshleman (2004), land-use change will have a large impact on the water resources in the near future. Deforestation removes protective vegetation layers, and usually contributes to decreased evapotranspiration, and increased surface water runoff and erosion. As a potential consequence, flooding may occur and transport sediments into rivers, lakes and reservoirs. As rich surface soil layers are lost, reforestation of such areas is difficult, and parts of the landscape has become inhospitable for many native species (Ward and Trimble, 2011).
Moreover, climate change is likely to impact water resources in the basins, as it may be significant in the regional scale (Marengo et al., 2009). Consequently, it is necessary to understand the biophysical processes related to the water cycle and associated ecosystem services related to the water quality and quantity.
In 2005, the municipality of Extrema established laws to help enforce public policies regarding water resource management. To facilitate this, Projeto Conservador das Águas was
created, with the support of ANA (Brazilian National Water Agency), stimulating payments for environmental services (PES). The Projeto Conservador das Águas assists farmers that
participate in this project to adopt soil conservation practices, apply rural sewage systems, and restore riparian zones, steep slopes and hilltops lands of the Serra da Mantiqueira. Projeto
Conservador das Águas has planted native species within three selected catchments, especially
in riparian zones, around springs, and at hilltop positions, in order to restore forest vegetation. One of these catchments is the 12 km2 Ribeirão das Posses watershed, where the landscape has changed over the last two centuries from native forests to mostly pastures, and small areas of crops and some forest plantations of eucalyptus.
In this context, agro-hydrological modeling tools can generate information about water responses to climate and land use changes, to guide long-term planning for these watersheds which is essential for water resource management and sustainability (Targa and Batista, 2015). The Agricultural Ecosystems Services (AgES) watershed model (formerly called AgES-W) is used to simulate spatially variable water movement and storage among land areas or hydrological responses units. The objectives are to evaluate the water flow in the Ribeirão das Posses using measured data and simulation with the AgES model. We simulated the years 2009 to 2014 using available streamflow and rainfall data. We expect to provide scientific tools to help to analyze public policies of payments for ecosystem services (PES) by using calibrated models such as AgES to assess the effects of land-use change on the water resources quality and quantity, and simulate the combined effects of the projected climate changes.
2. MATERIALS AND METHODS
2.1. Study Area
Rev. Ambient. Água vol. 12 n. 3 Taubaté – May / Jun. 2017
Figure 1. Map of the study location within the States of Minas Gerais and São Paulo, Brazil.
Ribeirão das Posses has elevations ranging from 1,144 to 1,739 m (Lima, 2013), including steep slopes in the upper portions. The climate in the sub-basin is defined as a hot and humid summer and with dry winter (Cwb climate class in Köppen). The average temperatures during the winter and the summer are 13.1°C and 25.6°C, respectively, with annual occurrences of frosts. The mean annual rainfall is 1,477 mm (ANA, 2008). The Posses sub-basin has over one hundred rural properties sustaining subsistence farming (Zolin et al., 2014).
2.2. Agricultural Ecosystems Services (AgES) Watershed Model
AgES is a modular, Java-based model developed and implemented under the Object Modeling System (OMS) (David et al., 2013). AgES is a spatially distributed watershed model (Ascough et al., 2015a) with the main components taken primarily from the J2000 (Krause et al., 2006) and J2000-SN models (Fink et al., 2007) and has been applied to cropping systems in Colorado (Green et al., 2015) and the Midwest USA (Ascough et al., 2015a). The AgES model explicitly simulates the hydrologic and agronomic responses from spatially distributed land use, management, and weather conditions across inter-connected land units.
One specific function of the AgES model is the simulation of the interactions, both hydrological and chemical, between land areas, using the concept at Hydrological Response Units (HRUs), and the calculation of the overland and subsurface lateral flows. For a single HRU, AgES simulates the fluxes of infiltration, runoff and vertical redistribution of soil water at a daily time step (Green et al., 2015). This approach provides biophysical process-based and detailed calculation of the water balance and nutrients within each HRU. Figure 2 shows the conceptual hydrologic and nitrogen components of AgES linked to the land use management and crop growth components.
2.3. Data input and processing
Rev. Ambient. Água vol. 12 n. 3 Taubaté – May / Jun. 2017
outlet, runoff at different land areas, and water quality within the basin. Here, we focus on spatial and temporal model inputs.
The HRUs (Figure 3D) were delineated using WDAML (Watershed Delineation in ARC Macro Language) software. This program is an AML tool based on multiple flow direction topology and input layers for soils and land use (Pfennig et al., 2009; Green et al., 2014). We used the DEM and soil class map to make the HRUs.
The climate data were obtained from the National Centers for Environmental Prediction (NCEP) Climate Forecast System Reanalysis (CFSR) site: globalweather.tamu.edu (see also Fuka et al., 2013) and rainfall measurements from field gauges obtained from the Agência
Nacional de Águas (ANA, National Water Agency: hidroweb.ana.gov.br). We interpolated
multiple spatial points to produce daily weather variables for each HRU; see details in the results.
Daily stream flow data were obtained from ANA and checked for consistency and data quality. Only station S2 (Figure 3D) was used in this study.
Figure 2. Conceptual hydrologic and nitrogen (N) components of AgES coupled with land use management and crop growth components (Adapted from Ascough et al., 2015b). MPS is medium pore storage, and LPS is large pore storage.
2.4. Model calibration
Rev. Ambient. Água vol. 12 n. 3 Taubaté – May / Jun. 2017
Figure 3. Maps of the study location: (A) watershed delineation and topography based on a 5-m Digital Elevation Model (DEM); (B) land use classes; (C) soil class (Adapted from Lima, 2013); and (D) Hydrological Response Units (HRUs). Labelled points show gauging stations for: streamflow (S) and rainfall (R) of ANA and the Geological Survey of Brazil (CPRM), and water quality collected by Embrapa and CENA/USP (P).
A
B
Rev. Ambient. Água vol. 12 n. 3 Taubaté – May / Jun. 2017
Table 1. AgES model parameters used in the sensitivity analyses and calibration. Parameters are grouped into five steps for calibration in Luca. All parameters were assumed to be spatially uniform, but model responses can vary spatially by HRU. Details of the parameter definitions and process controls (response functions) are given in Green et al. (2015).
Parameter Name Calibrated Value Units Description
Step 1
BetaW 5.997 --- shape factor for relative transpiration, T/PET
soilPolRed 83.979 --- Polynomial ET reduction factor
Step 2
flowRouteTA 1.001 --- flood routing coefficient controlling flood wave velocity
soilMaxDPS 49.998 mm maximum depression storage
soilMaxInfSummer 47.273 mm d-1 Infiltrability parameter for southern hemisphere “summer” soilMaxInfWinter 62.054 mm d-1 Infiltrability parameter for southern hemisphere “winter” soilDistMPSLPS 0.158 --- controls distribution of infiltration to MPS and LPS
Step 3
soilDiffMPSLPS 6.898 --- controls flux of water from LPS to MPS
soilOutLPS 6.002 --- exponent in equation for LPS outflow
kdiff_layer 0.227 --- resistance parameter for capillary flow between layers soilLatVertLPS 0.500 --- lateral/vertical distribution coefficient for LPS
Step 4
kf 125.104 cm d-1 saturated hydraulic conductivity
aircapacity 0.650 m3 m-3 soil porosity or saturated water content
fieldCapacity 0.257 m3 m-3 one-third bar soil water content (separates MPS and LPS) deadCapacity 0.0002 m3 m-3 residual soil water content
Step 5
initRG1 0.266 --- initial storage of RG1 relative to maximum storage
gwRG1RG2dist 2.989 --- RG1/RG2 distribution coefficient
gwRG1Fact 0.574 --- adaptation of RG1 outflow
gwRG2Fact 10.314 --- adaptation of RG2 outflow
The calibration of AgES with Luca at this small watershed scale with 96 HRUs (Figure 3D) used thousands of iterations over approximately three days on a personal computer to complete three “rounds” with five “steps” each. Convergence to a globally optimal parameter set is indicated when the parameter values stabilize from one round to another. This method thus accounts for parameter interactions within and among steps, if they exist.
3. RESULTS AND DISCUSSION
For data processing (2.3), we faced some challenges and overcame them as follows:
Rev. Ambient. Água vol. 12 n. 3 Taubaté – May / Jun. 2017
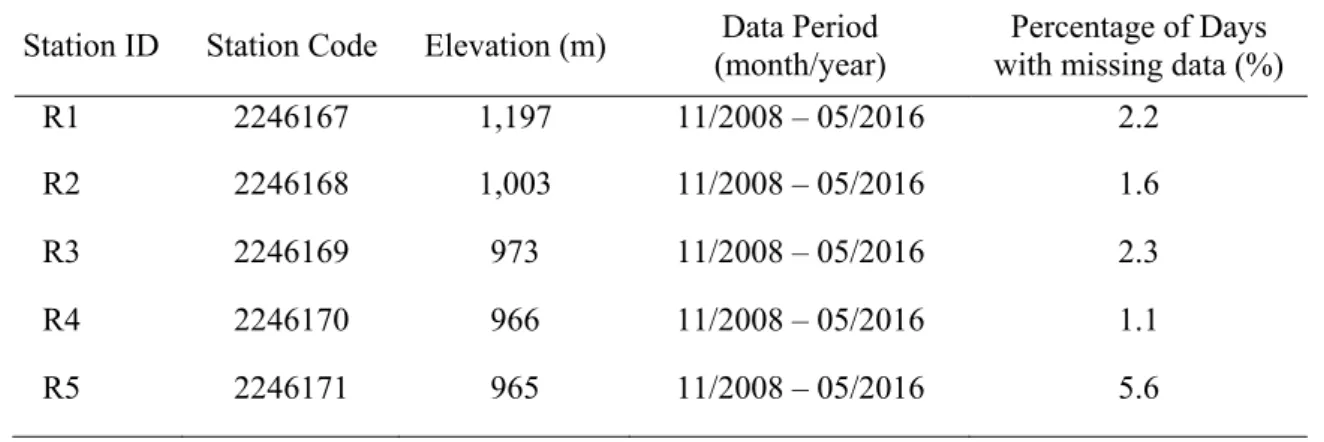
Missing data – The rainfall time series have a few missing values, some gauges are missing 30 days over the full period, and one station (R5) is missing four months of data (5.6% in Table 2). The stream discharge data have more gaps. Although this can be problematic in general, the calibration routine ignores missing data and uses only the available data. For weather data, each day must have at least one valid value (one station) for each meteorological variable. If more than one station has data, values are interpolated spatially.
Data quality assessment – The raw rainfall data quality was generally good, but the raw discharge data showed inconsistencies and many gaps. We used a database gap-filled by Silva (2014) and Saad (2016), who checked the data quality and made adjustments as needed. Deviations of the model calculations from “observed” streamflow can be caused by either model structural errors (inability to simulate real-world biophysical responses), calibration errors and inability to identify optimal parameter sets with limited information content using streamflow only at the outlet, or measurement errors and related data quality issues, and combinations of these factors.
Mapping land use and agricultural management practices spatially and temporally – We used a 2.5 m resolution spatial land use map derived from WorldView (2 Satellite Images with resolution of 60 cm) available for two years, 2004 and 2009, but only the latter has been used since it is the most recent. It is not strictly representative of a long period, because land use and agricultural management may likely have changed. Based upon the land use map, approximately 70% of land area is pasture. With this information, we decided to consider the whole basin as pasture for this study as a first approximation. Simulation of forests and crops is possible with AgES, but the current approach avoided the need for a long “warm-up” period in which trees would grow to maturity.
Despite these limitations and challenges, collaboration with national and local agencies provided the necessary input data to run AgES for a period of six years (2009-2014). Table 2 shows the periods of rainfall data availability. Since the AgES model interpolates rainfall for each day using only the available stations on that day, it is possible to have missing data or different periods of data.
Annual rainfall for each rain gauge from October 2008 to September 2014 is presented in Figure 4 (Water Year is October 1 to September 30 in this region), which displays a slight orographic effect with a tendency for rainfall to increase with elevation. Also, inter-annual variability is more pronounced than spatial variability within the Posses watershed, and drought conditions are evident in Water Years 2013-2014.
Table 2. Rainfall Stations and periods of available data.
Station ID Station Code Elevation (m) (month/year) Data Period with missing data (%) Percentage of Days
R1 2246167 1,197 11/2008 – 05/2016 2.2
R2 2246168 1,003 11/2008 – 05/2016 1.6
R3 2246169 973 11/2008 – 05/2016 2.3
R4 2246170 966 11/2008 – 05/2016 1.1
Rev. Ambient. Água vol. 12 n. 3 Taubaté – May / Jun. 2017
Figure 4. Annual rainfall amounts recorded at five rain gauges (R1-R5 in Figure 3D) used for inputs to AgES. WY denotes Water Year (previous calendar year Oct. 1 – Sep. 30). Note: The graph starts at 1000 mm, which amplifies the differences.
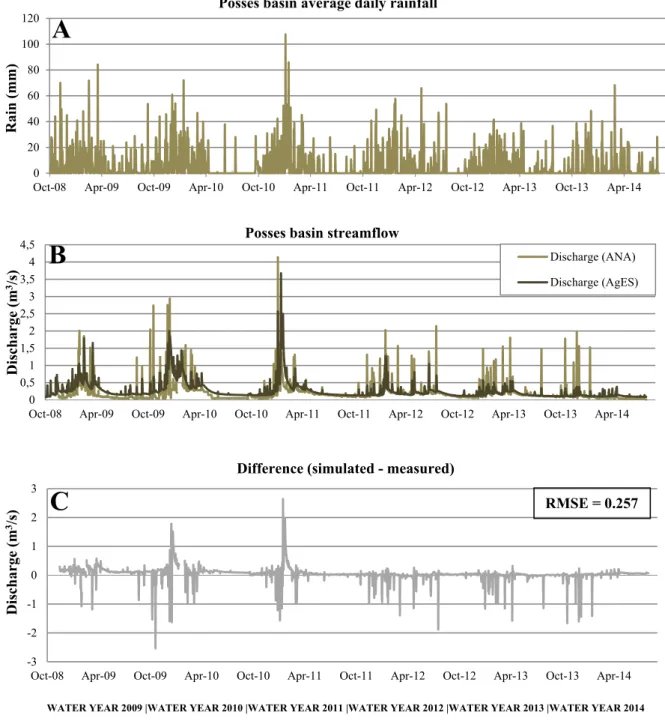
The temporal streamflow pattern follows the seasonal precipitation pattern (Figure 5A). Typically, the streamflow response is almost immediate within the day of precipitation, since the basin is relatively small and wet with a short dry season. This is seen as spikes in both measured and simulated streamflow (Figure 5B). The results also reflect historical drought conditions during 2013 to 2014 in the study area. However, AgES could not reproduce all of the daily flows, and some events were similar in magnitude but the timing was off. The largest differences between the simulated and observed discharge were seen in peak events. This was the main reason for a high value for the Root Mean Square Error (RMSE), 0.257 m3 s-1, for a microbasin like Ribeirão das Posses. The SWAT model has the same difficulty of simulating the daily flow during peak flow events, having underestimated the flow (Silva, 2014). To discuss these differences more precisely, we show the differences between simulated and measured streamflow in Figure 5C. The main series of negative differences (simulated < observed) occurred in 2012-2014, when the precipitation increased slightly but this response did not occur in the simulated flow. This could be because the region went through a dry period and, when it started to rain a bit more, there was more available storage in the soils and an increase in infiltration; likewise, groundwater levels were lower and baseflow decreased. Thus, the rain patterns are similar to flow except during the dry season.
After calibrating AgES using all five gauges (R1-R5) as the base case, we simulated streamflow with different rain gauges as inputs using the same set of calibrated model parameters (Table 1). For this analysis only R1 or R3 or R5 were used to test the model sensitivity to rainfall inputs (Figure 6A). The annual streamflow amount is not too sensitive, but some peak flows deviated substantially. The differences (Figure 6B) exceeded the deviations of simulated verses measured values on some dates. We note that R3 in the middle
1000 1200 1400 1600 1800 2000 2200
WY 09 WY 10 WY 11 WY 12 WY 13 WY 14
Annual Rainfall
(mm)
Rev. Ambient. Água vol. 12 n. 3 Taubaté – May / Jun. 2017
of the watershed (Figure 3D) produced the largest deviation in Jan 2011, and R1 can give the opposite deviations (see Water Year 2010 in Figure 6B). The differences shown for a specific rain gauge simulation are due to the bias in the rainfall time series. Thus, spatial differences in measured rainfall data can have substantial effects on the simulated runoff using a spatial watershed model like AgES. It is also worth noting that most watersheds of this size will not have more than one rain gauge, so such differences would be unknown.
WATER YEAR 2009 |WATER YEAR 2010 |WATER YEAR 2011 |WATER YEAR 2012 |WATER YEAR 2013 |WATER YEAR 2014
Figure 5. Daily values of (A) basin-average rainfall estimated by AgES from rain gauges, (B) stream discharge at the outlet measured and simulated, and (C) difference between simulated minus observed stream discharge at the outlet.
0 20 40 60 80 100 120
Oct-08 Apr-09 Oct-09 Apr-10 Oct-10 Apr-11 Oct-11 Apr-12 Oct-12 Apr-13 Oct-13 Apr-14
Rain
(mm)
Posses basin average daily rainfall
0 0,5 1 1,5 2 2,5 3 3,5 4 4,5
Oct-08 Apr-09 Oct-09 Apr-10 Oct-10 Apr-11 Oct-11 Apr-12 Oct-12 Apr-13 Oct-13 Apr-14
Discharge
(m
3/s)
Posses basin streamflow
Discharge (ANA) Discharge (AgES)
-3 -2 -1 0 1 2 3
Oct-08 Apr-09 Oct-09 Apr-10 Oct-10 Apr-11 Oct-11 Apr-12 Oct-12 Apr-13 Oct-13 Apr-14
Discharge
(m
3/s)
Difference (simulated - measured)
A
B
Rev. Ambient. Água vol. 12 n. 3 Taubaté – May / Jun. 2017 | WATER YEAR 2009 |WATER YEAR 2010 |WATER YEAR 2011 |WATER YEAR 2012 |WATER YEAR 2013 |WATER YEAR 2014 |
Figure 6. (A) Simulated and observed streamflow with different rain gauges inputs, and (B) simulated streamflow and differences.
4. CONCLUSIONS
The AgES watershed model performed relatively well for simulating stream flow at the outlet of the Ribeirão das Posses basin, and we conclude that AgES can be used for evaluating the particular hydrological responses. The results reflect historical drought conditions during 2013 to 2014 and the streamflow response is almost immediate within the day of precipitation, since the basin is relatively small and wet with a short dry season. However, the RMSE was high due the high difference between the values simulated and observed in peak flows. AgES could not reproduce all of the daily flows, and some events were similar in magnitude but the timing was off. We should also remember that these results assumed that pasture (grass)
0 0,5 1 1,5 2 2,5 3 3,5 4 4,5
Oct-08 Apr-09 Oct-09 Apr-10 Oct-10 Apr-11 Oct-11 Apr-12 Oct-12 Apr-13 Oct-13 Apr-14
Simulated & Observ
ed S tream flow (m 3s -1) Obs R1 R3 R5
All gauges (R1-R5)
-3 -2 -1 0 1 2 3 4
Oct-08 Apr-09 Oct-09 Apr-10 Oct-10 Apr-11 Oct-11 Apr-12 Oct-12 Apr-13 Oct-13 Apr-14
Si mu lated S tream flow & D ifferen ces (m 3s -1) Difference (R1-All) Difference (R3-All) Difference (R5-All) All gauges (R1-R5)
A
Rev. Ambient. Água vol. 12 n. 3 Taubaté – May / Jun. 2017
covered the entire watershed. AgES should perform even better when using a more realistic distribution of land use based on maps with historical information.
Quantitative assessments of potential benefits of conservation practices in southeastern Brazil require both environmental field monitoring and computer simulations, such as those we discuss here. This paper illustrated the data requirements and model complexity needed to evaluate the water flow regime in areas with restoration and activities of payments for ecosystem services. The AgES model and current field data were proposed here as spatially distributed watershed tools for calibration and simulation of the water dynamics under climate variability.
The AgES model can also be used to predict watershed responses to different expected land-use patterns, and projected climate scenarios. In addition to streamflow, we plan to simulate water quality in the Ribeirão das Posses watershed. This may require further calibration and testing of the AgES model under historical (measured) conditions. Subsequently, the model may also be used to estimate missing or poor stream data.
5. ACKNOWLEDGMENTS
We thank Elias Gomes de Almeida, José Tadeu de Oliveira Lana and Ricardo Antonio Almeida Pazianotto, analysts at Embrapa Environment, who assisted with the generation of maps and the computational part of running the AgES model. AgES team members at USDA-ARS and Colorado State University (Jim Ascough, Nathan Lighthart, Rob Erskine, Greg McMaster, Debbie Edmunds, and Olaf David) supported the code development and deployment. CNPq funded this research and international collaboration under the program
“Ciência Sem Fronteiras” (Science without Borders Program) (Grants 401178/2014-5,
150143/2015-3 and 150043/2016-3). Drs. Humberto Ribeiro da Rocha and Mark Tomer provided helpful comments prior to journal submission. We also thank EMBRAPA (SEG-021421002) and FAPEMIG (APQ-03157-13) for supporting this work under the scope of the research project "Land use effects on quali-quantitative aspects of water resources in headwater areas of the Camanducaia and Jaguari river basins" with the partnership of the AgroHidro Network as well as the collaborative work with the FAPESP Project number 2016/02890-1 (Impact of Climate Change on the hidrobiogeochemistry of two small tributary watersheds to Cantareira system in an area attended by a program of Payment for Environmental Services).
6. REFERENCES
AGÊNCIA NACIONAL DE ÁGUAS – ANA (Brasil). Programa produtor de água superintendência de usos múltiplos. Brasília: Ministério do Meio Ambiente, 2008. ASCOUGH, J. C.; GREEN, T. R.; DAVID, O.; KIPKA, H.; MACMASTER, G. S. The
spatially-distributed AgroEcoSystem-Watershed (AgES-W) hydrologic/water quality (H/WQ) model for assessment of conservation effects. In: ANNUAL HYDROLOGY DAYS CONFERENCE PROCEEDINGS, 23-25 March 2015, Fort Collins, Colorado. Proceedings… Fort Collins: [s.n.], 2015a. 16p. http://hydrologydays.colostate.edu/ Papers_15/AgES-W_paper.pdf
Rev. Ambient. Água vol. 12 n. 3 Taubaté – May / Jun. 2017
DAVID, O.; ASCOUGH, J. C.; LLOYD, W.; GREEN, T. R.; ROJAS, K. W.; LEAVESLEY, G. H. et al. A software engineering perspective on environmental modeling framework design: The Object Modeling System. Environmental Modelling & Software, v. 39, p. 201–213, 2013 http://doi.org/10.1016/j.envsoft.2012.03.006
DEFRIES, R.; ESHLEMAN K. N. Land-use change and hydrologic processes: a major focus for the future. Hydrological Processes, v. 18, p. 2183–2186, 2004. http://dx.doi.org/10.1002/hyp.5584
FINK, M. P.; KRAUSE, S.; KRALISCH, U.; BENDE-MICHL, W; FLÜGEL, A. Development and Application of the Modelling System J2000-S for the EU-Water Framework directive, Advances in Geosciences, v. 11, p. 123-130, 2007. https://hal.archives-ouvertes.fr/hal-00297012
FUKA, D. R.; WALTER, M. T.; MACALLISTER, C. A.; DEGAETANO, A. T.; STEENHUIS, T. S.; EASTON, Z. M. Using the Climate Forecast System Reanalysis dataset to improve weather input data for watershed models. Hydrological Processes, 2013. http://dx.doi.org/10.1002/hyp.10073
GAVALDÃO M. Avaliação da percepção ambiental e dos impactos socio-econômicos do projeto “Conservador das Águas” Extrema, Minas Gerais. The Nature Conservancy, p.1–113, 2009.
GREEN, T. R.; ERSKINE, R. H.; ASCOUGH, J. C.; KIPKA, H.; DAVID, O.; COLEMAN, M. L. AgroEcoSystem-Watershed (AgES-W) simulation, scaling and delineation. In: INTERNATIONAL CONGRESS ON ENVIRONMENTAL MODELLING AND SOFTWARE (iEMSs), 8., 15-19 June 2014, San Diego. Proceedings… San Dieg: [s.n.], 2014.
GREEN, T. R.; ERSKINE, R. H.; COLEMAN, M. L.; DAVID, O.; ASCOUGH, J. C.; KIPKA, H. The AgroEcoSystem (AgES) Response-Function Model Simulates Layered Soil-Water Dynamics in Semi-Arid Colorado: Sensitivity and Calibration. Vadose Zone Journal, 2015. http://dx.doi.org/10.2136/vzj2014.09.0119
HAY, L.E.; UMEMOTO, M. Multiple-objective stepwise calibration using Luca. Open-File Rep. 2006-1323. Reston: USGS, 2006. ftp://brrcrftp.cr.usgs.gov/pub/mows/pubs/hay_ pubs/hay_pdf/luca_ manual.pdf
KRAUSE, P.; BÄSE, F.; BENDE-MICHL, U.; FINK, M.; W. FLÜGEL, W.; PFENNIG. B. Multiscale investigations in a mesoscale catchment - Hydrological modelling in the Gera catchment. Advances in Geosciences, v. 9, p. 53-61, 2006. https://hal.archives-ouvertes.fr/hal-00296956
LIMA, G. C. Variabilidade Espacial dos atributos físicos e químicos e índice de qualidade dos solos da sub-bacia das Posses, Extrema (MG), sob diferentes agroecossistemas. 2013. Tese (Doutorado) - Universidade Federal de Lavras, Lavras, 2013
Rev. Ambient. Água vol. 12 n. 3 Taubaté – May / Jun. 2017
PFENNIG, B.; KIPKA, H.; WOLF, M.; FINK, M.; KRAUSE, P.; FLÜGEL, W. A.. Development of an extended routing scheme in reference to consideration of multi-dimensional flow relations between hydrological model entities. In: World IMACS; MODSIM09 INTERNATIONAL CONGRESS ON MODELLING AND SIMULATION, 18., 2009, Cairns, Australia. Proceedings… Cairns: 2009. p. 1972-1978. SAAD, S. I. Modelagem e valoração dos serviços ambientais hidrológicos da recuperação da vegetação no Ribeirão das Posses, Extrema, MG. 2016. Tese (Doutorado em Ciências Ambientais) - Universidade de São Paulo, São Paulo, 2016.
SILVA J. M. da, O serviço ambiental hidrológico das áreas de proteção permanente: um estudo de caso com modelagem numérica em pequena e mesoescala na bacia do Rio Piracicaba. 2014. Tese (Doutorado em Meteorologia) - Instituto de Astronomia, Geofísica e Ciências Atmosféricas, Universidade de São Paulo, 2014.
SOLBÉ, J. F. L. G. (Ed). Effects of Land Use on Fresh Waters. Chichester: Ellis Horwood Publishers, 1986.
TARGA, M. S.; BATISTA G. T. Benefits and legacy of the water crisis in Brazil. Revista Ambiente & Água, v. 10 n. 2, p. 234 -239, 2015. http://dx.doi.org/10.4136/ambi-agua.1629
WARD, A. D.; TRIMBLE, S. W. Environmental Hydrology. 2nd edition. Boca Raton: CRC Press, 2011. 475p.