BRIEF COMMUNICATION
Arq Gastroenterol • 2017. v.54 No.1 Jan/Mar • 79
INTRODUCTION
Older patients are commonly malnourished during hospital stay(8), and a high prevalence of malnutrition is found in hos-pitalized patients aged more than 65 years(13). Therefore, the use of nutritional screening instruments(24) is critical given the prevalence of malnutrition and/or nutritional risk in hospitalized older adults(8,24).
In a recent prospective study, Calvo et al., 2012, found that 77% of hospitalized older adults were at risk of malnutrition or malnourished according to the mini-nutritional assessment, and that low serum albumin, cholesterol, and vitamins A and D were associated with malnutrition or risk of malnutrition(3). Another recent study found better agreement between the calf circumfer-ence and body mass index of older adults(9). Nutritional risk has been found to increase progressively in older adults compared with younger adults(19). There is no gold standard for assessing the nutritional status of older adults, thus the use of many nutri-tional indicators is necessary to diagnose their nutrinutri-tional status more accurately and establish an optimal nutritional intervention strategy(16,17).
This study aimed to investigate whether total lymphocyte count (TLC) is associated with other nutritional markers in hospitalized older adults.
Is total lymphocyte count related to nutritional
markers in hospitalized older adults?
Vânia Aparecida
LEANDRO-MERHI
1,2, Vitória Negri
BRÁZ
1and José Luis Braga de
AQUINO
2,3Received 3/4/2016 Accepted 16/9/2016
ABSTRACT – Background – Older patients are commonly malnourished during hospital stay, and a high prevalence of malnutrition is found in hospitalized patients aged more than 65 years. Objective – To investigate whether total lymphocyte count is related to other nutritional markers in hospitalized older adults. Methods – Hospitalized older adults (N=131) were recruited for a cross-sectional study. Their nutritional status was assessed by the Nutritional Risk Screening (NRS), anthropometry, and total lymphocyte count. The statistical analyses included the chi-square test, Fisher’s exact test, and Mann-Whitney test. Spearman’s linear correlation coeficient determined whether total lymphocyte count was correlated with the nutritional markers. Multiple linear regression determined the parameters associated with lymphocyte count. The signiicance level was set at 5%. Results – Ac-cording to the NRS, 41.2% of the patients were at nutritional risk, and 36% had mild or moderate depletion acAc-cording to total lymphocyte count. Total lymphocyte count was weakly correlated with mid-upper arm circumference (r=0.20507); triceps skinfold thickness (r=0.29036), and length of hospital stay (r= -0.21518). Total lymphocyte count in different NRS categories differed signiicantly: older adults who were not at nutritional risk had higher mean and median total lymphocyte count (P=0.0245). Multiple regression analysis showed that higher lymphocyte counts were associated with higher triceps skinfold thicknesses and no nutritional risk according to the NRS. Conclusion – Total lymphocyte count was correlated with mid-upper arm circumference, triceps skinfold thickness, and nutritional risk according to the NRS. In multiple regression the combined factors that remained associated with lymphocyte count were NRS and triceps skinfold thickness. Therefore, total lymphocyte count may be considered a nutritional marker. Other studies should conirm these indings.
HEADINGS – Elderly nutrition. Lymphocyte count. Nutrition assessment.
Declared conflict of interest of all authors: none
Disclosure of funding: no funding received
1 Faculdade de Nutrição, PUC-Campinas, SP, Brasil; 2 Programa de Pós-Graduação em Ciências da Saúde, PUC-Campinas, SP, Brasil; 3 Faculdade de Medicina, PUC-Campinas, SP, Brasil.
Correspondence: Vânia Aparecida Leandro-Merhi. Av. Carlos Grimaldi, 1171, casa D-13. Bairro Jardim Conceição – CEP: 13091-906 – Campinas, SP, Brasil. E-mail: [email protected] METHODS
Characteristics and type of study, cases, and ethics This cross-sectional study was conducted in a surgery unit of a general university hospital. A total of 131 older patients were recruited after approval of the local Research Ethics Committee.
Inclusion and exclusion criteria
The study inclusion criteria were age ≥60 years(16), no terminal disease, nutritional assessment in the irst 48 hours of hospital stay, and complete nutritional status information recorded the in medi-cal records of the institution. Patients who had been hospitalized exclusively for clinical investigations or tests, for chemotherapy, radiotherapy, or hemodialysis, patients with inlammatory, im-munological, and allergic diseases, infections, fever, sepsis, taking corticosteroids, or patients with incomplete nutritional status information in the medical records were excluded.
Data collection and study variables
The following variables were collected from the medical records: gender, age, length of hospital stay, death, Nutritional Risk Screen-ing (NRS), and anthropometric data, namely body mass index (BMI), calf circumference (CC), mid-upper arm circumference (MUAC), triceps skinfold thickness (TST), mid-upper arm muscle circumference (MUAMC), and total lymphocyte count (TLC).
AG-2016-31
Leandro-Merhi VA, Bráz VN, Aquino JLB.
Is total lymphocyte count related to nutritional markers in hospitalized older adults?
80 • Arq Gastroenterol • 2017. v.54 No.1 Jan/Mar
Nutritional Risk Screening (NRS)
Nutritional risk was assessed by the NRS, a method proposed and validated by the European Society for Clinical Nutrition and Metabolism (ESPEN)(10,11). The NRS takes into account recent weight loss, body mass index, low food intake, and disease severity, and classiies patients according to the inal score: score ≥ 3 indicates nutritional risk and score < 3 indicates no nutritional risk(10,11).
Anthropometry
The anthropometric variables were measured using the standard procedures and classiied according to the cut-off points established by the pertinent literature. BMI was classiied as recommended by Lipschitz (1994)(14), who deines the following cut-off points for older adults: underweight when BMI≤22; normal weight when 22<BMI<27, and overweight when BMI≥27. Calf circumference was classiied as recommended by the World Health Organiza-tion (WHO)(23). The body composition indicators mid-upper arm circumference, triceps skinfold thickness, and mid-upper arm muscle circumference were classiied as recommended by Frisancho (1990) (7) and Burr & Phillips (1984)(2).
Total lymphocyte count (TLC)
TLC was classiied as recommended by Blackburn et al.(1) as follows: mild depletion when 1200≤TLC≤2000 cells/mm³;
moderate depletion when 800≤TLC≤1199 cells/mm3; and severe depletion when TLC<800 cells/mm³.
Statistical analysis
The patients were characterized by descriptive analysis with tables of frequency for the categorical variables and measures of position and dispersion for the continuous variables. The chi-square test or Fisher’s exact test when necessary veriied associations or compared proportions. The Mann-Whitney test compared continu-ous or ordinal measures between the groups. Finally, Spearman’s linear correlation coeficient investigated the correlation between TLC and the nutritional indicators(4). Multiple linear regression determined the parameters associated with lymphocyte count(18,20). The signiicance level was set at 5% for all tests.
RESULTS
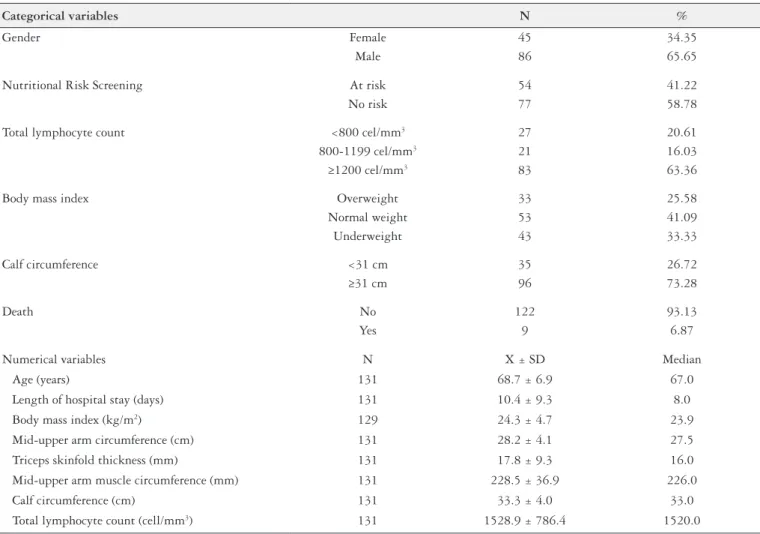
Table 1 shows the general description of the study variables. The patients had a mean age of 68.7±6.9 years, most were male (65.65%), 41.22% of the sample was at nutritional risk according to the NRS, and 33.33% had low BMI. Calf circumference and TLC were low in 26.71% and 20.61% of the sample, respectively. The mean length of hospital stay was 10.4±9.3 days. Table 1 also shows the means for the anthropometric variables and TLC.
TABLE 1. General description of the categorical and numerical variables (N=131)
Categorical variables N %
Gender Female 45 34.35
Male 86 65.65
Nutritional Risk Screening At risk 54 41.22
No risk 77 58.78
Total lymphocyte count <800 cel/mm3 27 20.61
800-1199 cel/mm3 21 16.03
≥1200 cel/mm3 83 63.36
Body mass index Overweight 33 25.58
Normal weight 53 41.09
Underweight 43 33.33
Calf circumference <31 cm 35 26.72
≥31 cm 96 73.28
Death No 122 93.13
Yes 9 6.87
Numerical variables N X ± SD Median
Age (years) 131 68.7 ± 6.9 67.0
Length of hospital stay (days) 131 10.4 ± 9.3 8.0
Body mass index (kg/m2) 129 24.3 ± 4.7 23.9
Mid-upper arm circumference (cm) 131 28.2 ± 4.1 27.5
Triceps skinfold thickness (mm) 131 17.8 ± 9.3 16.0
Mid-upper arm muscle circumference (mm) 131 228.5 ± 36.9 226.0
Calf circumference (cm) 131 33.3 ± 4.0 33.0
Leandro-Merhi VA, Bráz VN, Aquino JLB.
Is total lymphocyte count related to nutritional markers in hospitalized older adults?
Arq Gastroenterol • 2017. v.54 No.1 Jan/Mar • 81 Table 2 shows Spearman’s linear correlation coeficient analyses,
which found that TLC was weakly correlated with mid-upper arm circumference (r=0.20507), triceps skinfold thickness (r=0.29036), and length of hospital stay (r= -0.21518). Length of hospital stay decreased as TLC increased. However, TLC increased with mid-upper arm circumference and triceps skinfold thickness. TLC was not correlated with calf circumference.
DISCUSSION
It is important to bear in mind that this study involved hos-pitalized patients from a surgery unit. Dudrick, 2011(5), found that older surgical patients have higher morbidity and mortality, and higher rates of malnutrition and functional disorders than younger surgical patients.
The initial intent of the present study was to investigate whether TLC was related to anthropometric indicators and nu-tritional risk according to the NRS. None of the study variables differed between patients of the three TLC categories (based on the cut-off points). However, the numerical TLC values of patients in different categories of nutritional risk (P=0.0245), mid-upper arm circumference (P=0.0188), and triceps skinfold thickness (P=0.0008) differed signiicantly. The objective of the present study was based on the dificulty of assessing bedridden patients or patients who cannot be weighed due to locomotion problems. Hence, the study investigated the possibility of using TLC along with other nutritional indicators to assess the patients’ nutritional status.
Other authors have already investigated the use of TLC and its relationship with the nutritional status of older adults. A study in Japan(12) investigated whether TLC could be associ-ated with other nutritional markers, such as anthropometry, the mini nutritional assessment, serum albumin, and cholesterol. Kuzuya et al.(12) found that TLC (based on the cut-off point for depletion) was not associated with serum albumin, cholesterol, mini nutritional assessment, and anthropometry. These authors also found a negative correlation between TLC and age, but no correlation between TLC and nutritional markers(12). Other stu-dies(15) also investigated TLC and serum albumin as markers of malnutrition in older adults aged more than sixty years with hip fractures, and found that both TLC and serum albumin behave as accurate and inexpensive clinical markers of malnutrition in such patients(15).
The mini nutritional assessment is another widely used indica-tor for detecting malnutrition in older patients. This instrument has been considered by many authors as a useful and effective detector of nutritional risk(13,19). Other instruments, such as the Malnutrition Universal Screening Tool (MUST) have also been considered effective and valid(16). Another recent study(9) reported that calf circumference was a better predictor of emerging care need in older adults than body mass index. The authors concluded that more studies are needed on anthropometry, especially calf circumference in older adult care(9).
A study(22) of older adults investigated the relationship be-tween anthropometric indicators and mortality, and found that mid-upper arm circumference was a better indicator than body mass index in older patients(22). Mid-upper arm circumference was more strongly associated with mortality than body mass index or calf circumference(22). Another study(21) found that mid-upper arm circumference and calf circumference can predict the health status and risk of mortality of institutionalized older adults more effectively.
Given changes in nutritional status, the differences between the various indicators used for nutritional diagnosis(3,6,9,16,17,21,24), and the peculiarities of older adults, new studies are needed on the nutritional status of hospitalized older surgical patients, and on continuous and routine nutritional status monitoring.
TABLE 2. Correlation between total lymphocyte count and the study indicators
Indicators Coeficient (r) P-value N
TLC vs length of hospital stay -0.21518 0.0136 131
TLC vs age -0.08249 0.3489 131
TLC vs body mass index 0.13500 0.1272 129
TLC vs mid-upper arm
circumference 0.20507 0.0188 131
TLC vs triceps skinfold
thickness 0.29036 0.0008 131
TLC vs mid-upper arm muscle
circumference -0.02702 0.7594 131
TLC vs calf circumference 0.08708 0.3227 131
The TLC of patients at nutritional risk also differed signiicantly from the TLC of patients not at nutritional risk according to the NRS. Older adults not at nutritional risk had higher mean and median TLC (P=0.0245). On the other hand, the TLC of patients in different categories of calf circumference and body mass index did not differ signiicantly (P=0.6716 and P=0.1077, respectively) (data not tabulated).
Individuals in different calf circumference categories (<31 cm and ≥31 cm) had signiicantly different nutritional risk (P<0.0001) and body mass index (P<0.0001). Seventy-one percent of patients with calf circumference <31 cm were at nutritional risk according to the NRS (data not tabulated).The most common diseases found in the study sample were neoplasms (65.65%), digestive tract diseases (27.5%), and renal diseases (6.9%).
Nutritional risk (NRS) and anthropometric parameters (BMI, MUAC, TST, MUAMC, and CC) were assessed together by a mul-tiple linear regression model with stepwise selection. The response variable (lymphocytes) was rank-transformed because it did not have normal distribution. Table 3 shows the factors that, together, remained associated with lymphocyte count, namely nutritional risk and TST. Higher TST and absence of nutritional risk according to the NRS were associated with higher lymphocyte counts.
TABLE 3. Results of multiple linear regression analysis with stepwise selection
Variables Category Beta * EP ** P-value R2 ***= 0.0934 NRS No risk vs
At risk
10.088 6.71 0.0207
TST 0.985 0.36 0.0065
NRS: Nutritional Risk Screening; TST: Triceps Skinfold Thickness. * Beta: estimate or angular coeficient (slope) value in the regression line. ** EP: standard error beta. *** R2:
Leandro-Merhi VA, Bráz VN, Aquino JLB.
Is total lymphocyte count related to nutritional markers in hospitalized older adults?
82 • Arq Gastroenterol • 2017. v.54 No.1 Jan/Mar CONCLUSION
Although the different cut-off point-based categories of TLC were not associated with body mass index and calf circumference, TLC was signiicantly correlated with mid-upper arm circumfer-ence, triceps skinfold thickness, and nutritional risk according to the NRS in hospitalized older surgical patients. In multiple regression, the combined factors that remained associated with lymphocyte count were nutritional risk and triceps skinfold thickness. Therefore, TLC may be considered a nutritional marker. Other studies should conirm these indings.
ACKNOWLEDGMENTS
The authors thank the Hospital and Maternity Hospital Celso Pierro and the Pontiical Catholic University of Campinas – SP – Brazil for making this study possible.
Authors’ contributions
Leandro-Merhi VA conceived and designed the study, performed the statistical analyses, and wrote and reviewed the manuscript. Bráz VN collected and tabulated data and participated in manuscript writing. Aquino JLB participated in manuscript writing and review.
Leandro-Merhi VA, Bráz VN, Aquino JLB. A contagem de linfócitos totais apresenta alguma relação com marcadores nutricionais em idosos hospitali-zados? Arq Gastroenterol. 2017,54(1):79-82.
RESUMO – Contexto – Durante a hospitalização é comum que pacientes idosos se encontrem desnutridos, sendo observada alta prevalência de pacientes idosos hospitalizados acima de 65 anos de idade. Objetivo – Investigar se a contagem de linfócitos totais apresenta alguma associação com outros marcadores nutricionais em pacientes idosos hospitalizados. Métodos – Pacientes idosos hospitalizados (N=131) foram recrutados em um estudo transversal. Investigou-se o estado nutricional por meio do Nutritional Risk Screening (NRS), antropometria e a contagem de linfócitos totais. A análise estatística foi realizada com os testes Qui-quadrado, Fischer e Mann-Whitney. Aplicou-se o coeiciente de correlação linear de Spearman para se investigar a presença de correlação entre a CLT e os marcadores nutricionais e para avaliação dos parâmetros associados à contagem de linfócitos foi utilizada a análise de regressão linear múltipla, com nível de signiicância de 5%. Resultados – O NRS mostrou 41,2% de pacientes com risco nutri-cional e 36% dos pacientes encontravam-se com depleção leve ou moderada na contagem de linfócitos totais. Houve correlação signiicativa, de fraca intensidade, entre a contagem de linfócitos totais e a circunferência de braço (r=0,20507); a prega cutânea triciptal (r=0,29036) e o tempo de internação (r= -0,21518). Veriicou-se ainda diferença signiicativa na comparação da contagem de linfócitos totais com as categorias de risco nutricional pelo NRS; a contagem de linfócitos totais foi maior, em média ou mediana, entre os idosos que não apresentaram risco nutricional pelo NRS (P=0,0245). A análise de regressão múltipla mostrou que a maior contagem de linfócitos foi associada a valores maiores de prega cutânea triciptal e à classiicação de sem risco nutricional pelo NRS. Conclusão – A contagem de linfócitos totais apresentou associação com a circunferência de braço, com a prega cutânea triciptal e com o NRS, podendo ser considerada como um marcador nutricional. Na regressão, os fatores que, em conjunto, mantiveram-se associados à contagem de linfócitos foram o NRS e a prega cutânea triciptal. Outras investigações devem ser realizadas para conirmar estes achados. DESCRITORES – Nutrição do Idoso. Contagem de linfócitos. Avaliação nutricional.
REFERENCES
1. Blackburn GL, Bristian BR, Maini BS, Schlamm HT, Smith MF. Nutritional
and metabolic assessment of the hospitalized patient. The Journal of Parenteral and Enteral Nutrition. 1977;1:11-22.
2. Burr ML, Phillips MK. Anthropometric norms in the elderly. Br Journal of
Nutrition. 1984;51:165-9.
3. Calvo I, Olivar J, Martínez E, Rico A, Díaz J, Gimena M. Mini Nutritional As-sessment as a nutritional screening tool for hospitalized older adults; rationales and feasibility. Nutrición Hospitalaria. 2012;27:1619-25.
4. Conover WJ. Practical Nonparametric Statistics. 3 ed. John Wiley & Sons Inc. Nova Iorque. 1999.
5. Dudrick SJ. Nutrition management of geriatric surgical patients. Surg Clin North Am. 2011;91:877-96.
6. Félix LN, Souza EMT. Avaliação nutricional de idosos em uma instituição por
diferentes instrumentos. Revista de Nutrição. 2009;22:571-80.
7. Frisancho AR. Anthropometric standards for the assessment of growth and
nutritional status. Michigan: The University of Michigan Press; 1990. 8. Holyday M, Daniells S, Bare M, Caplan GA, Petocz P, Bolin T. Malnutrition
screen-ing and early nutrition intervention in hospitalized patients in acute aged care: a ran-domised controlled trial. The Journal of Nutrition Health & Aging. 2012;16:562-8. 9. Hsu WC, Tsai AC, Wang JY. Calf circumference is more effective than body mass index in predicting emerging care-need of older adults – results of a national cohort study. Clinical Nutrition. 2016;35:735-40.
10. Kondrup J, Allison SP, Elia M, Vellas B, Plauth M. ESPEN guidelines for nutrition screening 2002. Clinical Nutrition. 2003;22:415-21.
11. Kondrup J, Rasmussen HH, Hamberg O, Stanga Z, ESPEN Working Group. Nutritional risk screening (NRS 2002): a new method based on an analysis of controlled clinical trials. Clinical Nutrition. 2003;22:321-36.
12. Kuzuya M, Kanda S, Koike T, Suzuki Y, Iguchi A. Lack of correlation between total lymphocyte count and nutritional status in the elderly. Clinical Nutrition. 2005;24:427-32.
13. Lara-Pulido A, Guevara-Cruz M. Malnutrition and associated factors in elderly hospitalized. Nutrición Hospitalaria. 2012;27:652-5.
14. Lipschitz DA. Screening for nutritional status in the elderly. Prim Care. 1994;22:55-67.
15. O’Daly BJ, Walsh JC, Quinlan JF, Falk GA, Stapleton R, Quinlan WR, O’Rourke SK. Serum albumin and total lymphocyte count as predictors of outcome in hip fractures. Clinical Nutrition. 2010;29:89-93.
16. Poulia KA, Yannakoulia M, Karageorgou D, Gamaletsou M, Panagiotakos DB, Sipsas NV, Zampelas A. Evaluation of the eficacy of six nutritional screening tools to predict malnutrition in the elderly. Clinical Nutrition. 2012;31:378-5. 17. Santos CA, Rosa COB, Ribeiro AQ, Ribeiro RCL. Patient-generated subjective
global assessment and classic anthropometry: comparison between the methods in detection of malnutrition among elderly with câncer. Nutrición Hospitalaria. 2015;31:384-92.
18. SAS System for Windows (Statistical Analysis System), version 9.4. SAS Institute Inc, 2002-12, Cary, NC, USA.
19. Shpata V, Ohri I, Nurka T, Prendushi X. The prevalence and consequences of malnutrition risk in elderly albanian intensive care unit patients. Clinical Inter-ventions in Aging. 2015;10:481-6.
20. Tabachnick BG, Fidell LS. Using Multivariate Statistics. 4 ed. Allyn&Bacon. Needham Heights. MA. USA. 2001.
21. Tsai ACH, Lai MC, Chang TL. Mid-arm and calf circumferences (MAC and CC) are better than body mass index (BMI) in predicting health status and mortality risk in institutionalized elderly Taiwanese. Archives of Gerontology and Geriatrics. 2012;54:443-7.
22. Wijnhoven HAH, van Bokhorst-de van der Schueren MAE, Heymans MW, de Vet HCW, Kruizenga HM, Twisk JW, Visser M. Low Mid-Upper Arm Circumference, Calf Circumference, and Body Mass Index and Mortality in Older Persons. J Gerontol A Biol Sci Med Sci. 2010;65A:1107-14.
23. World Health Organization. Physical status: the use and interpretation of anthro-pometry: report of a WHO Expert Committee. Geneva: WHO; 1995. 24. Wu ML, Courtney MD, Shortridge-Baggett LM, Finlayson K, Isenring EA.