AMTD
8, 2143–2189, 2015Optical depths of semi-transparent
cirrus clouds
A. Garnier et al.
Title Page
Abstract Introduction
Conclusions References
Tables Figures
◭ ◮
◭ ◮
Back Close
Full Screen / Esc
Printer-friendly Version Interactive Discussion
Discussion
P
a
per
|
Discussion
P
a
per
|
Discussion
P
a
per
|
Discussion
P
a
per
|
Atmos. Meas. Tech. Discuss., 8, 2143–2189, 2015 www.atmos-meas-tech-discuss.net/8/2143/2015/ doi:10.5194/amtd-8-2143-2015
© Author(s) 2015. CC Attribution 3.0 License.
This discussion paper is/has been under review for the journal Atmospheric Measurement Techniques (AMT). Please refer to the corresponding final paper in AMT if available.
Optical depths of semi-transparent cirrus
clouds over oceans from CALIPSO
infrared radiometer and lidar
measurements, and an evaluation of the
lidar multiple scattering factor
A. Garnier1, J. Pelon2, M. A. Vaughan3, D. M. Winker3, C. R. Trepte3, and
P. Dubuisson4
1
Science Systems and Applications Inc., Hampton, VA, USA
2
Laboratoire Atmosphères, Milieux, Observations Spatiales, UPMC-UVSQ-CNRS, Paris, France
3
NASA Langley Research Center, Hampton, VA, USA
4
Laboratoire d’Optique Atmosphérique, Université Lille 1, Lille, France
Received: 31 December 2014 – Accepted: 16 February 2015 – Published: 25 February 2015
Correspondence to: A. Garnier ([email protected])
AMTD
8, 2143–2189, 2015Optical depths of semi-transparent
cirrus clouds
A. Garnier et al.
Title Page
Abstract Introduction
Conclusions References
Tables Figures
◭ ◮
◭ ◮
Back Close
Full Screen / Esc
Printer-friendly Version Interactive Discussion
Discussion
P
a
per
|
Discussion
P
a
per
|
Discussion
P
a
per
|
Discussion
P
a
per
|
Abstract
This paper provides a detailed evaluation of cloud absorption optical depths retrieved at 12.05 µm and comparisons to extinction optical depths retrieved at 0.532 µm from perfectly co-located observations of single-layered semi-transparent cirrus over ocean made by the Imaging Infrared Radiometer (IIR) and the Cloud and Aerosol Lidar with
5
Orthogonal Polarization (CALIOP) flying on-board the CALIPSO (Cloud-Aerosol Lidar and Infrared Pathfinder Satellite Observations) satellite. The blackbody radiance taken in the IIR Version 3 algorithm is evaluated, and IIR retrievals are corrected accordingly. IIR infrared absorption optical depths are then compared to CALIOP visible extinction optical depths when the latter can be directly derived from the measured apparent
2-10
way transmittance through the cloud. Numerical simulations and IIR retrievals of ice crystal sizes suggest that the ratios of CALIOP extinction and IIR absorption optical depths should remain roughly constant with respect to temperature. Instead, these ratios are found to increase quasi-linearly by about 40 % as the temperature at the layer centroid altitude decreases from 240 to 200 K. This behavior is explained by variations
15
of the multiple scattering factorηTto be applied to correct the measured transmittance,
which is taken equal to 0.6 in the CALIOP Version 3 algorithm, and which is found here to vary with temperature (and hence cloud particle size) fromηT=0.8 at 200 K toηT=
0.5 at 240 K for clouds with optical depth larger than 0.3. The revised parameterization ofηTintroduces a concomitant temperature dependence in the simultaneously derived
20
CALIOP lidar ratios that is consistent with observed changes in CALIOP depolarization ratios and particle habits derived from IIR measurements.
1 Introduction
Cirrus clouds are widely distributed over the globe. Most cirrus exhibit compensat-ing thermal and solar radiative effects, with the net effect depending on optical depth
25
AMTD
8, 2143–2189, 2015Optical depths of semi-transparent
cirrus clouds
A. Garnier et al.
Title Page
Abstract Introduction
Conclusions References
Tables Figures
◭ ◮
◭ ◮
Back Close
Full Screen / Esc
Printer-friendly Version Interactive Discussion
Discussion
P
a
per
|
Discussion
P
a
per
|
Discussion
P
a
per
|
Discussion
P
a
per
|
of cirrus optical depths and properties are required to reliably assess their radiative impacts (Sassen et al., 2008). Ideally, these measurements would be validated using wholly independent retrievals from different instruments using different measurement techniques that have largely or wholly independent sources of uncertainty. While this multi-instrument approach is conceptually straightforward, there are typically a number
5
of practical difficulties (e.g., accurate spatial and temporal matching) that make full real-ization of the technique somewhat challenging. The sensor design and selection for the Cloud-Aerosol Lidar and Infrared Pathfinder Satellite Observations (CALIPSO) mission (Winker et al., 2010) obviates most of these concerns. The instrumentation aboard the CALIPSO satellite includes CALIOP (i.e., the Cloud and Aerosol Lidar with Orthogonal
10
Polarization), a two-wavelength (532 and 1064 nm), polarization-sensitive (at 532 nm) elastic backscatter lidar (Hunt et al., 2009), a 3-channel Imaging Infrared Radiometer (IIR) operating in the 8–12 µm thermal infrared spectral range (Corlay et al., 2000), and a Wide Field Camera (WFC) operating in the visible domain (Pitts et al., 2007). These instruments are assembled in a staring and near-nadir-looking configuration.
15
The cross-track swaths of the passive sensors are centered on the lidar footprint so that observations from all three instruments are almost perfectly collocated in both time and space. The combined measurements thus allow highly detailed comparison studies that are not subject to collocation uncertainties or concerns about view angle differences.
20
CALIOP cirrus visible optical depths are total extinction optical depths retrieved us-ing one of two different and totally independent techniques. The first method is the so-called “constrained retrieval”, in which the “apparent” cloud optical depth is derived from the 2-way transmittance as measured from molecular scattering above and below the cloud layer. The cloud optical depth is then derived with an instrument-specific
cor-25
AMTD
8, 2143–2189, 2015Optical depths of semi-transparent
cirrus clouds
A. Garnier et al.
Title Page
Abstract Introduction
Conclusions References
Tables Figures
◭ ◮
◭ ◮
Back Close
Full Screen / Esc
Printer-friendly Version Interactive Discussion
Discussion
P
a
per
|
Discussion
P
a
per
|
Discussion
P
a
per
|
Discussion
P
a
per
|
2012) and opaque water clouds (Hu et al., 2007). In the second method, called “un-constrained retrievals” (Young and Vaughan, 2009), optical depth estimates are derived using a priori assumptions about the layer extinction-to-backscatter ratio, a quantity also known as the lidar ratio,Scal, and about the layer multiple scattering factor,η. The
accuracy of the optical depth estimates obtained in this manner depends critically on
5
the accuracy of the assumed apparent lidar ratioS∗, which is defined as the product of
Scalandη.
The only constrained retrieval target currently implemented in the standard CALIOP analyses is clear air. It has long been recognized that when the scattering character-istics of the ambient molecular atmosphere are well known (e.g., from models or
raw-10
insonde measurements), the apparent two-way transmittance of a layer can be mea-sured directly whenever sufficiently clean air is found immediately above and below the layer (Young, 1995; Elouragini and Flamant, 1996; del Guasta, 1998; Chen et al., 2002; Yorks et al., 2011). The main advantage of the “constrained retrieval” technique is that it does not require an a priori assumption about the apparent lidar ratio. On the contrary,
15
because the layer apparent optical depth has been measured, accurate estimates of
S∗can be retrieved by applying the constrained retrieval technique to suitable CALIOP data (Young and Vaughan, 2009; Young et al., 2013).
In order to extend the constrained approach, Platt (1973) proposed a combined ra-diometric and lidar retrieval to more fully characterize cirrus cloud properties. In this
20
paper, the relationship between infrared absorption and visible extinction optical depth is investigated in detail, based on heritage from the pioneering work of C. M. R. Platt in the 1970s, which is applied here to global space-borne observations. Infrared absorp-tion optical depths retrieved from IIR observaabsorp-tions of single-layered cirrus clouds at 12.05 µm are compared to the visible optical depths derived by applying CALIOP’s
con-25
op-AMTD
8, 2143–2189, 2015Optical depths of semi-transparent
cirrus clouds
A. Garnier et al.
Title Page
Abstract Introduction
Conclusions References
Tables Figures
◭ ◮
◭ ◮
Back Close
Full Screen / Esc
Printer-friendly Version Interactive Discussion
Discussion
P
a
per
|
Discussion
P
a
per
|
Discussion
P
a
per
|
Discussion
P
a
per
|
tical depths from the CALIPSO IIR measurements is described in depth by Garnier et al. (2012a). A substantial review of this method is given below. These analyses use version 3 CALIOP Level 2 5 km cloud layer products and the corresponding version 3 IIR Level 2 track products (Powell et al., 2013). The paper is constructed as follows. Retrieval techniques, sources of uncertainty, and expected ratios between retrievals in
5
the visible and in the infrared are presented in Sect. 2. In the IIR algorithm, emissivity and absorption optical depth are retrieved assuming an isothermal cloud layer of equiv-alent temperature inferred from the CALIOP layer detection algorithm. This technique is assessed in Sect. 3. CALIOP and IIR retrievals are then compared and discussed in Sect. 4. Using analyses organized around the specifics of each algorithm and cloud
10
characteristics such as optical depth and temperature, the CALIOP multiple scattering factor derived from these comparisons is evaluated. Section 5 provides a summary of the work and presents our conclusions about the effectiveness of these multi-sensor analyses.
2 CALIPSO retrieval techniques
15
2.1 CALIOP
A detailed overview of CALIOP retrievals can be found in Winker et al. (2009) and the works cited therein. Here we provide only a brief synopsis. The CALIOP Level 1 calibrated 532 nm total attenuated backscatter profiles are used to detect scattering layers with horizontal resolutions of 5, 20 or 80 km, defined by the amount of
aver-20
aging required to detect the layers (Vaughan et al., 2009). After discriminating be-tween clouds and aerosols (Liu et al., 2009), cloud layers are further classified ac-cording to thermodynamic phase and crystal habit as water clouds, randomly-oriented ice clouds, or horizontally-oriented ice clouds (Hu et al., 2009). Cirrus cloud optical depths are then retrieved by CALIOP’s Hybrid Extinction Retrieval Algorithms (HERA)
25
AMTD
8, 2143–2189, 2015Optical depths of semi-transparent
cirrus clouds
A. Garnier et al.
Title Page
Abstract Introduction
Conclusions References
Tables Figures
◭ ◮
◭ ◮
Back Close
Full Screen / Esc
Printer-friendly Version Interactive Discussion
Discussion
P
a
per
|
Discussion
P
a
per
|
Discussion
P
a
per
|
Discussion
P
a
per
|
In version 3 of the CALIPSO data products, the HERA module identifies those layers for which constrained solutions are considered feasible by requiring that the estimated relative uncertainty in the derived lidar ratio be less than 40 %. The apparent two-way transmittance of these layers can then be obtained directly from the ratio of the mean attenuated scattering ratios in clear air regions above and below the cloud; i.e.,
5
Tapparent2 =hR′ibelow/hR′iabove. The visible optical depth is simply
τvis=
−lnTapparent2
2η (1)
where division byηrepresents the required correction of the measured transmittance for multiple scattering. Because solar background illumination injects large amounts of noise into the CALIOP daytime backscatter signal, the signal-to-noise ratios (SNR)
10
needed to satisfy this rather stringent requirement are almost never found in CALIOP daytime measurements. As a consequence, CALIOP version 3 constrained retrievals are available almost exclusively during nighttime (Young and Vaughan, 2009). Un-certainties in CALIOP optical depth retrievals are described extensively in Young et al. (2013).
15
2.2 IIR
The IIR is a passive instrument providing calibrated radiances in 3 channels in the at-mospheric window (8.65, 10.6, and 12.05 µm), with a medium spectral resolution of about 1 µm, and a spatial resolution of 1 km per pixel over a 69 km swath. IIR radiances are sensitive to absorbing clouds and to mineral dusts. The IIR 12.05 µm channel,
20
which exhibits the largest absorption by cirrus clouds, is chosen for this analysis. The pixels located at the center of the 69 km swath are precisely collocated with CALIOP lidar foot-print, and thus a vertically resolved description of the atmospheric column associated with passive IIR observations is obtained from CALIOP active measure-ments. IIR retrievals rely on cloud and aerosol detections from CALIOP, and as IIR
AMTD
8, 2143–2189, 2015Optical depths of semi-transparent
cirrus clouds
A. Garnier et al.
Title Page
Abstract Introduction
Conclusions References
Tables Figures
◭ ◮
◭ ◮
Back Close
Full Screen / Esc
Printer-friendly Version Interactive Discussion
Discussion
P
a
per
|
Discussion
P
a
per
|
Discussion
P
a
per
|
Discussion
P
a
per
|
observations are not vertically resolved, the most suitable scenes are those containing only one single cloud layer in the column. Scenes containing low opaque water clouds, also analyzed by the IIR algorithm, are not included in this study. In addition, scenes containing depolarizing aerosol layers such as mineral dust are discarded.
Cloud absorption is characterized through its emissivity ε, where (Platt and
Gam-5
bling, 1971; Platt, 1973; Garnier et al., 2012a)
ε= RBG−Rm
RBG−RBB
, (2)
and cloud absorption optical depthτais subsequently derived using
τa=−ln(1−ε). (3)
In Eq. (2),Rmis the measured calibrated radiance,RBG is the background radiance at
10
the top of the atmosphere that would be observed in the absence of the studied cloud, andRBBis the radiance of a blackbody source located at the cloud radiative altitude.
Uncertainty in the emissivity includes 3 components associated with errors on Rm, RBG, andRBBand is inversely proportional to the radiative contrast RBG–RBB (Garnier et al., 2012a). In other words, the colder the cloud with respect to the underlying scene,
15
the smaller the uncertainty in the emissivity retrievals. Similarly, the error dτa onτais
written
dτa=(1/1−ε)·dRm′ +(ε/1−ε)·dRBB′ +dR
′
BG, (4)
where the quantity dRx′ is the error on the radiance Rx weighted by the inverse of the radiative contrast, and where the subscriptx refers to m, BB or BG.
20
In Eq. (4), each term dRx′ is related to the error on the equivalent brightness temper-ature dTx as
dRx′ =∂Rx
∂T ·dTx·
1
RBG−RBB
AMTD
8, 2143–2189, 2015Optical depths of semi-transparent
cirrus clouds
A. Garnier et al.
Title Page
Abstract Introduction
Conclusions References
Tables Figures
◭ ◮
◭ ◮
Back Close
Full Screen / Esc
Printer-friendly Version Interactive Discussion
Discussion
P
a
per
|
Discussion
P
a
per
|
Discussion
P
a
per
|
Discussion
P
a
per
|
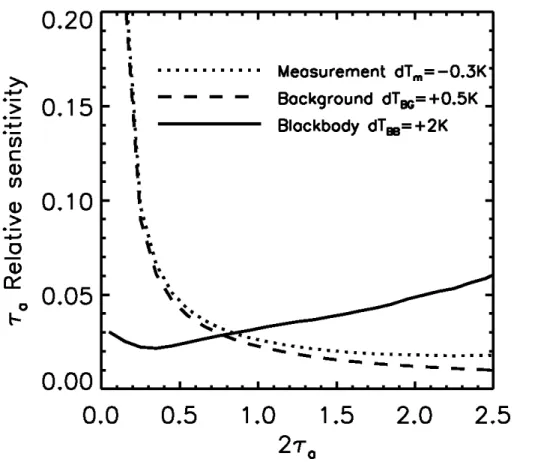
Each term in Eq. (4) represents the sensitivity ofτato each of the 3 quantities involved
in the computation of τa. Uncertainty estimates are derived after assessing the
ran-dom and systematic errors dTm, dTBG, and dTBB. As an illustration, Fig. 1 shows the
relative sensitivity dτa/τa to dTm=−0.3 K, dTBG= +0.5 K, and dTBB= +2 K for cirrus
clouds. The rationale for this choice of values is given below. The variation dτa, BGdue
5
to a variation dRBG′ of the weighted background radiance does not depend onε, and the relative variation dτa, BG/τa (dashed line) decreases withτa, more rapidly for 2τa
smaller than 0.3. A similar behavior is seen for the measured radiance (dotted line). However, the relative variation ofτa due to a variation of dTBB increases steadily with τa(solid line).
10
The on-board measured calibrated radiances have been validated by comparison with airborne observations (Sourdeval et al., 2012). The value dTm=±0.3 K is based
on the noise equivalent differential temperature and calibration accuracy as assessed by the Centre National d’Etudes Spatiales (CNES) and is taken as a random error in the final uncertainty assessment.
15
BothRBG andRBBin Eq. (2) are inferred in synergy with CALIOP observations and
so too are the respective uncertainty estimates dTBGand dTBB(Garnier et al., 2012a).
The background radiance,RBG, is preferably retrieved from cloud-free observations
in neighboring pixels along track as identified by CALIOP at a distance chosen to be smaller than 100 km from the analyzed pixel. If these conditions are not found,RBG is
20
computed using the FASt RADiative (FASRAD) transfer model (Dubuisson et al., 2005) and ancillary atmospheric and surface data from the GEOS 5 model of the Global Modeling and Assimilation Office (Rienecker et al., 2008). These two ensembles of retrievals will be evaluated separately as their sources of uncertainty are different. For the first ensemble, that isRBG measured in neighboring pixels,RBG is derived purely
25
from observations and is expected to be unbiased with respect to measured radiances. A random error dTBG is assumed, which is arbitrarily augmented from 0.3 to 0.5 K to
AMTD
8, 2143–2189, 2015Optical depths of semi-transparent
cirrus clouds
A. Garnier et al.
Title Page
Abstract Introduction
Conclusions References
Tables Figures
◭ ◮
◭ ◮
Back Close
Full Screen / Esc
Printer-friendly Version Interactive Discussion
Discussion
P
a
per
|
Discussion
P
a
per
|
Discussion
P
a
per
|
Discussion
P
a
per
|
The blackbody radiance RBB is computed from the FASRAD model and the
ther-modynamic temperature, Tc, at the centroid altitude, Zc, of the CALIOP attenuated
backscatter profile at 532 nm within the cloud layer (Vaughan et al., 2005). This pa-rameter, derived from Level 1 CALIOP observations, is reported in the CALIOP 5 km layer product and is available as an input to the IIR Level 2 operational algorithm. In
5
order to assess possible systematic errors dTBB, the cloud radiative temperature, Tr,
can be computed a posteriori from CALIOP extinction profiles and compared with the temperatureTc. This analysis is detailed in Sect. 3. Subsequent systematic errors on
IIR optical depth and corrections will also be discussed. An additional random error of dTBB=2 K is assumed to account for possible errors in the atmospheric model.
10
Even though the IIR analyses take advantage of spatial information (e.g. cloud heights) derived from CALIOP collocated vertical profile observations, the IIR cloud optical properties retrievals are entirely independent from the CALIOP optical proper-ties retrievals. The measurement techniques used by the two sensors rely on different physical principles and hence are subject to very different sources of uncertainty. The
15
expected relationship between CALIOP and IIR optical depths is presented in the fol-lowing section.
2.3 Simulated relationships between CALIOP and IIR optical depths
Ratios of CALIOP cirrus visible extinction optical depth τvis to IIR absorption
opti-cal depth τa at 12.05 µm are simulated using the FASDOM radiative transfer model
20
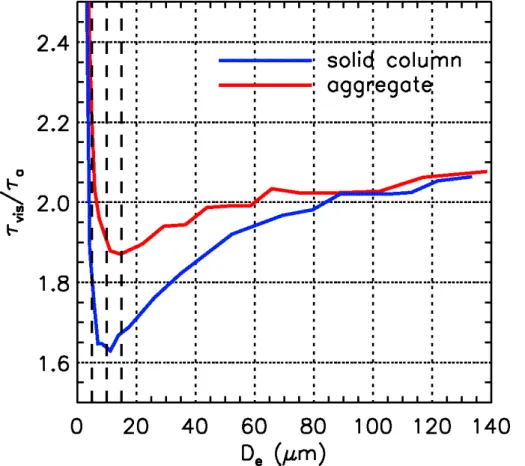
(Dubuisson et al., 2005, 2008) for an isothermal cloud and ice crystal optical proper-ties retrieved from pre-computed tables (Yang et al., 2005). Figure 2 shows simulated
τvis/τa ratios for clouds composed of hexagonal solid columns and of aggregates by
takingτa=0.25. Effective diameters (De) (x axis) are defined as 3/2 times the ratio
of volume to projected area (Mitchell et al., 2002). As seen in Fig. 2,τvis/τaincreases
25
asDeincreases forDelarger than 10–15 µm, from 1.7–1.9 at De equal to 20 µm up to
2.07 atDeequal to 140 µm. These simplified simulations, which assume mono-disperse
AMTD
8, 2143–2189, 2015Optical depths of semi-transparent
cirrus clouds
A. Garnier et al.
Title Page
Abstract Introduction
Conclusions References
Tables Figures
◭ ◮
◭ ◮
Back Close
Full Screen / Esc
Printer-friendly Version Interactive Discussion
Discussion
P
a
per
|
Discussion
P
a
per
|
Discussion
P
a
per
|
Discussion
P
a
per
|
size and habit and to establish thatτvis/τais expected to be around 2. A more detailed
discussion is given in Sect. 4. It is to be noted thatτa is not, strictly speaking, an
ab-sorption optical depth as it includes a small contribution from multiple scattering, which becomes more important as optical depth grows larger. Simulations show that τa is
increased by less than 3 % with respect to pure absorption optical depth atτaequal to
5
1.25, orτvisaround 2.5, which is the maximum value attained by the semi-transparent
cirrus clouds considered in this study.
3 Cloud radiative temperature
As seen in Sect. 2, cloud effective emissivity and hence infrared absorption optical depth are retrieved through a simple relationship (see Eq. 2) by considering an
isother-10
mal cloud of blackbody radianceRBB computed using the centroid temperature Tc at
the centroid altitudeZc. In this section, systematic errors in the blackbody brightness temperature dTBB resulting from this assumption are quantified. To do so, the cloud
radiative temperatureTr is computed a posteriori from CALIOP extinction profiles and
compared toTc, so that ultimately IIR retrievals can be corrected using Eqs. (4) and (5).
15
CALIOP extinction profiles are reported at 5 km horizontal resolution and are de-rived from the exact same attenuated backscatter profiles that are used to compute the centroid altitudes reported in the 5 km layer products. As the intent is to evaluate IIR retrievals, analyses are conducted for single-layered semi-transparent cirrus clouds over ocean. Data selection is further restricted to the subset of cirrus clouds composed
20
of randomly oriented ice (ROI) crystals for which the ice-water phase classification is reported with high confidence. In addition, possible contamination from mixed-phase clouds is minimized by restricting the analysis to clouds whose temperature at base altitude is colder than−20◦C (Hu et al., 2010). CALIOP optical depths and extinction profiles are retrieved from the constrained technique described previously. The time
25
AMTD
8, 2143–2189, 2015Optical depths of semi-transparent
cirrus clouds
A. Garnier et al.
Title Page
Abstract Introduction
Conclusions References
Tables Figures
◭ ◮
◭ ◮
Back Close
Full Screen / Esc
Printer-friendly Version Interactive Discussion
Discussion
P
a
per
|
Discussion
P
a
per
|
Discussion
P
a
per
|
Discussion
P
a
per
|
Each cloud is composed of a numbernof vertical binsi of resolutionδz, withi =1 to
i=nextending from base to top. Emissivity in bini is notedε(i) and absorption optical depth derived from Eq. (3) isτa(i). By applying Eq. (2) successively to each of the bins,
from cloud base to cloud top, it is found that the cloud blackbody radianceRBBcan be
expressed as
5
RBB= Pi=n
i=1ε(i)·RBB(i)·e
−Pj=n+1
j=i+1τa(j)
Pi=n
i=1ε(i)·e
−Pj=n+1
j=i+1τa(j)
, (6)
whereRBB(i) is the blackbody radiance of bin i of thermodynamic temperature T(i),
and whereτa(n+1) represents absorption above the cloud.
The denominator in Eq. (6) represents the cloud emissivity. The cloud blackbody ra-diance can be seen as the centroid rara-diance of the attenuated emissivity profile, with
10
the attenuation term corresponding to the infrared transmittance above the bini. This expression has been validated by comparingRBB from Eq. (6) and from the FASRAD
model. In Eq. (6), absorption by gases such as water vapor and ozone in the cirrus cloud is neglected, so that absorption is assumed to be purely due to the cloud. This simplification has no impact on the result forτa larger than 0.2 and otherwise biases
15
RBBby only 0.4 K of equivalent brightness temperature whenτatends to zero.
Assum-ing a ratior between CALIOP visible optical depthτvisand IIR absorption optical depth τa, Eq. (6) can be re-written as a function of the CALIOP cloud extinction coefficientα
(in km−1) andr, as
RBB= Pi=n
i=1(1−e
−
[α(i)·δz/r])·RBB(i)·e−Pjj==ni+1+1[α(j)·δz/r]
Pi=n
i=1(1−e−[α(i)·δz/r])·e
−Pj=n+1
j=i+1[α(j)·δz/r]
. (7)
20
The temperatureTris derived from the blackbody radianceRBBcomputed using Eq. (7).
AMTD
8, 2143–2189, 2015Optical depths of semi-transparent
cirrus clouds
A. Garnier et al.
Title Page
Abstract Introduction
Conclusions References
Tables Figures
◭ ◮
◭ ◮
Back Close
Full Screen / Esc
Printer-friendly Version Interactive Discussion
Discussion
P
a
per
|
Discussion
P
a
per
|
Discussion
P
a
per
|
Discussion
P
a
per
|
2±20 % to evaluate the sensitivity of RBB tor. The vertical resolution δz is equal to
0.06 km in the CALIOP profiles products.
On the other hand, the centroid altitudeZccan be written as
Zc= Pi=n
i=1Z(i)·(βpart(i)+βmol(i))·e
−2Pj=n
j=i[ηαpart(j)+αmol(j)]·δz
Pi=n
i=1(βpart(i)+βmol(i))·e
−2Pj=n
j=i[ηαpart(j)+αmol(j)]·δz
(8)
whereZ(i) is the altitude of bin i,βpart(i) andβmol(i) are, respectively, the particulate
5
and molecular components of the total backscatter (in sr−1km−1),αpart(i) and αmol(i)
are, respectively, the particulate and molecular extinction coefficients (in km−1), and
η represents the required correction for multiple scattering introduced in Sect. 2.1. Equation (8) exhibits interesting similarities with Eq. (7). As radiance and altitude vary quasi-linearly with temperature within a few kilometer deep layer, Eqs. (7) and (8) are
10
effectively two different weighted averages of the cloud temperature profile. In both cases, the weight is composed of the product of a transmittance term and of a multi-plying term. For cirrus clouds of sufficient optical depth, the molecular contribution is weak compared to the particulate one, and the transmittance term in Eq. (8) is driven by 2ηα(j) or 1.2α(j) assumingη=0.6 for CALIOP observations, which is larger than
15
α(j)/rin Eq. (7), orα(j)/2 ifr=2. Thus, the smaller transmittance term in Eq. (8) com-pared to the one in Eq. (7) tends to provideZc higher than the radiative cloud altitude
for observations from the top of the atmosphere. However, this is partly compensated by the multiplying terms. Indeed, in Eq. (8), the multiplying term is roughly proportional to the bin absorption optical depthτa(i)=α(i)·δz/r, because the lidar ratio is taken
20
constant in CALIOP extinction retrievals (Young and Vaughan, 2009). Therefore, the multiplying term in Eq. (8) can be seen as τa(i), which is larger than the multiplying term in Eq. (7), that is the emissivityε(i).
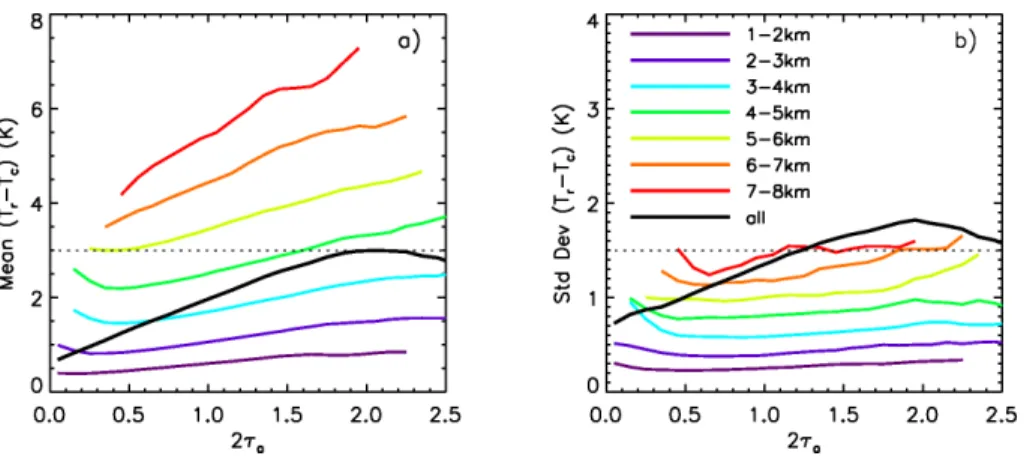
Overall, the temperatureTrderived from Eq. (7) is found to be warmer than the
tem-peratureTcderived from Eq. (8) as seen in Fig. 3a, where meanTr−Tcdifferences are
25
AMTD
8, 2143–2189, 2015Optical depths of semi-transparent
cirrus clouds
A. Garnier et al.
Title Page
Abstract Introduction
Conclusions References
Tables Figures
◭ ◮
◭ ◮
Back Close
Full Screen / Esc
Printer-friendly Version Interactive Discussion
Discussion
P
a
per
|
Discussion
P
a
per
|
Discussion
P
a
per
|
Discussion
P
a
per
|
up to 7–8 km (colored lines), and for all observations (black line). TheTr−Tcdifferences
represent systematic errors dTBBon the blackbody brightness temperature used in the
IIR standard retrievals. They are primarily driven by the cloud geometric thickness∆z
and increase quasi-linearly with optical depth (2τa) for a given ∆z, with a slope close
to zero for∆z in 1–2 km and that increases up to 1.5 K per unit optical depth for ∆z
5
between in 7–8 km. On average, the bias increases with 2τa(black curve) from 0.5 to
3 K because optical depth and geometric thickness are not fully independent. Standard deviations are between 0.2 and 1.5 K (Fig. 3b) and include variability due to the fact thatTr−Tc varies with the shape of the extinction profile for a given optical depth and
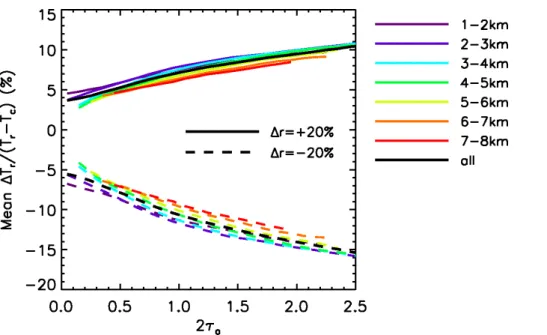
a given geometric thickness. Biases shown in Fig. 3a have been retrieved assuming
10
an a priori valuer=2. Sensitivity to this assumption is seen in Fig. 4, showing relative variations ∆Tr/(Tr−Tc) of Tr−Tc when r is changed to 2.4 (∆r = +20 %, solid lines)
and to 1.6 (∆r=−20 %, dashed lines), to cover a range of possible values according to the simulations (Fig. 2). As will be shown in Sect. 4, assumingr between 1.6 and 2.4 also allows covering the range of retrieved values. Increasing the ratior =τvis/τa
15
does decreaseτaasτvisis set from CALIOP retrievals, and the radiative temperature is
increased (∆Tr/(Tr−Tc) is positive). The opposite behavior is found when the ratior is
decreased. The estimated bias dTBB=Tr−Tcshown in Fig. 3a forr=2 is found to vary
by less than 16 % in the worst case, which is for 2τa=2.5 and∆r=−20 %. Therefore,
the bias dTBB is estimated in the following by takingr =2.
20
Correcting for a bias dTBB ranging between 0.5 K at 2τa≈0 and 7 K at 2τa=2 as
seen in Fig. 3a induces a relative increase of τa between 0.5 and 17 % according
to Fig. 1 and, on average, the largest increase is 7 % for dTBB=3 K at 2τa=2. In
the following, CALIOP and IIR retrievals will be compared before and after correcting IIR absorption optical depths for those biases, in order to assess the impact on the
25
AMTD
8, 2143–2189, 2015Optical depths of semi-transparent
cirrus clouds
A. Garnier et al.
Title Page
Abstract Introduction
Conclusions References
Tables Figures
◭ ◮
◭ ◮
Back Close
Full Screen / Esc
Printer-friendly Version Interactive Discussion
Discussion
P
a
per
|
Discussion
P
a
per
|
Discussion
P
a
per
|
Discussion
P
a
per
|
4 Comparison of IIR and CALIOP retrievals
CALIOP and IIR cirrus retrievals are evaluated through ratios of CALIOP visible optical depthτvisto IIR absorption optical depthτa. Data selection is the same as in Sect. 3. IIR
absorption optical depths, reported at 1 km pixel resolution under the lidar track in the Level 2 products, are averaged to a 5 km horizontal resolution to match the resolution
5
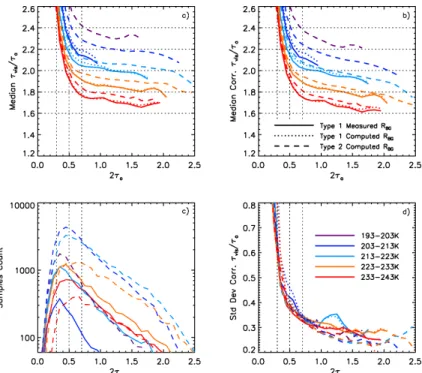
at which CALIOP optical depth is reported in the 5 km cloud layer products. Median
τvis/τa ratios during 2008 in the 25
◦
S–25◦N latitude band are plotted against 2τa in
Fig. 5. Figure 5a is from the standard products whereas Fig. 5b is obtained with τa
corrected by using the cloud blackbody radianceRBB derived from CALIOP extinction
profiles as described in Sect. 3. In order to simultaneously evaluate biases due to the
10
background radianceRBG as presented in Sect. 2, results are plotted by segregating
type 1 clouds, defined as the clouds for which a measuredRBG is available and used
to retrieve τa (solid lines), from type 2 clouds, for which RBG is from computations
(dashed lines). Furthermore, retrievals from computedRBG are also plotted for type 1
clouds (dotted lines), for comparison with the standard retrievals (solid line). Finally,
15
theτvis/τa ratios are shown for several ranges in centroid temperatureTc. Figure 5c
shows the number of samples used to build the statistics. The standard deviation of theτvis/τaratios plotted in Fig. 5d is found similar whenτais from standard products or
corrected for the cloud radiative temperature. Figure 5 shows that the medianτvis/τa
ratios are overall within the ranges of expected values according to the simulations
20
shown in Fig. 2. Figure 5 also contains pieces of information about systematic errors on IIR and CALIOP retrievals, which are discussed first. The retrievedτvis/τaratios and their variations withTcas seen in both Fig. 5a and b are discussed afterwards.
4.1 Systematic errors: IIR
τvis/τa ratios derived for type 1 clouds from measured RBG (Fig. 5, solid lines) are
25
AMTD
8, 2143–2189, 2015Optical depths of semi-transparent
cirrus clouds
A. Garnier et al.
Title Page
Abstract Introduction
Conclusions References
Tables Figures
◭ ◮
◭ ◮
Back Close
Full Screen / Esc
Printer-friendly Version Interactive Discussion
Discussion
P
a
per
|
Discussion
P
a
per
|
Discussion
P
a
per
|
Discussion
P
a
per
|
τafrom measuredRBG(solid line) by less than 2 % at 2τa=0.7. As, according to Fig. 1,
an error dTBG=0.5 K induces a relative error inτaequal to 3.5 % at 2τa=0.7, this
indi-cates a bias dTBG=0.3 K in the computations. On the other hand, as seen in Sect. 3,
the correction ofRBB increases τa and as expected, the τvis/τa ratios in Fig. 5b are
smaller than in Fig. 5a. For type 1 clouds, it is seen that the correctedRBB decreases
5
theτvis/τaratio by less than 5 % for the largest optical depths.
Type 1 and type 2 clouds are mutually exclusive and appear to have different proper-ties. The fraction of type 2 clouds is larger at colder temperatures (see Fig. 5c, dashed lines), and the number of type 1 clouds is not significant at 193–203 K. In addition, most of the type 1 clouds have a geometric thickness∆zbetween 1.5 and 3 km whereas type
10
2 clouds are deeper, with∆z mostly between 3 and 6 km and up to 8 km (not shown). Therefore, the blackbody correction is overall larger for type 2 clouds than for type 1 ones (Fig. 3a). As a result, a better agreement between τvis/τa from type 1 (dotted
lines) and from type 2 (dashed) clouds is clearly noted after correction (Fig. 5b) than before correction (Fig. 5a) for the largest 2τa between 1 and 1.5. After correction, the
15
overall difference is 1 to 5 % at 2τa=0.7, which is possibly due to additional biases
of 0.2 to 0.8 K (Fig. 1) in the computed RBG, even though actual differences of the τvis/τa ratios cannot be ruled out as two distinct ensembles of clouds are compared.
Further analyses of the differences between observations and computations are being conducted to help inform and improve future versions of the IIR science data products.
20
Theτvis/τaratio exhibits a sharp decrease of about 40 % from 2τa=0.3 to 2τa=0.5
for each temperature range, and decreases slowly by about 10 % from 2τa=0.7 to
2τa=2.5. This behavior is observed for both type 1 and type 2 clouds. As for type 1
clouds (solid lines)RBGis from neighboring observations, biases in IIRτaretrievals do
not seem to be a tenable explanation. As a consequence, possible biases in CALIOP
25
AMTD
8, 2143–2189, 2015Optical depths of semi-transparent
cirrus clouds
A. Garnier et al.
Title Page
Abstract Introduction
Conclusions References
Tables Figures
◭ ◮
◭ ◮
Back Close
Full Screen / Esc
Printer-friendly Version Interactive Discussion
Discussion
P
a
per
|
Discussion
P
a
per
|
Discussion
P
a
per
|
Discussion
P
a
per
|
4.2 Systematic errors: CALIOP
In the version 3 data products, CALIOP optical depth is retrieved using the constrained technique only when the estimated relative uncertainty in the derived lidar ratio is less than 40 %. This relative uncertainty increases rapidly for small optical depths (Young et al., 2013) and typically, optical depths smaller than 0.3 are retrieved using the
uncon-5
strained technique. Because the signal is noisy, optical depth distributions derived from constrained retrievals are increasingly truncated as actual optical depth decreases, be-cause a larger fraction of these small optical depths do not satisfy the estimated relative uncertainty requirement and thus are excluded from the sample data set. This leads to an increasing high bias in constrained optical depthsτvis as optical decreases, which
10
explains the sharp increase of theτvis/τaratio as 2τadecreases.
When the constrained technique is not selected, optical depth is retrieved using the unconstrained technique and a default lidar ratio. Nevertheless, whenever measure-ments of layer two-way transmittance can be made, this apparent transmittance is also reported in the CALIOP products. Optical depths for these layers can then be directly
15
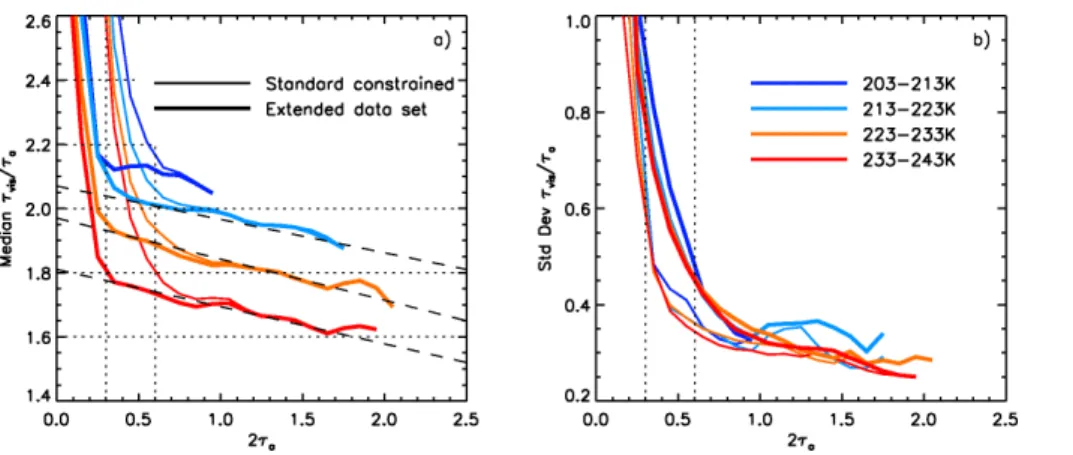
inferred, as is done for the standard constrained retrievals. An extended set of CALIOP optical depth measurements is thus obtained, still limited to nighttime data, which is compared to IIR τa retrievals. Median τvis/τa ratios for the standard constrained
re-trievals (thin lines) and for the extended optical depth data set (thick lines) are shown in Fig. 6a for type 1 clouds only for more clarity, after correction of IIRτa for the cloud
20
radiative temperature, and again, for several ranges in temperatureTc. Associated
stan-dard deviations are plotted in Fig. 6b. For the extended data set (thick lines), theτvis/τa
ratios now increase steadily from the largest optical depths down to 2τa=0.3,
suggest-ing that the extended CALIOP optical depth distributions are not as biased for this data set. A sharp increase of theτvis/τaratio is still seen for 2τasmaller than 0.3, as this
ra-25
ra-AMTD
8, 2143–2189, 2015Optical depths of semi-transparent
cirrus clouds
A. Garnier et al.
Title Page
Abstract Introduction
Conclusions References
Tables Figures
◭ ◮
◭ ◮
Back Close
Full Screen / Esc
Printer-friendly Version Interactive Discussion
Discussion
P
a
per
|
Discussion
P
a
per
|
Discussion
P
a
per
|
Discussion
P
a
per
|
tios are larger for the extended than for the standard constrained data set, suggesting larger random errors because CALIOP distributions are not as severely truncated in the former case. Implications are threefold. First, this confirms that IIRτaretrievals are
not biased by unidentified issues. Secondly, this highlights a systematic bias at any temperature in CALIOP standard constrained retrievals (thin lines) for optical depths
5
smaller than about 0.6, which is of the order of +50 % at 2τa=0.3. This translates
into similar relative biases in the retrieved lidar ratios, which is of importance when cirrus lidar ratios derived from constrained retrievals are used to evaluate the default lidar ratio used in unconstrained retrievals (Garnier et al., 2012b). Finally, this shows that the constrained technique could be improved, in the mean, by relaxing the
thresh-10
old in the relative lidar ratio uncertainties used in version 3 of the CALIOP algorithm, notwithstanding the large dispersion.
4.3 Retrievedτvis/τaratios
In the following, the retrieved median τvis/τa ratios are discussed. Results obtained afterτais corrected for cloud radiative temperature are considered. As seen in Figs. 5
15
and 6, the ratios are found to increase by about 10 % as the temperatureTcdecreases
by 10 K. The ratios derived from type 1 clouds are found between 1.6 at 233–243 K and 2.1 at 203–213 K, with a standard deviation of the order of 0.3 at 2τalarger than
1. For type 2 clouds, the ratios are larger by 2 to 5 %, which could be partly explained by possible biases on IIRτaretrievals. Nevertheless, as both type 1 and type 2 clouds
20
exhibit the same behavior with respect to temperature, they will be combined in the following analyses. To reduce the impact of biases, subsequent analyses are limited to cases for which 2τa is larger than 0.3. Also, CALIOP extended optical depth retrievals
are chosen to avoid biases in CALIOP standard constrained retrievals. For a given temperature, the ratios decrease by about 10 % from 2τa=0.3 to 2τa=2, as seen in
25
Fig. 6a. This may be due partly to an increasing contribution of multiple scattering in
τa, yet expected to not increase by more than 2 % according to simulations performed
AMTD
8, 2143–2189, 2015Optical depths of semi-transparent
cirrus clouds
A. Garnier et al.
Title Page
Abstract Introduction
Conclusions References
Tables Figures
◭ ◮
◭ ◮
Back Close
Full Screen / Esc
Printer-friendly Version Interactive Discussion
Discussion
P
a
per
|
Discussion
P
a
per
|
Discussion
P
a
per
|
Discussion
P
a
per
|
The clear dependence of τvis/τa on temperatureTc is interesting. According to the
simulations shown in Fig. 2 for the 12.05 µm IIR channel, for effective diameters larger than 10–15 µm, the ratios are expected to increase as the effective diameter increases, with little sensitivity to effective diameters larger than 100 µm. Thus, the increase of the observedτvis/τawith decreasingTccould conceivably be caused by larger crystals, but
5
this is in contradiction with the fact that mean crystal sizes and effective diameters are known to be generally decreasing with decreasing temperature for clouds of moderate optical depth smaller than 2.5 as considered in this study (see for example Heymsfield et al., 2014). Observations could also be explained by ice crystals effective diameters decreasing from 10–15 µm atTc=240 K down to 5 µm atTc=200 K, but this is very
un-10
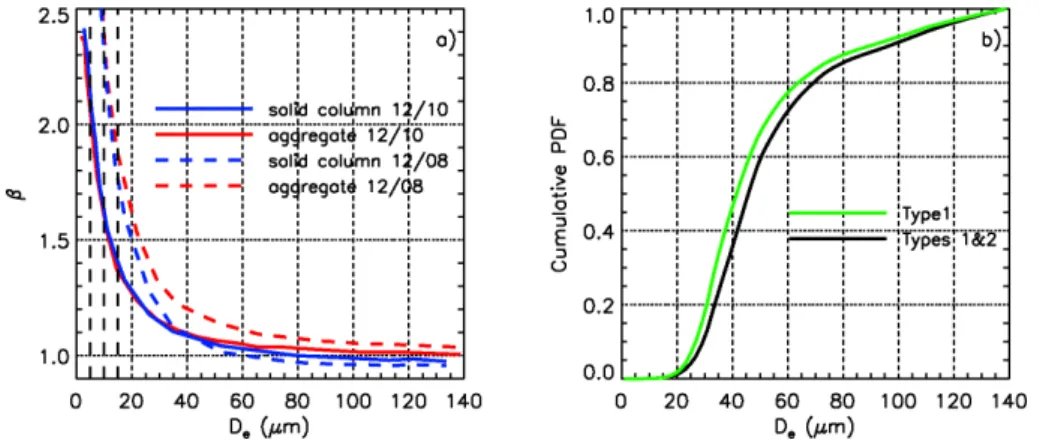
likely according to recent summary of in situ observations (Heymsfield et al., 2014). To go further in the discussion, ice crystal effective diameters retrieved from IIR measure-ments in the 3 available channels are investigated. The fundamental parameters are the so-called microphysical indicesβ12/10 andβ12/08, defined as the ratios ofτa from
channel 12.05 µm to the absorption optical depths retrieved at 10.6 and at 08.65 µm,
15
respectively. These indices can be converted into an effective diameter through Look-Up Tables, as illustrated in Fig. 7a, which shows the theoretical microphysical indices
β12/10(solid lines) andβ12/08(dashed lines) derived for hexagonal solid columns (blue)
and aggregates (red) forτa=0.25. The effective diameter is derived from the crystal
model for which the relationship between β12/10 and β12/08 agrees the best with the
20
observations. More details about the IIR microphysical algorithm can be found in Gar-nier et al. (2013). Figure 7b shows the cumulative Probability Density Function (PDF) of the derived effective diameter De. As discussed earlier, the analysis is applied to
clouds exhibiting an optical depth 2τalarger than 0.3, which allows minimizing possible
biases in IIR retrievals at small optical depth. Still, as the IIR microphysical retrievals
25
are the most robust for type 1 clouds withRBGderived from observations as described
AMTD
8, 2143–2189, 2015Optical depths of semi-transparent
cirrus clouds
A. Garnier et al.
Title Page
Abstract Introduction
Conclusions References
Tables Figures
◭ ◮
◭ ◮
Back Close
Full Screen / Esc
Printer-friendly Version Interactive Discussion
Discussion
P
a
per
|
Discussion
P
a
per
|
Discussion
P
a
per
|
Discussion
P
a
per
|
are smaller than 15 µm, which confirms that the observed behavior of theτvis/τaratios
with respect toTccannot be explained by very small crystal sizes, especially because
IIR retrievals are the most sensitive to small sizes, as evidenced in Fig. 7a.
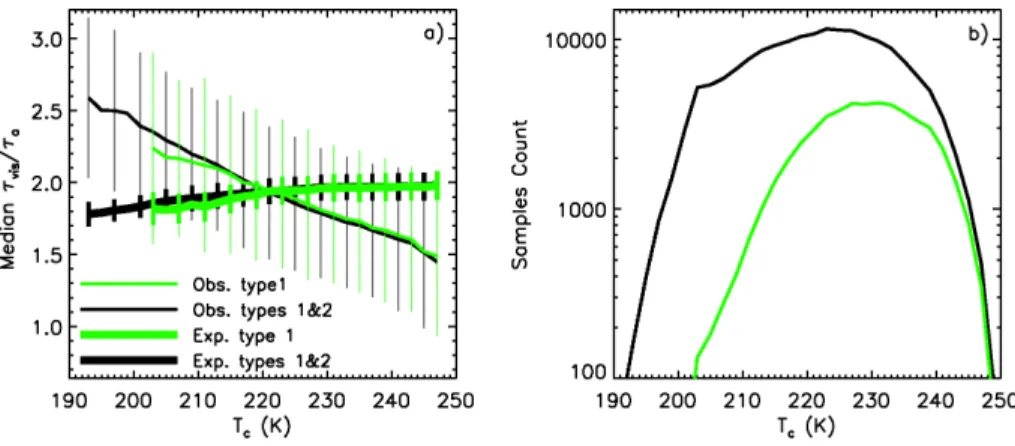
IIR microphysical retrievals are representative of the small mode of the particle size distribution (Mitchell et al., 2010). Nonetheless, they indicate that IIR absorption optical
5
depth is sensitive to the presence of ice crystals exhibiting these ranges in effective diameter, and the expectedτvis/τa ratio can be estimated from the simulations shown
in Fig. 2. The median expected ratios are plotted in Fig. 8a against the centroid temper-atureTc (thick lines), together with the median observed ratios (thin lines) to facilitate
the discussion. The green curves are for type 1 clouds whereas the black curves show
10
the results obtained by combining type 1 and type 2 clouds. As the black and green curves are very close in the overlapping region, the analysis is conducted by combining all clouds to take advantage of the larger number of samples, especially at the coldest temperatures (Fig. 8b). The expectedτvis/τa ratio (thick lines) steadily increases from
1.8±0.1 at Tc=195 K up to 1.95±0.1 atTc larger than 230 K. This result is driven by
15
the fact that effective diameters are found increasing as temperature increases from 195 up to 230 K, and with a decreasing occurrence of hexagonal solid columns, as will be shown in Sect. 4.5.
There is an obvious disagreement between observed and expected variations with temperature of the τvis/τa ratios, which needs to be explained. The accuracy of the
20
theoretical simulations is difficult to assess, but it is unlikely that they do not correctly reproduce the general behavior with respect to effective diameter. The expectedτvis/τa
ratios are weakly sensitive to the microphysical properties, so that the overall disagree-ment between observed and expected ratios is unlikely to be attributable to errors in IIR microphysical retrievals. On the other hand, even though CALIOP retrievals are
25
robust because they are directly derived from the measured cloud layer two-way trans-mittance, the retrieved quantity is an apparent optical depth, τapparent, which can be
ver-AMTD
8, 2143–2189, 2015Optical depths of semi-transparent
cirrus clouds
A. Garnier et al.
Title Page
Abstract Introduction
Conclusions References
Tables Figures
◭ ◮
◭ ◮
Back Close
Full Screen / Esc
Printer-friendly Version Interactive Discussion
Discussion
P
a
per
|
Discussion
P
a
per
|
Discussion
P
a
per
|
Discussion
P
a
per
|
sion 3 algorithm is taken constant and equal toη=0.6 so that
τapparent=η·τvis=ηT·τvis, T (9)
whereηTis the “true” multiple scattering correction factor, andτvis, Tis the “true”
single-scattering visible optical depth. It comes from Eq. (9) that variations of τvis/τa could
be driven by τvis and a correction factor ηT, which increases as Tc decreases. This
5
tentative explanation is investigated in the following section. It is noted that a similar discussion can be found in Lamquin et al. (2008), which is based on infrared retrievals from Atmospheric Infrared Sounder (AIRS) and CALIOP co-located apparent optical depths retrieved by the authors, and whereηT is found larger at temperatures colder
than 210 K than for cloud temperatures between 230 and 240 K.
10
4.4 CALIOP multiple scattering factor
In case of cirrus clouds, composed of crystals that are very large compared to CALIOP visible wavelength (λ=532 nm), a significant fraction of the scattering energy is in-cluded in a small angle forward lobe and may stay in the lidar receiver field of view for an extended distance below the cloud base, and hence contribute to an apparent
in-15
crease of the measured 2-way transmittance of the cloud. This fraction of energy varies with ice crystal phase function, ice crystal size, and lidar configuration (Nicolas et al., 1997; Chepfer et al., 1999; Hogan, 2008). The multiple scattering factor introduced by Platt (Platt, 1973; Platt et al., 2002) is a convenient parameter to correct the appar-ent 2-way transmittance for contribution from multiple scattering (Nicolas et al., 1997;
20
Eloranta, 1998). This correction factor is smaller than 1, which is the single-scattering limit.
Following the approach introduced by Platt (1973), the “bulk” multiple scattering fac-tors ηT derived by reconciling the observed and the expected ratios of visible optical
depth to infrared absorption optical depth are now examined. For every cloud sample
AMTD
8, 2143–2189, 2015Optical depths of semi-transparent
cirrus clouds
A. Garnier et al.
Title Page
Abstract Introduction
Conclusions References
Tables Figures
◭ ◮
◭ ◮
Back Close
Full Screen / Esc
Printer-friendly Version Interactive Discussion
Discussion
P
a
per
|
Discussion
P
a
per
|
Discussion
P
a
per
|
Discussion
P
a
per
|
used to build Fig. 8a, we invoke the relationship given in Eq. (9) to derive
ηT=η·
τvis/τa
observed τvis/τa
expected
(10)
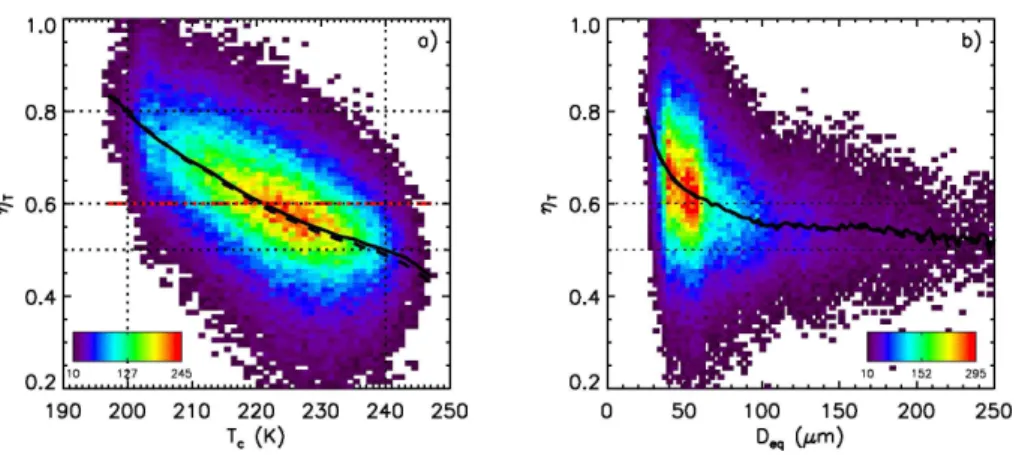
The 2-D-histogram of ηT (y axis) and Tc (x axis) is shown in Fig. 9a for the same
data set as in Fig. 8, and by combining type 1 and type 2 clouds. The mean multiple scattering factor is found to be decreasing fromηT=0.8 at Tc=200 K toηT=0.6 at
5
220 K, and then more slowly toηT=0.5 at 240 K, which is the lower limit if scattering
is only due to diffraction (Hogan, 2008). The overall mean value of ηT is 0.601, which
is encouraging, since this is essentially identical to the constant valueη=0.6 used in the version 3 CALIOP operational algorithm. The results shown in Fig. 9 are for the 12 months of 2008. The same analysis has been applied during 2010 and 2012, and very
10
similar results within a few percents over the whole range of temperature are obtained (not shown), with overall mean values ofηT equal to 0.604 and 0.602, respectively.
Variations of the multiple scattering factor reflect changes in the probability that a scattered photon will stay within the field of view and subsequently contribute to the measured signal. This probability becomes smaller as the lateral displacement of the
15
photon in the clear region below the cloud increases and possibly exceeds the receiver footprint. The lateral displacement increases with the diffraction angleθ, which is in-versely proportional to the ice crystal equivalent diameterDeq, defined as the diameter
of a sphere of equivalent volume (Nicolas et al., 1997; Comstock and Sassen, 2001). For further evaluation, the 2-D-histogram ofηTand equivalentDeq derived from the IIR
20
microphysical algorithm is shown in Fig. 9b. It is seen that, as expected, the mean value ofηT progressively departs from the single-scattering limit (ηT=1) and decreases as Deq increases or as the diffraction angleθ decreases. As the IIR effective diameter is sensitive to the small mode of the size distribution, it is a priori underestimated for many of these clouds, so that only qualitative conclusions can be drawn. Finally, the relation
25
betweenηTand a simplified estimate of the lateral displacement resulting from forward
alti-AMTD
8, 2143–2189, 2015Optical depths of semi-transparent
cirrus clouds
A. Garnier et al.
Title Page
Abstract Introduction
Conclusions References
Tables Figures
◭ ◮
◭ ◮
Back Close
Full Screen / Esc
Printer-friendly Version Interactive Discussion
Discussion
P
a
per
|
Discussion
P
a
per
|
Discussion
P
a
per
|
Discussion
P
a
per
|
tude, the distance between the diffracting ice crystals and the top of the region where the 2-way transmittance is measured is the difference betweenZc and the altitudeZb
taken 2 km below the cloud base altitude in the CALIOP algorithm, to ensure that the measurement is through the entire cloud. Thus, the lateral geometric displacement ld is roughly estimated as
5
ld=θ·(Zc−Zb)=
1.22λ Deq
·(Zc−Zb) (11)
Figure 10a shows the mean value of the multiple scattering factorηT as a function of
the “true” visible optical depthτvis, T derived from Eq. (9) and of the estimated lateral
displacement ld. The corresponding number of samples is shown in Fig. 10b. For most samples, optical depth is smaller than 1 and the estimated displacement ld is found to
10
be smaller than 60 m. For comparison, the radius of the CALIOP receiver footprint is about 50 m and the radius of the laser footprint is about 42 m (Hunt et al., 2009). The mean value ofηT is found to be nicely increasing toward the single-scattering limit as the estimated value of ld increases (Fig. 10a), less rapidly as optical depth increases. It is recognized that ld is a crude estimate based on simplified geometric considerations
15
and scattering due to diffraction only, and a quantified discussion would be hazardous. Nonetheless, these qualitative results indicate that the “bulk” multiple scattering factors
ηT derived by reconciling observed and expectedτvis/τaratios at cloud layer scale are
a real measurement of the result of the complex journey of the photons within and below the layer.
20
4.5 Discussion: implications for CALIOP retrievals
AMTD
8, 2143–2189, 2015Optical depths of semi-transparent
cirrus clouds
A. Garnier et al.
Title Page
Abstract Introduction
Conclusions References
Tables Figures
◭ ◮
◭ ◮
Back Close
Full Screen / Esc
Printer-friendly Version Interactive Discussion
Discussion
P
a
per
|
Discussion
P
a
per
|
Discussion
P
a
per
|
Discussion
P
a
per
|
introduced by Platt (1973), the apparent lidar ratioS∗ can be derived as
S∗=1−T
2 apparent
2γ′ =
1−e−2·ηT·τvis, T
2γ′ , (12)
whereγ′is the cloud attenuated backscatter vertically integrated between layer bottom and top altitudes. The apparent lidar ratioS∗ is the product of the multiple scattering factor and of the lidar ratio and is written as
5
S∗=η·Scal=ηT·Scal, T, (13)
whereScal and Scal, T are the lidar ratios retrieved by taking η=0.6 and ηT from this
study, respectively.
The equation introduced by Platt (1973) was established within the cloud, assum-ing that the multiple scatterassum-ing correction factor is constant with range, which is only
10
approximately true. In Eq. (12), a constant “bulk” correction factor ηT is considered,
which is assumed to be equal to the bulk factor within the cloud. This may not be fully correct according to simulations by Winker (2003), which showed thatηT within and
below the cloud could differ by about 15 %. The resulting relative error inS∗due to this approximation can be derived from Eqs. (12) and (9) as
15
dS∗ S∗ =
2·τapparent·e− 2·τapparent
1−e−2·τapparent ·
dηT ηT
(14)
As illustrated in Winker (2003), it is identical to dηT/ηTwhen optical depth tends to zero
and decreases as optical depth increases. Subsequently, the relative error in Scal, T
derived from Eqs. (13) and (14) is
dScal, T Scal, T
=dS ∗
S∗ − dηT
ηT =
2·τapparent·e− 2·τapparent
1−e−2·τapparent −
1
! ·dηT
ηT (15)
AMTD
8, 2143–2189, 2015Optical depths of semi-transparent
cirrus clouds
A. Garnier et al.
Title Page
Abstract Introduction
Conclusions References
Tables Figures
◭ ◮
◭ ◮
Back Close
Full Screen / Esc
Printer-friendly Version Interactive Discussion
Discussion
P
a
per
|
Discussion
P
a
per
|
Discussion
P
a
per
|
Discussion
P
a
per
|
Here, the relative error inScal, Tis null when optical depth tends to zero, and approaches
progressively−dηT/ηT as optical depth increases.
As seen in Eq. (12), the apparent lidar ratioS∗is directly derived from measurements and does not require knowledge of the multiple scattering factor. WhenTapparent2 cannot be measured, CALIOP optical depth is derived by using the unconstrained technique,
5
andTapparent2 is retrieved from a default apparent lidar ratio, which can be established from statistical analyses of S∗ retrieved from constrained retrievals (Garnier et al., 2012b). This ensures consistency between constrained and unconstrained retrievals, and in both cases, the conversion of apparent optical depth into single-scattering opti-cal depth depends on an a priori specification of the multiple scattering factor.
10
Several ice crystal microphysical parameters are retrieved from the CALIPSO mis-sion. Lidar ratios derived from measurements of the 2-way transmittance provide in-sights into ice crystals scattering phase function at 180◦, and depolarization ratios at 532 nm are an indicator of ice crystal shape ratios (Noël et al., 2002). These measured parameters, available at global scale, have been compared with simulations for
numer-15
ous ice crystal models (Baum et al., 2011). The depolarization ratio of semi-transparent cirrus clouds observed by CALIOP is not expected to be significantly impacted by the multiple scattering factor (Reichardt and Reichardt, 2003). However, the derived lidar ratio is inversely proportional to the multiple scattering factor (see Eq. 13).
The changes in optical depth and lidar ratio resulting from taking ηT derived in this
20
study instead ofη=0.6 used in the standard retrieval are now examined.
4.5.1 Optical depth
The multiple scattering factor has been found to vary betweenηT=0.8 andηT=0.5 as
temperature increases and to be equal to 0.6 on average. If this result is correct, then the CALIOP optical depth retrieved by using a constant valueη=0.6 is overestimated
25
de-AMTD
8, 2143–2189, 2015Optical depths of semi-transparent
cirrus clouds
A. Garnier et al.
Title Page
Abstract Introduction
Conclusions References
Tables Figures
◭ ◮
◭ ◮
Back Close
Full Screen / Esc
Printer-friendly Version Interactive Discussion
Discussion
P
a
per
|
Discussion
P
a
per
|
Discussion
P
a
per
|
Discussion
P
a
per
|
rived from Eq. (9) (ηT, Fig. 11b) and centroid temperature, Tc. Note that in Fig. 11b, τvis, T is mostly larger than 0.3, because the analysis is conducted for 2τa larger than
0.3. τvis, T exhibits a general increase with increasing temperature (Fig. 11b), which
is not seen in τvis (Fig. 11a). This implies that on average, the extinction coefficients
derived from CALIOP usingηT will increase more rapidly with temperature than those
5
retrieved usingη=0.6. This change will also be reflected in the ice water content es-timates reported in the CALIOP data products, because ice water content is inferred from a non-linear parameterization based on extinction coefficients (Heymsfield and al., 2005, 2014).
4.5.2 Microphysics
10
Lidar ratios with constant and variable multiple scattering factors are shown in Fig. 12, which compares the 2-D-histograms ofScal(η=0.6, Fig. 12a) andScal, T(ηT, Fig. 12b)
and centroid temperature,Tc. When ηis taken constant, the median lidar ratioScal is
found to be weakly varying with temperature, with a maximumScal=31 sr atTc=225 K, and minima atTc=200 and 240 K that are smaller by only 10 % (Scal=28 sr). Because
15
ηis taken constant, we can conclude that the apparent lidar ratio S∗ is likewise only weakly varying with temperature. When the multiple scattering factor is taken from this study (ηT), the temperature dependence is increased, as the median lidar ratioScal, T
is found to increase by about 50 % fromScal, T=21 sr atTc=200 K up toScal, T=34 sr
atTc=228 K, and to be roughly constant forTcwarmer than 228 K.
20
Distributions of the integrated volume (blue) and particulate (red) depolarization ra-tios reported in the CALIOP products are shown in Fig. 13a. The particulate depo-larization ratio is derived from the standard extinction solutions, and thus according to this analysis should be expected to change slightly. Nevertheless, the temperature-dependent behavior of the particulate depolarization ratio is similar to the volume
de-25