Short Report
S
J. Braz. Chem. Soc., Vol. 22, No. 2, 376-381, 2011. Printed in Brazil - ©2011 Sociedade Brasileira de Química 0103 - 5053 $6.00+0.00*e-mail: [email protected]
A Fast Microwave-Assisted Procedure for Loss on
Drying Determination in Saccharides
Cezar A. Bizzi,a Juliano S. Barin,b Aline L. Hermes,a
Sergio R. Mortaric and Érico M. M. Floresa,*
aDepartamento de Química, Universidade Federal de Santa Maria, 97105-900 Santa Maria-RS, Brazil
and Instituto Nacional de Ciência e Tecnologia de Bioanalítica, Campinas-SP, Brazil
bDepartamento de Tecnologia e Ciência dos Alimentos, Universidade Federal de Santa Maria,
97105-900 Santa Maria-RS, Brazil
cCiências Tecnológicas, Centro Universitário Franciscano, 97010-03 Santa Maria-RS, Brazil
Um procedimento rápido para determinação de perda por dessecação (LOD) foi desenvolvido empregando aquecimento por radiação micro-ondas. Amostras de sacarídeos foram utilizadas e diferentes parâmetros foram avaliados, tais como a posição da amostra na cavidade do micro-ondas, massa de amostra e tempo de irradiação. Massas de amostra de 1 g e tempo de irradiação entre 15 e 25 min foram suicientes para a determinação da perda por dessecação de todos sacarídeos. Os resultados obtidos para perda por dessecação assistida por micro-ondas (MALOD) foram comparados com os resultados obtidos por LOD convencional em estufa e não apresentaram diferença signiicativa. O tempo de análise foi reduzido de 2,4 a 15 vezes, quando comparado ao sistema convencional de LOD e o desvio padrão relativo das medidas foi inferior a 1%. Até 16 amostras podem ser processadas simultaneamente, tornando o procedimento MALOD apropriado para análise de rotina.
A fast procedure for loss on drying (LOD) determination was developed using microwave radiation. Samples of commercial saccharides were dried and the inluence of sample position inside the microwave cavity, sample mass and irradiation time were evaluated. Sample mass of 1 g and irradiation time between 15 to 25 min were enough to LOD determination for all saccharides. Results obtained using the proposed microwave-assisted loss on drying (MALOD) procedure were compared with those obtained by conventional LOD determination using an oven and no statistical difference was found among results of these techniques. Using MALOD procedure the relative standard deviation was below 1%. The time for analysis was reduced from 2.4 to 15 times when compared to conventional LOD determination and up to 16 samples could be simultaneously processed making MALOD procedure suitable for routine analysis.
Keywords: loss on drying, saccharides, microwave, food and pharmaceutical samples
Introduction
Loss on drying (LOD) determination is a parameter often evaluated to access the quality of products. Several applications of LOD can be found in industry, in special for food and pharmaceutical industries, which currently use LOD to determine the amount of volatile matter (in general, water) that is driven off under speciic conditions.1-3 The LOD
determination is relatively simple to be performed and results
with relatively good precision can be obtained resulting in a widespread use. For example, in the 30th edition of The United
States Pharmacopeia more than one thousand monographs recommended the use of LOD in their tests that makes it a parameter that must be routinely evaluated in current quality control.4
The procedures recommended for LOD determination can be performed at different conditions of drying such as pressure (atmospheric or vacuum) and temperature (with or without heating).1-3 In some cases, the use of a desiccant to help the
specially for mild drying conditions used for samples that can be decomposed at high temperatures. However, the most used procedure is drying carried out at atmospheric pressure in an oven with previously selected temperature (e.g. 105 or
130 °C).5,6 This procedure is very simple, the equipments
used are commonly available in laboratories and does not require high analyst skill to perform the determination. In spite of these advantages, LOD is a time consuming procedure because samples must be dried for several hours in a drying oven. In some cases, the time recommended to perform the LOD determination can reach up to six hours of heating (e.g.,
croscarmellose sodium,7 dipivefrine hydrochloride,8 and
spiramycin9). This excessively long time can be troublesome
and methods allowing time reduction could be important for routine analysis.10-12
The use of microwave radiation has been increased in order to minimize the time of drying.13,14 With microwave
assisted drying the material is exposed to high frequency electromagnetic waves. Microwaves interact with polar molecules (e.g. water) causing sequential and very fast
alignment with electromagnetic field with subsequent release of absorbed energy. In this process, heat is generated throughout the solid material resulting in water evaporation. This process creates a pressure gradient causing a fast movement of liquid water and water vapor towards the surface of solid materials. Thus, a very fast drying takes place without the need to overheat the external environment.14,15 Several
papers dealing with microwave radiation for pharmaceuticals drying are available in the literature.16-23 However, despite the
widespread use, microwave drying has not been used up to now as a tool to speed up the LOD determination in saccharides. Considering that LOD is performed routinely the use of microwaves could reduce the time of analysis allowing fast response regarding to the quality of sample.
Therefore, in this work the application of microwaves for LOD determination is proposed using simple and inexpensive instrumentation. Saccharide samples of pharmaceutical grade were chosen as examples in order to evaluate the feasibility of the proposed procedure and results were compared with those obtained by LOD using conventional heating in an oven described in The United States Pharmacopeia.4 The following
operational parameters were evaluated: microwave power output, distribution of microwave radiation within the oven cavity and evaluation of the relative dielectric loss factor.
Experimental
Samples
Commercially available saccharide samples of pharmaceutical grade (potato starch, maize starch, guar,
agar, microcrystalline cellulose and hypromellose) were used in this work. Samples were maintained in their original package before LOD determinations in an environment with controlled temperature (22 ± 2 °C) and humidity (less than
50% of air relative humidity). All samples had particle size lower than 150 µm.
Instrumentation
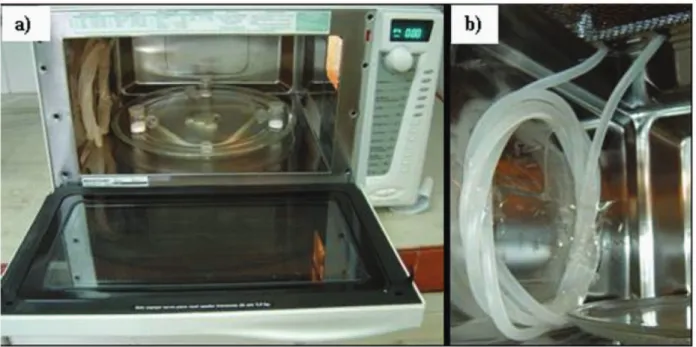
Microwave-assisted loss on drying (MALOD) determination was performed using a domestic microwave oven (model BMK38ABBNA, 38 L, 2450 MHz, Brastemp, Brazil), with 950 W of nominal power. In order to allow a continuous microwave irradiation of samples and prevent damages to magnetron a polyethylene coil (1 m length and 5 mm i.d.) was itted inside the cavity in the opposite side of the wave-guide. Water was passed within the coil in a constant low rate (700 mL min−1). The polyethylene coil
was passed through the microwave oven using the holes originally designed for air circulation in order to avoid changes in the metallic cavity cover and minimize the risk of microwave losses. For safety reasons, a microwave spill detector was periodically used during the experiments in order to check eventual microwave loss (model LT-2D, 2450 MHz, maximum limit of 5 mW cm−2, Milestone
S.R.L., Sorisole, Italy).
For conventional LOD determination a drying oven (model 400/2ND, Nova Ética, Brazil) was used. Samples were dried in a weighing bottle of 25 mm of internal diameter and volume of 30 mL. Samples were accurately weighed using an analytical balance (model AY 220, max. 220 g, 0.1 mg of resolution, Shimadzu, Kyoto, Japan).
Determination of microwave power output and distribution of microwave radiation within the oven cavity
Ultrapure water (Milli-Q, 18.2 MΩ cm) was used
for both determination of microwave power output and distribution of microwave radiation experiments. The power output of magnetron (real power) was indirectly determined by measuring the increase of temperature of water after microwave irradiation. In this work 1,000 g of water was heated at full power for 2 min and the power output of the microwave oven was evaluated using a general relationship where the power output (P), in Watts, was calculated
according to equation 1: P = k cp m ∆T/t, where k is the
conversion factor (from thermal chemical calories s−1 to
Watts, 4.184 J cal−1), Cp is the heat capacity (or thermal
capacity, in cal °C−1), m is the sample mass (g), ∆T is the
temperature change (°C) after microwave heating, and t is
In order to evaluate the inluence of sample position inside the microwave cavity on the heating of samples, twenty one glass beakers (25 mm diameter and 20 mL capacity) each one containing 15 g of ultrapure water were symmetrically positioned on the turntable of the microwave cavity. The oven was operated at maximum power for 60 s of irradiation. The temperature increase of water was measured with a thermocouple device (digital thermometer, model AF0806, Incoterm, Brazil). This procedure was performed by measuring the temperature, each run, of four beakers positioned at the same distance from the center. Further, for all the beakers, water was replaced by a new amount of cold water and the same procedure was performed for beakers positioned in other distances from the center. This procedure was repeated up to the water temperature has been determined in all the 20 beakers. Therefore, microwave distribution inside the oven was determined using this procedure. This procedure was repeated four-times and the mean absorbed power for each position was calculated according to equation 1.
LOD and MALOD determination
The LOD determination in conventional oven was performed by introduction of 1 g of each sample in a weighing bottle previously dried under the recommended conditions (130 °C for potato and maize starch and 100 to 105 °C for
the other samples) up to constant mass.4 After the drying step,
bottles containing the samples were kept in a desiccator for 30 min and the LOD value was obtained from the difference of weight determined before and after drying.
For MALOD determination the inluence of microwave irradiation time and sample amount were evaluated from 1 to 30 min and from 0.5 to 2.0 g of saccharide samples, respectively. Samples were dried in weighing bottles, which were previously prepared under the same conditions described for LOD determination in an oven.
The kinetics of drying for the MALOD procedure was evaluated by means of relative dielectric loss factor determination.14 For this study, 4.0 ± 0.1 g of sample were
dried in the microwave oven at the maximum power for 30 s. The temperature increase was determined using a thermocouple device with digital display for both dried and non dried samples. Each experiment was repeated four times.
Results and Discussion
Determination of microwave power output and distribution of microwave radiation within the oven cavity
Considering that domestic microwave ovens are not originally designed for analytical purposes
the evaluation of total irradiated microwave power and microwave distribution inside the cavity was necessary.25,26 In the present work microwave power
output was studied only for the maximum nominal power (950 W) in order to reduce the drying time. The efficiency of conversion was 71.6% of maximum nominal power that is equivalent to 680 W of real power delivered inside the cavity which was calculated according to equation 1. This result was in agreement with previous data reported in literature.27
Changes in sample position inside the microwave cavity can generate different microwave absorption profiles that can cause inconsistent drying process25,28,29
and their influence must be evaluated. The distribution of microwave radiation within the microwave oven cavity was measured using real power of 680 W allowing the determination of the most suitable position in order to obtain effective and reproducible sample drying. Figure 1 shows the microwave distribution on the turntable. It was possible to observe that in the central position (from 0 to 12 cm from the central point of turntable) less microwave power was absorbed by water, while positions close to the extremity of turntable (from 12 to 18 cm from the central position) showed higher microwave absorption. This region of turntable showed also the smallest variation of microwave absorption with differences lower than 4%, contrarily to changes up to 35% observed for other intervals (e.g., 3 to
12 cm). Based on these results, the selected position for weighing bottles was between 12 and 18 cm from the central position. These conditions were used for subsequent MALOD determinations in order to improve the precision of measurements.
Inluence of microwave irradiation time for MALOD
As can be seen in Figure 2, the higher loss of weight occurred up to 5 min of microwave heating for all saccharyde samples. This proile could be explained by the physical and chemical characteristics of powders. As a consequence, some characteristics of samples such as heat capacity, conductivity, molecular structure, density, size, crystallinity and many other physical properties can affect the microwave absorption.27, 29-32
In addition, moisture content, and the way free water is located within the interstices and pores of the solid matrix can result in different effects on kinetics of drying. Taking into account the dificulties of determination of each parameter, the heating pattern of sample could be estimated, at least partially, by the dielectric loss factor of the sample. The relative dielectric constant expresses the degree to which an electric ield may build up within a material when a dielectric ield is applied and how much of the electric ield will be converted into heat.14,27,33 Thus, an indication of the relative magnitude of
the dielectric characteristics may be obtained by measuring the temperature variation induced when the sample was irradiated with microwaves. In the present work, the drying proile of saccharides could be considered as a function of relative dielectric loss factor, as shown in Figure 3. The loss factor of a powder is dependent on moisture content up to a critical level. However, as the moisture content increases, dielectric properties are close to those for a pure solvent.14 During the
irst falling-rate period, a higher amount of free water was present. Therefore, in view of the higher dielectric loss factor of water, microwaves could be selectively absorbed by these molecules thus facilitating a high drying-rate. During the drying process, the solid content becomes more signiicant and therefore the solid sample begins to absorb a greater proportion of microwave energy. Therefore, the initial amount of water present in the samples had great inluence on the microwave drying proile of saccharides samples.
The necessary time to achieve a constant mass was 15 min for maize starch, guar, hypromellose and microcrystalline cellulose, and 20 to 25 min for potato starch and agar, respectively as shown in Figure 2. When the time of drying for microcrystalline cellulose was increased beyond 20 min carbonized spots were observed. After this time, as water was removed, the absence of moisture during the microwave heating could explain this effect. As microcrystalline cellulose probably has a low dissipation factor (Figure 3); it can be suggested that when temperature increases, during the water removal on microwave heating, the dissipation factor is also increased. It can cause an exponential increase in temperature leading to localized hot spots inside the solid material.24,27,33-35 This phenomenon
was not observed for other saccharides.
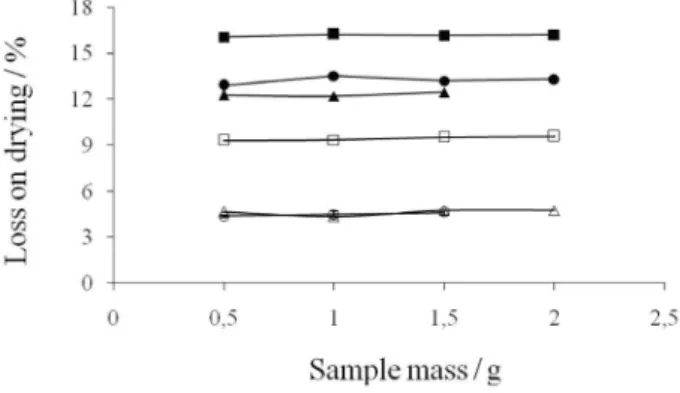
Inluence of sample mass
The influence of sample mass on MALOD determination was evaluated using the previously selected time of irradiation observed for each saccharyde (before section). With the increase of mass the loss on
Figure 2. MALOD proile of saccharides: -- potato starch, -- maize
starch, -- guar, -- agar, -- microcrystalline cellulose, and
-∆- hypromellose. For all studies was used 1 g of sample, n ≥ 3.
Figure 3. Effect of drying on temperature variation for saccharides samples irradiated by microwaves: A: potato starch, B: maize starch, C: guar, D: agar, E: microcrystalline cellulose, F: hypromellose.
Figure 4. Inluence of sample mass on MALOD determination: -- potato
starch, -- maize starch, -- guar, -- agar, -- microcrystalline cellulose,
drying was constant as shown in Figure 4. This means that eficiency of volatile matter removal is not dependent of sample amount inside the weighing bottles. However, carbonized spots were observed with masses higher than 1.5 g for guar and microcrystalline cellulose and 2.0 g for potato starch, maize starch, agar and hypromellose. Hot spot occurrence is inluenced by the electromagnetic and thermodynamic features of the microwave system and the workload.19 Hotter areas of solid materials are
cooled by heat diffusion to the surrounding material that is dependent of the thermal diffusivity and temperature gradient.19 Taking into account that with higher
saccharide masses the temperature increases due to reduced heat diffusion and heat convection, a relection of the electromagnetic wave from the phase boundary can occur, generating localized hot spots inside the material.27,34,35 However, it is important to point out that
hot spot phenomenon was observed in this work only for sample masses higher than those recommended in the respective pharmaceutical monograph.2 Therefore, it
was not considered a limitation for LOD determination using the proposed procedure.
Comparison of proposed MALOD with LOD
An advantage of the drying oven process is related to the fact that this simple technique can be carried out in practically every analytical laboratory. In spite that this technique provides reproducible results, the LOD using an oven cannot be regarded as a rapid determination method due to the excessive time for determination. It could reduce the throughput for routine analysis. The recommended time for LOD determination using an oven described in pharmacopeias ranges from 90 min (e.g. maize and potato starch) to 300 min (e.g. guar and agar samples).2 Using the proposed MALOD procedure,
the time for drying all the samples was between 15 and 25 min resulting in a time reduction up to 15 times (for guar sample) as can be seen in Table 1. Using MALOD procedure the time for analysis was reduced from 2.4 to 15 times when compared to conventional LOD determination and up to 16 samples could be simultaneously processed making MALOD procedure suitable for routine analysis.
Furthermore, the results obtained with proposed procedure were in agreement (t-Test, 95% of conidence level) to those obtained by conventional LOD determination using an oven as shown in Table 2. The relative standard deviation found using MALOD showed that this procedure provides reproducible results with values ranging from 0.1 to 1% (n = 6). These results
were in the same level that relative standard deviations values found by LOD using oven (0.15 to 1%). Then, based on these results, the proposed MALOD procedure can be used for LOD determination with good precision.
Conclusions
The proposed MALOD procedure provided results comparable to conventional LOD for evaluated samples in a faster way. For some saccharides, carbonized spots were observed when the time was increased beyond 20 min (microcrystalline cellulose) and with masses higher than 1.5 g (guar and microcrystalline cellulose) or 2.0 g (potato starch, maize starch, agar and hypromellose). In addition, the relative standard deviations for MALOD were considered suitable for routine LOD determination. Reduced time for analysis can be cited as the mainly advantage of MALOD when compared to conventional LOD determination. Therefore, MALOD procedure can be recommended as an alternative method to LOD determination in saccharides samples. To the best of our knowledge, the present work describes the irst application of microwaves for LOD determination in pharmaceutical products related to the speciications of pharmacopeias.
Table 1. Time for analysis using proposed MALOD and conventional LOD in oven
Saccharide Drying time, min MALOD,
time decrease
LOD* MALOD
Potato starch 90 20 4.5 times
Maize starch 90 15 6 times
Guar 300 20 15 times
Agar 300 25 12 times
Microcrystalline cellulose
180 15 12 times
Hypromellose 60 25 2.4 times
* recommend values in The United States Pharmacopeia.4
Table 2. Results for loss on drying determination in saccharides using proposed MALOD procedure and LOD in conventional oven (n = 6)
Saccharide Loss on drying, %
LOD (oven) MALOD
Potato starch 15.55 ± 0.03 16.03 ± 0.04 Maize starch 13.46 ± 0.05 13.50 ± 0.02
Guar 11.66 ± 0.06 11.85 ± 0.07
Agar 9.02 ± 0.04 9.20 ± 0.04
Microcrystalline cellulose
4.55 ± 0.03 4.67 ± 0.02
Acknowledgments
The authors are grateful to CNPq (Instituto Nacional de Ciência e Tecnologia de Bioanalítica, Proc. Nr. 573672/2008-3), CAPES and Agência Nacional de Vigilância Sanitária (ANVISA-Brazil).
Supplementary Information
Supplementary data experimental (instrumentation) are available free of charge at http://jbcs.sbq.org.br as pdf ile.
References
1. The United States Pharmacopoeia (USP), Physical Tests and Determinations (731) Loss on Drying, USP 30, NF 25, Rockville, 2007.
2. British Pharmacopoeia, Appendix IX D, Determination of Loss on Drying (Ph. Eur. Method 2.2.32), CD-ROM, Her Majesty’s Stationery Ofice: London, 2007, v.1.
3. Oficial Methods of Analysis of AOAC International, 18th ed.,
AOAC International, Gaithersburg, MD, USA, 2005. 4. The United States Pharmacopoeia (USP), The Official
Compendia of Standards, USP 30, NF 25, Rockville, 2007. 5. British Pharmacopoeia, Monograph Microcrystalline Cellulose
(Ph. Eur. Monograph 0316), CD-ROM, Her Majesty’s Stationery Ofice: London, 2007.
6. British Pharmacopoeia, Monograph Maize Starch (Ph. Eur. Monograph 0344), CD-ROM, Her Majesty’s Stationery Ofice: London, 2007.
7. British Pharmacopoeia, Monograph Croscarmellose Sodium (Ph. Eur. Monograph 0985), CD-ROM, Her Majesty’s Stationery Ofice: London, 2007.
8. British Pharmacopoeia, Monograph Dipivefrine Hydrochloride (Ph. Eur. Monograph 1719), CD-ROM, Her Majesty’s Stationery Ofice: London, 2007.
9. British Pharmacopoeia, Monograph Spiramycin (Ph. Eur. Monograph 0293), CD-ROM, Her Majesty’s Stationery Ofice: London, 2007.
10. Isengard, H. D.; Valter, M.; Z. Lebensm. Unters. Forsch. A 1998, 207, 377.
11. Hinz, D. C.; J. Pharm. Biomed. Anal. 2007, 43, 779.
12. Bruttel, P.; Schlink, R.; Water Determination by Karl Fischer Titration, Metrohm Ltd., CH-9101 Herisau, Switzerland, 2003. (8.026.5003-2003-09).
13. Maichin B.; Kettisch, P.; Knapp, G.; Fresenius J. Anal. Chem. 2000, 366, 26.
14. McLoughlin, C. M.; McMinn, W. A. M.; Magee, T. R. A.; Trans. Inst. Chem. Eng. 2000,78, 90.
15. McLoughlin, C. M.; McMinn, W. A. M.; Magee, T. R. A.; Dry. Technol. 2003, 21, 293.
16. Hu, Y.; Wang, T.; Wang, M.; Han, S.; Wan, P.; Fan, M.; Chem. Eng. Process. 2008, 47, 2256.
17. Özbek, B.; Dadali, G.; J. Food Eng. 2007, 83, 541.
18. Loh, Z. H.; Liew, C. V.; Lee, C. C.; Heng, P. W. S.; Int. J. Pharm. 2008, 359, 53.
19. Kelen, A.; Ress, S.; Nagy, T.; Pallai-Varsanyi, E.; Pintye-Hodi, K.; Powder Technol. 2006, 162, 133.
20. Kelen, A., Pallai-Varsanyi, E.; Ress, S.; Nagy, T.; Pintye-Hodi, K.; Eur. J. Pharm. Biopharm. 2006, 62, 101.
21. Szepes, A.; Hasznos-Nezdei, M.; Kovács, J.; Funke, Z.; Ulrich, J.; Szabó-Révész, P.; Int. J. Pharm. 2005,30, 166.
22. McLoughlin, C. M.; McMinn, W. A. M.; Magee, T. R. A.; Powder Technol. 2003, 134, 40.
23. Farrel, G. ; McMinn, W. A. M ;, Magee, T. R. A.; Dry. Technol. 2005, 23, 2131.
24. Neas, E. D.; Collins, M. J. In Introduction to Microwave Sample Preparation; Kingston, H. M.; Jassie, L. B., eds.; ACS Professional Reference Book: Washington, DC, 1988. 25. Rosini F.; Nascentes, C. C.; Nóbrega, J. A.; Quim. Nova 2004,
27, 1012.
26. Flores, E. M. M.; Saidelles, A. P. F.; Barin, J. S.; Mortari, S. R.; Martins, A. F.; J. Anal. At. Spectrom. 2001, 16, 1419. 27. Zlotorzynski, A.; Crit. Rev. Anal. Chem. 1995, 25, 43. 28. Ybañez, N.; Cervera, M. L.; Montoro, R.; de la Guardia, M.;
J. Anal. At. Spectrom. 1995, 6, 379.
29. Fuente, M. A.; Juaréz, M.; Analyst 1995, 120, 107. 30. Reh, C. T.; Gerber, A.; Food Chem. 2003, 82, 125. 31. Nelson, S. O.; J. Food Eng. 1994, 2, 365.
32. Gabriel, C.; Gabriel, S.; Grant, E. H.; Halstead, B. S. J.; Mingos, D. M. P.; Chem. Soc. Rev. 1998, 27, 213.
33. Ponne, C. T. ; Bartels, P. V. ; Radiat. Phys. Chem. 1995, 45, 591.
34. Kritikos, H. N.; Schwan, H. P.; IEEE Trans. Biomed. Eng. 1972, 19, 53.
35. Kritikos, H. N.; Schwan, H. P.; IEEE Trans. Biomed. Eng. 1975, 22, 457.
Submitted: January 6, 2010
Published online: September 8, 2010
Supplementary Information
J. Braz. Chem. Soc., Vol. 22, No. 2, 1-2, 2011. Printed in Brazil - ©2011 Sociedade Brasileira de Química
0103 - 5053 $6.00+0.00
S
I
*e-mail: [email protected]
A Fast Microwave-Assisted Procedure for Loss on
Drying Determination in Saccharides
Cezar A. Bizzi,a Juliano S. Barin,b Aline L. Hermes,a
Sergio R. Mortaric and Érico M. M. Floresa,*
aDepartamento de Química, Universidade Federal de Santa Maria, 97105-900 Santa Maria-RS, Brazil
and Instituto Nacional de Ciência e Tecnologia de Bioanalítica, Campinas-SP, Brazil
bDepartamento de Tecnologia e Ciência dos Alimentos, Universidade Federal de Santa Maria,
97105-900 Santa Maria-RS, Brazil
c Ciências Tecnológicas, Centro Universitário Franciscano, 97010-03 Santa Maria-RS, Brazil
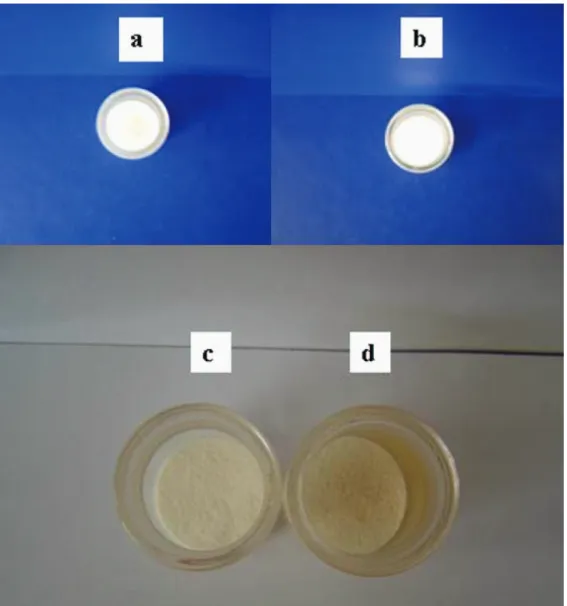
Figure S3. Aspect of microcrystalline cellulose samples in MALOD procedure; a) 1.0 g of sample before the proposed procedure, b) 1.0 g of sample after 15 min of microwave radiation, c) 1.0 g of sample after 25 min of microwave radiation (showing the hot spots when the time was increased) and d) 2.0 g of sample after 15 min of microwave radiation, showing the hot spots when the sample mass was increased.