Optical phonon features of triclinic montebrasite: Dispersion analysis
and non-polar Raman modes
Rafael M. Almeida
a, Sonja Höfer
b, Thomas G. Mayerhöfer
b, Jürgen Popp
b,
Klaus Krambrock
a, Ricardo P.S.M. Lobo
c, Anderson Dias
d, Roberto L. Moreira
a,*
aDepartamento de Física, ICEx, Universidade Federal de Minas Gerais, C.P. 702, 30123-970 Belo Horizonte, Minas Gerais, BrazilbLeibniz-Institut für Photonische Technologien e.V., Albert-Einstein Strabe 9, D-07745 Jena, Germany
cLaboratoire de Physique et d'Étude des Matériaux, ESPCI, CNRS, UPMC, 10 rue Vauquelin, F-75231 Paris Cedex 5, France dDepartamento de Química, ICEB, Universidade Federal de Ouro Preto, 35400-000 Ouro Preto, Minas Gerais, Brazil
A R T I C L E I N F O
Article history:
Received 17 September 2014
Received in revised form 16 December 2014 Accepted 16 February 2015
Available online 18 February 2015
Keywords:
Triclinic crystals Infrared spectroscopy Raman spectroscopy Dispersion analysis Dielectric response
A B S T R A C T
Polarized infrared and Raman spectra of triclinic LiAl(PO4)(OH) [montebrasite] single crystal were
recorded for appropriate optical configurations. Dispersion analysis was applied on the infrared reflectivity spectra taken at low incidence angle (11) to determine the oscillator parameters and the dipole directions of the polar phonons. In particular, all the 27 polar phonons, predicted by group theory for triclinic P1 structure, were determined. The obtained dielectric tensor parameters have been checked by comparison between predicted and measured infrared spectra at higher incidence angle (34). The azimuth and co-elevation angles obtained from the dispersion analysis showed that the response of several polar phonons is close to that of an orthorhombic system. Polarized Raman spectra obtained in several scattering geometries allowed us to obtain well-defined 24 non-polar modes, also in perfect agreement with group theory. The selection rule between Raman and infrared phonons was respected, confirming the centrosymmetric structure and ruling out any relevant influence of defects. The relatively narrow phonon bands are compatible with a highly ordered structure with fully occupied atomic sites.
ã2015 Elsevier B.V. All rights reserved.
1. Introduction
The optical properties of insulator crystals in the infrared spectral region are essentially determined by the characteristics of their vibrational (i.e., phononic) excitations. The optical phonons are usually obtained from inelastic Raman scattering or infrared spectroscopy (transmission or reflection), whose activities depend on several particular features of the system/measuring confi gura-tion, mainly the crystal symmetry, sample orientagura-tion, light polarization and propagation directions. The knowledge of the phonon features of a material brings information about crystal structure and quality, as well as its optical and dielectric properties, useful for designing technological applications.
The determination of the polar phonon parameters (i.e., frequency, strength and damping constants) of a system from its infrared reflectivity spectra is called dispersion analysis (DA). It wasfirstly developed by Czerny for cubic crystals[1], and later extended to lower symmetry systems by using polarized infrared
spectra measured along their crystallographic axes[2,3], taking benefit of the fact that those axes are the principal ones of the dielectric tensor function for all systems with orthogonal or higher symmetries (i.e., cubic, tetragonal, orthorhombic, rhombohedral or hexagonal structures). Once the polar phonon characteristics of the system are known, the dielectric tensor function can be derived in the spectral region of interest[4,5]. While DA methodology is very well established for higher symmetry systems, the extension for monoclinic and triclinic crystals is not straightforward, since for these non-orthogonal systems the dielectric function always has non-diagonal terms. In terms of the polar phonons, this implies that their dipoles (or transition moments) are no longer parallel to the crystallographic axes, and are indeed at individually defined directions in the plane of non-orthogonal axes (monoclinic crystals) or in space (triclinic ones). Because of the increased difficulties of working with low-symmetry systems, only a bit more than a dozen of works on monoclinic[6–22]and three on
triclinic[23–26]single-crystalline samples were reported so far
using DA, at the best of our knowledge. Very recently, some of us (S. H. & T.M.) introduced a new DA methodology for investigating triclinic crystals. This method has been successfully applied to blue vitriol and potassium dichromate, revealing that the optical * Corresponding author. Tel.: +55 31 3409 5624; fax: +55 31 3409 5600.
E-mail address:bmoreira@fisica.ufmg.br(R.L. Moreira).
http://dx.doi.org/10.1016/j.vibspec.2015.02.004
0924-2031/ã2015 Elsevier B.V. All rights reserved.
Vibrational Spectroscopy 77 (2015) 25–34
Contents lists available atScienceDirect
Vibrational Spectroscopy
properties of thefirst one look like those of orthorhombic crystals
[25], while the second one deviates strongly from this lower symmetry[26]. In the present work, we use DA for investigating a montebrasite crystal [LiAl(PO4)(OH]] with triclinic structure,
aiming to bring information about the optical and structural features of this system.
Montebrasite is the high hydroxyl end member of the amblygonite–montebrasite system, LiAl(PO4)(F,OH). In this
system, the amount of fluorine or hydroxyl anions can vary from 0 to 1 maintaining the crystal structure, which was shown to belong to the centrosymmetric P1 space group [27]. Montebrasite is a common mineral in granitic pegmatite of lithium, being an important source of this alkali metal for battery applications. It also has economic importance as a source of phosphate for fertilizers in agriculture[28], though amblygonite– montebrasite minerals are undesirable contaminants in spodu-mene in the refractory industry[29]. Crystals with good quality for the gemstone market are relatively rare, and practically all come from Brazilian pegmatites, which favor montebrasite over ambly-gonite[30]. Indeed, petrological studies revealed that highfluorine containing amblygonite is rare in granitic pegmatites, being present mainly in topaz-bearing granites[31]. In addition to the above cited economic and petrological interest, amblygonite– montebrasite system attracts scientific interest due to the possibility of studying their phase diagram (complete solid solution between F and OH end members)[28–33]. In the present work, a very good gemstone quality montebrasite was chosen for investigation of the intrinsic optical vibrational properties of this triclinic material, by combining dispersion analysis of the infrared reflectance spectra with polarized Raman scattering spectra.
2. Experimental
A natural single-crystal specimen of montebrasite from granitic pegmatite of the Telírio mine (Linópolis, Divino Laranjeiras, Minas Gerais, Brazil) was chosen for this work. This mine provides the best montebrasite gemstones of the world. The sample studied here has been characterized for its chemical formula, F/OH contents and metal impurities, and the results were published in a previous work, where the sample received the code AAM[28]. Our sample presented less than 1% of metal impurities (Na, Ti, Fe, Nb, V), and less than 3% offluorine (97% of OH), allowing us to write its formula in good approximation as LiAl(PO4)(OH). The sample
has been cut from a larger gemstone of excellent optical quality that was highly transparent (slightly yellowish), in a piece with 2.5 mm2.0 mm4.5 mm, in the form of a parallelepiped. For cutting the sample we used the orientation of perfect cleavage planes normal to [10 0] axis and good cleavage normal to [110] axis. From that the orthogonal axes asa//[10 0],b* (normal toaand close tob, once the [110] cleavage direction is known), andc*, parallel to ab* were defined [28]. Three corner-sharing faces were polished to optical grade to mimic the three adjacent faces of a cube.
The triclinic montebrasite structure has been determined as belonging to the centrosymmetric P1 space group, with unit cell parameters a= 5.18 Å, b= 7.15 Å and c= 5.04 Å, with
a
= 112.07,b
= 97.48 andg
= 67.53 [27]. This structure is characterized bydistorted AlO4(OH)2 octahedra interconnected along the [110]
direction by common hydroxyl groups. These octahedra are laterally interconnected by nearly perfect PO4 tetrahedra, while
the Li ions occupy the cavities left by the octahedral chains and PO4
tetrahedra[27,28]. The unit cell has two formula units (Z= 2). In this description, there are two non-equivalent aluminum positions with special Ci symmetry, while all other ions occupy general
positions with C1 symmetry. All Wyckoff positions are fully
occupied. This structure differs slightly from that proposed earlier by Simonov and Bjelov [34], who proposed two half-occupied non-equivalent lithium ions in general positions (C1 symmetry).
We will return to this difference after presenting our spectroscopic results. A quite useful alternative description of montebrasite structure was proposed by Groat et al. [31,33]. These authors proposed a hypothetical pseudo-monoclinic structure for describ-ing montebrasite–amblygonites, owdescrib-ing to the chemical and structural similarity between these materials and several impor-tant minerals (e.g., kieserite MgSO4H2O, and titanite CaTiSiO4O).
The unit cell for montebrasite would havea= 6.713 Å,b= 7.708 Å andc= 7.0194 Å, with
a
= 91.31,b
= 117.93andg
= 91.77andZ= 4 [33]. In this unit cell the octahedral chains are along the pseudo-monoclinicc-axis. Again, in this description, two non-equivalent half-occupied lithium ions were assumed. However, by revisiting the problem later[31], Groat et al. proposed that the occupancies of lithium in these two sites could be different from 0.5 and vary with temperature. As we have already indicated, our spectroscopic results allow us to discuss on these structural features.Polarized infrared measurements of the montebrasite crystal were performed by using two different Fourier transform spectrometers (FTIR). The mid-infrared spectra (550–4000 cm 1)
were collected under purge on a Nexus 470 (Thermo-Nicolet) with a SiC source, a KBr:Ge beamsplitter, an MCT detector and a grid polarizer onto a ZnSe substrate as standard accessories for this configuration. The far-infrared spectra (50–700 cm 1) were
collected under vacuum (1 Torr) on a DA-8 (BOMEM) spectrometer equipped with a SiC source, a mylar hypersplitter1, a Si-bolometer
detector and a wire grid polarizer onto a PE substrate. The reflectivity spectra in both spectral regions were obtained either, for low-incidence angle (11) or high-incidence angle (34), with
two different reflection accessories. The spectra were recorded by averaging at least 128 scans for each polarization, with the spectral resolution better than 4 cm 1. Gold mirrors were used for
obtaining the reference spectra. The infrared reflectivity spectra recorded in mid- and far-infrared regions matched well in the superposition region.
Polarized Raman spectra were collected at room temperature on the three sample surfaces, in parallel and crossed confi g-urations, using a Horiba/Jobin-Yvon LABRAM-HR spectrometer, equipped with a CCD detector and a confocal Olympus microscope (100 objective). The measurements were carried out in back-scattering geometry, for varying angles between sample edges and light-beam polarizations, using the 633 nm line of He–Ne laser (6 mW) as excitation source. Appropriate interference and edgefilters, half-wave plate and polarizer were used. The spectra were obtained between 50 and 3800 cm 1,
with spectral resolution of about 1 cm 1, by averaging
10 accumulations of 30 s.
3. Theoretical background
Dispersion analysis (DA) of the FTIR reflectivity spectra of montebrasite was performed by using the method described in Refs.[25]and[26], and summarized in the sequence. In the Drude– Lorentz model the dielectric tensor function
e
x;y;zð~vÞis the sum of
the damped harmonic Lorentz oscillators, which describe the
fingerprints occurring in an IR spectrum due to vibrations, plus a dielectric background tensor [
e
1], which is a (constant) offsetsummarizing all contributions from the UV and visible part of the spectrum.
For a dielectric non-magnetic and optically inactive triclinic crystal the dielectric tensor function has the following form:
e
x ;y;zð~vÞ ¼e
1 ;xxe
1 ;xye
1 ;xze
1;yx
e
1;yye
1;yze
1 ;zxe
1 ;zye
1 ;zz 2 4 3 5þ XNi¼1
S2 i
ðv~
2
i
~
v2
Þ i
g
iv~
sin2
Q
icos2F
i sin2Q
isinF
icosF
i sinQ
icosQ
icosF
i sin2Q
isinF
icosF
i sin2Q
isin2F
i sinQ
icosQ
isinF
isin
Q
icosQ
icosF
i sinQ
icosQ
isinF
i cos2Q
i 0 B @ 1 C A (1) In Eq.(1)the oscillator parameters are the resonance wavenumber,~
vi, the oscillator strength,Si, and the damping constant,
g
i. The twoangles
F
iandu
idescribe the orientation of the transition momentof theith oscillator relative to a right-handed coordinate system (x,
y,z) that isfixed within the crystal. The definition of
F
andu
is the same as that used in spherical coordinates, i.e., co-elevation and azimuth angles. The indexidenotes the number of the oscillator, so the sum runs over all oscillators present in the spectral part of interest. As there are no symmetry elements in a triclinic crystal (except for a possible inversion center), there is no predominant orientation for the transition moments within the crystal. As a consequence, the dielectric axes vary with frequency (F
iandu
idepend on~v), and the real and imaginary parts of the dielectric tensor have generally different main axes.
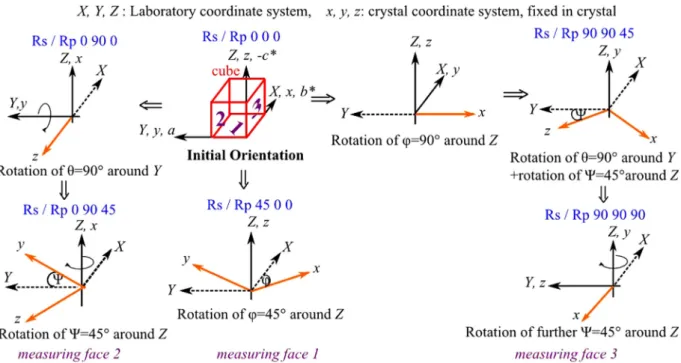
The measurement scheme of triclinic crystals developed in[25]
requires three orthogonal and optically polished faces carved out of the crystal. For convenience, the cut crystal is depicted as a cube.
Fig. 1 depicts the employed coordinate systems. To record the spectra, the cube is rotated into six different orientations, which are shown inFig. 2. For each one of the three orthogonal faces, four spectra with different polarization directions of the incoming light are recorded, so the number of measured spectra sums up to 12, as shown inFig. 3.
To describe the rotation of the sample within the spectrometer and to determine the dielectric tensor function
e
x;y;zð~vÞ in
laboratory coordinates (X,Y,Z), the tensor function is multiplied by a rotation matrixA(
’
,u
,c
). The rotation matrix is a function of the Euler anglesf
,u
, andc
which specify the rotation of the crystal sample in the spectrometer.e
X;Y;Z¼Að
’;
u;
c
Þe
x;y;zA
1
ð
’;
u;
c
ÞAð
’;
u;
c
Þ ¼Að’
Þ Aðu
Þ Aðc
ÞA(
f
) is a rotation matrix which describes a rotation around the (fixed)Z-axis,A(u
) a rotation around the (fixed)Y-axis andA(c
) again a rotation around theZ-axis.To yield expressions for the reflectivity of the calculated spectra thefirst order Maxwell equation:
@
@
ZC
¼ik0D
C
(3)is solved employing the dielectric tensor function. Eq.(3)describes the dependence of thefield vector
C
= (EX,HY,EY,HX)TinZ-direction.For the wave vectork=k0(0, sin
a
, cosa
)Twe assume a plane wavewith no component inX-direction, as the wave is travelling in the
Z–Yplane. The
D
-matrix is given by[25]:D
¼0 1 0 0
k2Yþ
e
XX eXZ2eZZ 0
e
XYeXZeYZ eZZ
kYeXZ eZZ kYeXZ
eZZ 0
kYeYZ
eZZ 1
k2 Y eZZ
e
XY eXZeYZeZZ 0
e
YYeYZ2 eZZ
kYeYZ eZZ 0 B B @ 1 C C A (4)
where in the
e
ij are the components of the dielectric tensorfunction. The solution of the eigenvalue problem of Eq.(4)is given by the determinant equation Det(
D
l
I) = 0, withl
being the four eigenvalues of the determinant equation andIthe identity matrix. Two of the four eigenvalues are either real or have a positive imaginary part and describe the forward travelling waves; the two other describe the backward travelling waves. From the corresponding eigenvectorsC
the dynamical matrixDC,crystalisgenerated:
DC ;crsytal¼
C
I;1 0C
II;1 0C
I;2 0C
II;2 0C
I;3 0C
II;3 0C
I;4 0C
II;4 00 B B @ 1 C C A (5)
Due to the assumption of a semi-infinite medium the second and fourth column, which describe the backward travelling waves of the dynamical matrix can be set to zero. The indices ijof
C
ij describe the eigenvector corresponding to the eigenvaluel
iandthe components of
C
= (EX,HY,EY,HX)T, respectively.The dynamical matrixDC,crystalof the crystal and the inverse
dynamical matrix of the incidence medium (air or vacuum),DC,inc,
link the amplitudes of the incident (As,Ap), reflected (Bs,Bp) and
transmitted (Cs,Cp) waves[35].
M¼DC1;incDC;crystaland As Bs Ap Bp 0 B B @ 1 C C A ¼
M11 M12 M13 M14
M21 M22 M23 M24
M31 M32 M33 M34
M41 M42 M43 M44 0 B B @ 1 C C A Cs 0 Cp 0 0 B B @ 1 C C A (6)
With Eq.(6)the measured quantitiesRsandRpcan explicitly be
calculated with the reflection coefficientsrij.The indexidescribes
the polarization state of the polarizer andjthe polarization state of the analyzer. As no analyzer was used, the reflectivitiesRsandRp
are Rs= Rss+ Rsp= rssrss*+ rsprsp* and Rp= Rps+ Rpp= rpprpp*+ rpsrps*
and the equations for rij as given below (rij* is the complex
conjugate ofrij).
rss¼ BAs s
¼M21M33 M23M31
M11M33 M13M31
rsp¼ BAp s
¼M41M33 M43M31
M11M33 M13M31
rps¼ ABs p
¼M11M23 M21M13
M11M33 M13M31
rpp¼ ABp p
¼M11M43 M41M13
M11M33 M13M31
(7)
[(Fig._1)TD$FIG]
Fig. 1.Applied coordinate systems and geometry for reflection measurements. (X,Y,
Z) are the laboratory coordinates, the plane of incidence is given by theY-Zplane,
the interface between crystal sample and vacuum is parallel to theX–Yplane. (x,y,z)
are the crystal coordinates fixed within the crystal, corresponding to cell
parameters (b*,a,-c*). The incidence angles were 11and 34.
4. Results and discussion
4.1. Dispersion analysis of montebrasite
Montebrasite belongs to the space group C1
i with all atoms occupying generalC1positions except for the Al ions, which occupy
two non-equivalent special positions with Ci symmetry [27].
According to [36] each of the 8 C1 positions contributes with
3Ag+ 3Au normal modes and each of the two special positions
contributes with 3Au modes. These normal modes sum up to
24Ag+ 30Aumodes, of which the Agmodes are Raman active and
the Aumodes are IR active. Among the 30Aumodes, 3Aumodes
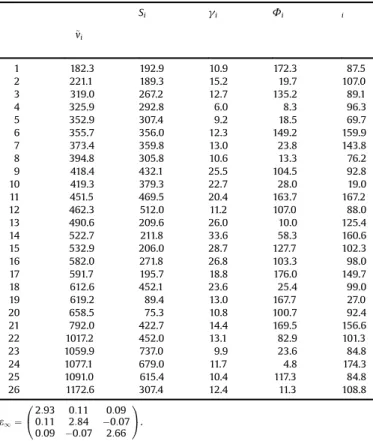
have to be subtracted as acoustic modes (translation of the crystal), so there remain 27 IR modes to be observed. By analyzing altogether the 12 low-incidence angle FTIR spectra of montebrasite with our optimization routine we found 26 oscillators below 1500 cm 1. The
fitted oscillator parameters are listed inTable 1. The parameters shown in this table have usual classical meaning (they are intrinsic to the crystal and independent on the measuring plane), but the azimuth and co-elevation angles are referred to a particular measuring configuration. In the present case, the crystal coordinates (x,y,z)fixed in the crystal correspond to the cut (b*, a, -c*) of our sample. The correspondence between the reflectivity spectra and crystal orientation (measuring planes and directions) is shown in Table 2. At around 3400–3350 cm 1 most spectra exhibit the O—H stretching vibrations; however we were not able tofind suitable Lorentz oscillators tofit this vibration.
The spectral region of the O—H stretching vibration is separately depicted inFig. 4. The vibration does not occur in the spectraRp90 90 90 (electricfieldE//c*),Rs90 90 90 (E//b*),Rp90 90
45 (E//b*+c*) andRs90 90 45 (E//b*–c*), which means that the transition moments creating this vibration is oriented perpendic-ularly to face 3 (b*c*), i.e., to the cleavage plane of montebrasite. This result agrees with previous structural studies of this crystal, which show that the OH bond is oriented approximately along its crystallographica-axis[27,28]. Consequently, the OH stretching vibration should have maximal reflectivity in spectraRp0 0 0/0 90
0 (E//a), as it is confirmed by the two upper spectra on the left panel ofFig. 4. TheRs0 0 0 (E//b*) andRs0 90 0 (E//c*), respectively on
planes 1 (ab*) and 2 (ac*), show weak intensity for this vibration, indicating smaller (but non-zero) components of the correspond-ing transition moment along these directions. This can explain the slightly higher intensities of this vibration for theRp45 0 0 (E// a+b*) overRs45 0 0 (E//a b*) on plane 1 (ab*), andRp0 90 45 (E// a+c*) over Rs 0 90 45 (E//a c*) on plane 2 (ac*). As a whole,
concerning the amplitude of the reflectivity, the spectral
[(Fig._2)TD$FIG]
Fig. 2.For dispersion analysis six different orientations are employed, for each orientation two spectra were recorded, one spectrum with p-polarization (polarization direction of the incoming light parallel to the plane of incidence) and one spectrum with s-polarization (polarization direction perpendicular to the plane of incidence). The
laboratory coordinates (X,Y,Z) stayfixed, the crystal coordinates (x,y,z) arefixed within the crystal and therefore rotated with the crystal. Solid arrows are used for the crystal
coordinates, which are black if coincident with laboratory axes, orange otherwise. In the latest case, broken axes are used forXorYnon-coincident axis. (For interpretation of
the references to color in thisfigure legend, the reader is referred to the web version of this article.)
[(Fig._3)TD$FIG]
Fig. 3.Illustration of how the different spectra and polarization directions created by the six rotations are distributed on the crystal cube. The numbers 1, 2, 3 numerate the cube faces.
characteristics of the OH stretching vibration in the different used polarized configurations are quite consistent. However, a very intriguing frequency dispersion occurred for the different mea-sured faces. Indeed, the characteristic frequency of the vibration presented an almost 25 cm 1upshift on all spectra taken on face 2
(ac*) compared to face 1 (ab*). This upshift cannot be described by our theoretical model based upon independent Lorentz oscillators. For this reason, ourfitting curves onFig. 4 are all at the same (average) frequency position and cannot describe the observed dispersion. The mechanism underlying such effect is unknown at the light of the experimental data available so far and is beyond the scope of the present work. It deserves further investigation and should be addressed in future works.
The PO3
4 tetrahedra contribute with 5(3Ag+ 3Au) = 15Ag
Raman active +15AuIR active modes. The IR active modes consist
of 6 librational modes and 9 internal modes, 3
n
3(Au), 1n
1(Au),3
n
4(Au) and 2n
2(Au)[36]. With the help of[30,32,37–40]atentative band assignment can be made for the calculated oscillators, although band assignment is complicated by resonance of dipole-dipole interactions between PO34 groups, which can lead to additional band splitting [41,42], and also because the low frequency external modes are linear combinations of motions involving several ions. Oscillator 26 around 1173 cm 1is likely the
OH-bending mode, as often observed in related materials [40]. Oscillators 22–25 most probably contain the 3
n
3 and then
1vibration of the phosphate tetrahedra. Crystal structure analysis revealed only little distorted PO3
4 tetrahedra[27], since oscillators 23–25 are roughly orthogonal within calculation errors (Table 3), but oscillator 22 does not fit into the orthogonality. Oscillator 23 has maximum intensity in spectraRp90 90 90,Rs0 90 0,Rs90 90
45 and with a little less intensity inRs0 90 45. The oscillator is not
visible inRp0 0 0, and occurs in the other spectra with very low
intensity. From these considerations it follows that the corre-sponding transition moment must be oriented almost perpendic-ular to the cube measuring face 1 (ab*). This assumption is confirmed by the optimization which found an angle pair with
F
= 169.5andu
= 156.6. The spectra show that the vibration at792 cm 1, corresponding to the oscillator 21, is a vibration of a
linear or two dimensional compound as the reflection intensity strongly depends on the polarization direction of the incoming light. This oscillator is also related to the presence of hydroxyl groups[32], and is probably linked to P—OH stretching and P—O— H torsional motions [40]. Oscillators 1 + 2 are most probably librational modes of the crystal compounds, as librational modes usually are characterized by low wavenumbers. The remaining oscillators 3–20 accounts for the 3
n
4(asymmetric bending), the2
n
2 (symmetric bending) of the phosphate tetrahedra, the6 librational modes, and the external lattice modes.
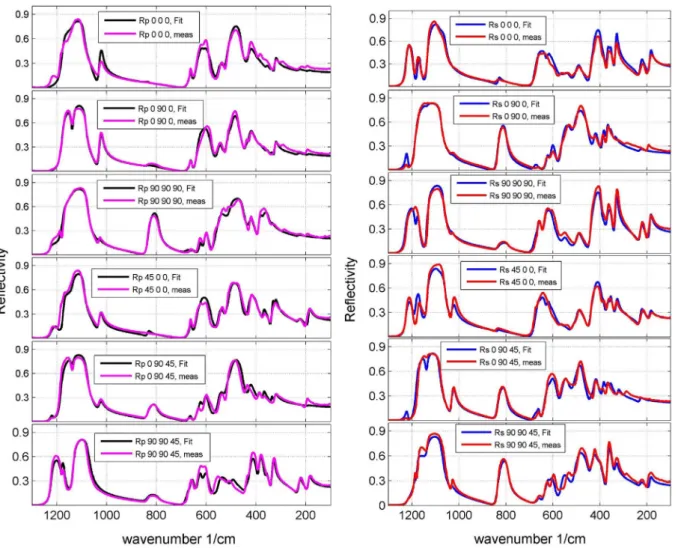
The 12 measured spectra from the cube-shaped montebrasite single crystal are depicted inFig. 5together with the correspond-ing best fitting spectra. Fig. 5 (right) shows the spectra with polarization direction perpendicular to the plane of incidence;
Fig. 5(left) shows the spectra with polarization direction parallel to the plane of incidence. As the angle of incidence was 11, the
p-polarization is not exactly along the cube edges or face diagonals. Diverse test simulations showed that the effect of the deviation of 11 from normal incidence on the optimization of spectra of
triclinic crystals is not measureable due to a large error for the
fitted angles[26]. As a whole, the comparison between measured and calculated spectra shows a satisfyingly agreement for the investigated spectral ranges.
For thefittings the number of oscillators was chosen according to the expected number of oscillators, as in the case of montebrasite easily 27 or more additional oscillators can be employed by the optimization if it is based only on the number of
Table 1
Dispersion parameters for montebrasite: resonance frequency~vi, strength Si,
dampinggi, all three in cm 1, and anglesFi and iin degree. The dielectric
background tensor e1 is without units. The oscillators are given with one
decimal and two decimals in case of the dielectric background tensor as they
were calculated by the optimization, although the digits do not reflect the
accuracy of the parameters.
~ vi
Si gi Fi i
1 182.3 192.9 10.9 172.3 87.5
2 221.1 189.3 15.2 19.7 107.0
3 319.0 267.2 12.7 135.2 89.1
4 325.9 292.8 6.0 8.3 96.3
5 352.9 307.4 9.2 18.5 69.7
6 355.7 356.0 12.3 149.2 159.9
7 373.4 359.8 13.0 23.8 143.8
8 394.8 305.8 10.6 13.3 76.2
9 418.4 432.1 25.5 104.5 92.8
10 419.3 379.3 22.7 28.0 19.0
11 451.5 469.5 20.4 163.7 167.2
12 462.3 512.0 11.2 107.0 88.0
13 490.6 209.6 26.0 10.0 125.4
14 522.7 211.8 33.6 58.3 160.6
15 532.9 206.0 28.7 127.7 102.3
16 582.0 271.8 26.8 103.3 98.0
17 591.7 195.7 18.8 176.0 149.7
18 612.6 452.1 23.6 25.4 99.0
19 619.2 89.4 13.0 167.7 27.0
20 658.5 75.3 10.8 100.7 92.4
21 792.0 422.7 14.4 169.5 156.6
22 1017.2 452.0 13.1 82.9 101.3
23 1059.9 737.0 9.9 23.6 84.8
24 1077.1 679.0 11.7 4.8 174.3
25 1091.0 615.4 10.4 117.3 84.8
26 1172.6 307.4 12.4 11.3 108.8
e1¼
2:93 0:11 0:09
0:11 2:84 0:07
0:09 0:07 2:66
0 @
1 A.
Table 2
Measuring configurations of the infrared reflectivity spectra of montebrasite:ais the [10 0] direction, defined by the perfect cleavage normal to this direction;b* andc* are
normal toaand close tobandc-axes, respectively.fcorrare correction factors for the spectra measured with incidence angle of 34to level out the reduced reflectivity for
higher incidence angles.
Spectrum Rp0 0 0 Rp0 90 0 Rp90 90 90 Rp45 0 0 Rp0 90 45 Rp90 90 45
Face 1 2 3 1 2 3
Plane ab* ac* b*c* ab* ac* b*c*
Direction a a c* a + b* a + c* c* + b*
fcorr 0.63 0.86 0.81 0.57 0.77 0.79
Spectrum Rs0 0 0 Rs0 90 0 Rs90 90 90 Rs45 0 0 Rs0 90 45 Rs90 90 45
Face 1 2 3 1 2 3
Plane ab* ac* b*c* ab* ac* b*c*
Direction b* c* b* a b* a c* c* b*
fcorr 0.52 0.59 0.61 0.39 0.73 0.61
bands present in the measured spectral range. Too many oscillators result in particular in the case if many weaker oscillators are spectrally very close as it is the case in 700–100 cm
1.
InFig. 6the calculated angle orientation for each of thefitted oscillators is depicted. As is shown inFig. 1the calculated angles give the orientation of the transition moment with respect to the normal face of the cube, in which the spectraRs/Rp0 0 0 andRs/Rp
45 0 0 were recorded, i.e., face 1 (ab*).Fig. 6 shows that the transition moments roughly point into three different directions, which means that montebrasite shows an almost orthorhombic-like IR spectral behavior.
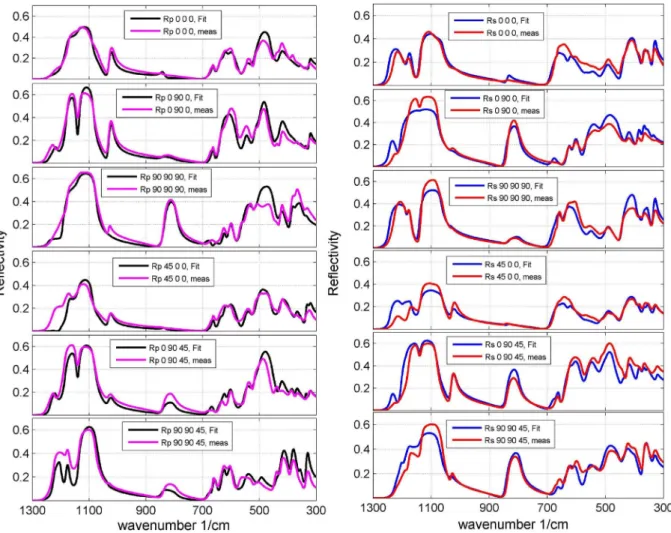
4.2. Verification of the oscillator parameters
To verify the correctness of the calculated oscillator parameters, the obtained parameters can be employed to predict spectra, e.g., the reflection spectra of a pressed pellet made of crushed sample material, as it was done in[25,26], or another set of spectra with high incidence angle can be recorded. The higher the incidence angle gets, the more the p-polarization of the incoming light excites oscillators of two orthogonal cube faces. The consequence
is that for high incidence angles theRpspectra are mixed spectra of
the oscillators of two orthogonal cube faces. The effect is maximal for an incidence angle of 45. In the present work, as the authors
did not want to crush the (gem) crystal, a second set of spectra with an incidence angle of 34was measured. Tofit the second spectra
set the oscillators and dielectric background tensor ofTable 1were employed, the only variable left to optimize was a constant correction factorfcorrfor each cube face to level out the reduced
reflectivity for higher incidence angles (because of experimental difficulties). The correction factors for the second set of spectra are given inTable 2.Fig. 7shows the second spectra set optimized with the oscillator parameters gained from the spectra set measured with an incidence angle of 11. Overall, the spectra for incidence
angle 34 could satisfyingly be reproduced with the oscillator
parameters gained from the first spectra set. The most distinct discrepancy between measured and modeled spectra can be found between 1300 and 1100 cm 1for theR
s/Rp45 0 0 spectra. Since all
other modeled spectra resemble the measured ones, we assume that this discrepancy is due to misalignment errors, as especially for triclinic crystals the optimization is quite sensitive to correct orientation of the sample within the spectrometer.
[(Fig._4)TD$FIG]
Fig. 4.Experimental (red and pink) and modeled spectra (blue and black) of the O—H stretching vibration of the cube shaped montebrasite crystal employing p- (left) and
s-(right) polarization of the incoming light and an incidence angle of 11. Due to an unclear behavior of the stretching vibration we were not able tofit this spectral region. (For
interpretation of the references to color in thisfigure legend, the reader is referred to the web version of this article.)
Table 3
Calculated angles between oscillators 22–26.
Oscillators Angle Oscillators Angle Oscillators Angle Oscillators Angle
22–23 61.3
22–24 77.5 23–24 89.8
22–25 37.9 23–25 93.2 24–25 97.3
22–26 69.13 23–26 26.8 24–26 65.5 25–26 106.8
4.3. Raman scattering results for montebrasite
Polarized Raman spectra of the montebrasite crystal were recorded on the three planes, for parallel and perpendicularly polarized light. All the spectra show the same features, since triclinic Raman tensors have, in principle, non-null elements for
any scattering configurations. However, the intensities of the individual bands depend on the particular measuring confi gura-tion, as it can be seen inFig. 8, which shows the parallel-polarized Raman spectra of montebrasite taken on face 2, i.e., ac*, with polarizers alongaorc* sample axes. We note particularly a high intensity of OH stretching band around 3380 cm 1fora
-polariza-tion, and that some bands seem to vanish for one polariza-polariza-tion, whereas they are intense for perpendicular polarization. It is important to mention that, as montebrasite belongs to a centro-symmetric group, the Raman phonon frequencies do not depend on the measuring configuration (indeed, we checked this point by comparing spectra taken onto different crystal faces and orienta-tions, which give always the same positions for all bands). Once the intensity of the bands depends, however, on the polarization direction, we have recorded the Raman spectra for several polarization directions.Fig. 9shows the Raman spectra recorded on theac*-plane for polarized light making an angle from 0 to 180
with thea-direction (90meansc* polarization, the sample was
turned clockwise around theb*-axis).
Fig. 9a (100–580 cm 1) shows the variations of the 14 lowest-frequency modes with polarization angle. These modes correspond roughly Li—O vibration, AlO6bending and PO4bending modes[30],
but a definite assignment was not done so far and it is beyond our purposes.Fig. 9b (560–950 cm
1) shows the behavior of three AlO 6
stretching modes (#15 to 17) and a hydroxyl-related mode at around 798 cm 1, likely due to P
—OH stretching and P—O—H
[(Fig._5)TD$FIG]
Fig. 5.Experimental (red and pink) and modeled spectra (blue and black) of the cube shaped montebrasite crystal employing p- (left) and s- (right) polarization of the
incoming light and an incidence angle of 11. Due to the incidence angle of 11theR
p-spectra have a small component normal to the surface. (For interpretation of the
references to color in thisfigure legend, the reader is referred to the web version of this article.)
[(Fig._6)TD$FIG]
Fig. 6.Calculated orientation angles for thefitted oscillators. The orientation angles
are given with respect to the face normal of the cube face of which theRs/Rp0 0 0/45
0 0 spectra are taken. The angle distribution shows roughly three different directions of the transition moments, which indicates almost orthorhombic-like IR spectral behavior.
torsion[32,40], as observed in the IR spectra.Fig. 9c presents the variations of the four PO4stretching modes (#19 to 22) and the OH
bending mode (#23) with polarization angle. The spectra shown in
Fig. 9a–c (along with the OH stretching mode at 3383 cm 1) allowed us to obtain the complete set of 24 Raman-active modes of montebrasite, presented inTable 4.
A weak feature at around 873 cm 1 (whose intensity is
comparable with that of the 548 cm 1band) was not considered
in our analysis. We think that it could be a signature of anharmonicity, as are some other very weak features around 1581, 2240, 2360, 3255 and 3513 cm 1. The spectra ofFig. 9a
–c also show that one must take care in analyzing Raman spectra of triclinic crystals, once some bands can be absent in some orientations, as exemplified inFig. 9d that presents the intensity variations of four chosen bands. Notice that the intensity of bands around 277, 798 and 1187 cm 1 vanish in parallel light for
polarizers along the c* direction (having maxima along the a
direction). Conversely, the 139 cm 1band has its maximum along c* and vanish alonga.
Now by taking the IR and Raman spectra altogether, we can conclude that the investigated montebrasite sample presented a very good crystallographic order. Indeed, we were able to depict all the well-behaved 27 IR and 24 Raman modes predicted by group theory for the P1 crystal structure. The Raman modes did not show any behavior of polar elliptical phonons, i.e., the IR modes were not activated in the Raman spectra and the frequencies were
independent on the particular scattering configuration. Converse-ly, the IR modes showed normal behavior of polar phonons. As a consequence, we can conclude that defects play no significant role in this natural crystal, within the limits of our experimental
[(Fig._7)TD$FIG]
Fig. 7.Experimental (red and pink) and modeled (blue and black) spectra of the cube shaped montebrasite. The spectra were recorded with incidence angle of 34and
modeled with the oscillator parameter gained by the spectra set recorded with incidence angle of 11. A constant correction factorf
corrwas adjusted for each spectrum to level
out the reduced reflectivity for higher incidence angles. (For interpretation of the references to color in thisfigure legend, the reader is referred to the web version of this
article.)
[(Fig._8)TD$FIG]
200 400 600 800 1000 1200 0.0 0.5 1.0 1.5 2.0
3200 3400
36000 1 2 3 4
Raman
Int
ensit
y
/
1
0
3
count
s
a on ac*-plane c* on ac*-plane
wavenumber 1/cm
Fig. 8.Parallel-polarized Raman spectra of montebrasite on face 2 (ac*), along axes
aandc*, from 100 to 1300 cm 1. The inset shows the spectral region around the OH
stretching mode.
accuracy. Also, and with important consequences for the analysis of montebrasite system, our results are compatible with fully occupied atomic sites, as proposed by Baur [27]. In fact, half-occupied or partially half-occupied lithium sites as proposed by other authors[31,33,34]would lead to an increasing number of modes because vacancies must be counted (three additional IR and three new Raman modes not observed here). Moreover, because the Li vacancies in such structure would be disordered, this would lead to broad IR and Raman bands. As it can be seen in our spectra and
fitting bands, the depicted IR and Raman modes are relatively narrow, which is not compatible with a disordered structure. Since montebrasite–amblygonite constitutes a natural system, our conclusion is that the analysis of our montebrasite sample showed that it has a well-ordered structure with just one fully occupied Li site.
[(Fig._9)TD$FIG]
100
200
300
400
500
900
800
700
600
900
1000
1100
1200
14
(a)
10 13
12 11
9 8 6
7 5
2
3 4
R
a
m
a
n
int
ensi
ty
wavenumber 1/cm
1
0
o180
o0
30
60
90 120 150 180
139
1187
798
Raman
intensity
rotation angle (degrees)
(d)
227
(b)
1817
16 15
wavenumber 1/cm
(c)
23
22 20
21 19
Ra
m
a
n
in
te
n
s
ity
wavenumber 1/cm
Fig. 9.Angular dependence of parallel-polarized Raman spectra of montebrasite on face 2 (ac*), into different spectral regions: (a) from 100 to 580 cm 1; (b) from 560 to
950 cm1and (c) from 900 to 1250 cm 1. The depicted peaks are numbered from 1 to 24. Rotation angles aroundb* vary at each 10, from 0 (parallel toa-axis) to 180. The
sample was rotated clockwise. (d) The intensity dependence of four chosen bands as a function of the rotation angle.
Table 4
Depicted Raman modes for montebrasite.
# This work Rondeau et al.[30] #Cont. This work Rondeau et al.[30]
1 139 (5) – 13 493 (11) –
2 172 (8) 170 14 548 (8)
3 198 (8) – 15 600 (7) 600
4 229 (16) – 16 626 (7) –
5 277 (6) – 17 646 (7) 645
6 297 (4) 295 18 798 (13) –
7 312 (5) – 19 1012 (11) 1012
8 324 (5) – 20 1046 (9) 1045
9 396 (11) – 21 1057 (8) 1057
10 415 (6) – 22 1108 (10) 1107
11 428 (5) 427 23 1187 (11) –
12 483 (9) – 24 3383 (11) 3379
5. Conclusions
We have performed dispersion analysis of a triclinic monte-brasite crystal, from the polarized-reflectivity infrared spectra taken at low-incidence angle and checked for a higher incidence angle. The spectra revealed 27 well-behaved polar modes, in agreement with group theory for the P1 space group. The complete set of dispersion parameters was obtained, including the azimuth and co-elevation angles for each polar (ungerade) phonon. Polarized Raman spectra in several scattering configurations allowed us to depict the 24 gerade modes predicted for this structure. For these non-polar phonons, frequencies and band-widths were independent of the scattering geometry, while their scattered intensities depend individually on the particular scattering geometry. The Raman and IR selection rules were well obeyed and all the observed bands were relatively narrow. These facts altogether (number of modes, selection rules and band-widths) are compatible with a well-ordered material with fully occupied atomic sites.
Acknowledgments
The Brazilian authors thank the Conselho Nacional de Desenvolvimento Científico e Tecnológico (CNPq) and the Funda-ção de Amparo à Pesquisa do Estado de Minas Gerais (FAPEMIG) for
financial support. The German authors thank the Deutsche Forschungsgemeinschaft forfinancing the investigations that led to the development of the dispersion analysis formalism of triclinic crystals employed in this work.
References
[1]M. Czerny, Z. Phys 65 (1930) 600–631.
[2]W.G. Spitzer, D.A. Kleinman, D. Walsh, Phys. Rev. 113 (1959) 127–132.
[3]W.G. Spitzer, D.A. Kleinman, Phys. Rev. 121 (1961) 1324–1335.
[4]F. Gervais, P. Echegut, Infrared studies of incommensurate systems, in: R. Blinc, A.P. Levanyuk (Eds.), Incommensurate Phases in Dielectrics–Fundamentals,
Amsterdam, North Holland, 1986, pp. 337–364.
[5]M. Balkanski, Optical properties due to phonons, in: T.S. Moss, M. Balkanski (Eds.), Handbook on Semiconductors, Amsterdan, North-Holland, 1980, pp. 497–543.
[6]E.E. Koch, A. Otto, K.L. Kliewer, Chem. Phys. 3 (1974) 362–369.
[7]J. Herranz, J.M. Delgado, Spectrochim. Acta A 31 (1975) 1255–1263.
[8]V.F. Pavinich, M.V. Belousov, Opt. Spectrosc. 45 (1978) 881–883.
[9]J.R. Aronson, A.G. Emslie, E.V. Miseo, E.M. Smith, P.F. Strong, Appl. Opt. 22 (1983) 4093–4098.
[10]A.B. Kuz'menko, E.A. Tishchenko, V.G. Orlov, J. Phys.: Condens. Matter 8 (1996) 6199–6212.
[11]A.B. Kuz'menko, D. van der Marel, P.J.M. van Bentum, E.A. Tishchenko, C. Presura, A.A. Bush, Phys. Rev. B 63 (2001) 94303.
[12]A. Gössling, T. Möller, W.-D. Stein, P. Becker, L. Bohatý, M. Grüninger, Phys. Stat. Sol. (b) 242 (2005) R85–R87.
[13]J.L. Ribeiro, L.G. Vieira, I. Tarroso Gomes, D. Isakov, E. de Matos Gomes, M. Belsley, J. Phys.: Condens. Matter 19 (2007) 176255.
[14]V. Ivanovski, T.G. Mayerhöefer, J. Popp, Vib. Spectrosc. 44 (2007) 369–374.
[15]V. Ivanovski, T.G. Mayerhöefer, J. Popp, Spectrochim. Acta A 68 (2007) 632–638.
[16]V. Ivanovski, T.G. Mayerhöefer, J. Popp, V.M. Petruševski, Spectrochim. Acta A 69 (2008) 629–641.
[17]V. Ivanovski, T.G. Mayerhöefer, J. Popp, Vib. Spectrosc. 47 (2008) 91–98.
[18]V. Ta Phuoc, C. Sellier, E. Janod, C. Marin, Phys. Rev. B 77 (2008) 075123. [19]V. Ivanovski, G. Ivanovski, Spectrochim. Acta A 75 (2010) 1452–1461.
[20]T.G. Mayerhöfer, S. Webber, J. Popp, Opt. Commun. 284 (2011) 719–723.
[21]T.G. Mayerhöfer, V. Ivanovski, J. Popp, Vib. Spectrosc. 63 (2012) 396–403.
[22]T. Möller, P. Becker, L. Bohatý, J. Hemberger, M. Grüninger, Phys. Rev. B 90 (2014) 155105.
[23]A.G. Emslie, J.R. Aronson, J. Opt. Soc. Am. 73 (1983) 916–919.
[24]J.R. Aronson, A.G. Emslie, P.F. Strong, Appl. Opt. 24 (1985) 1200–1203.
[25]S. Höfer, J. Popp, T.G. Mayerhöfer, Vib. Spectrosc. 67 (2013) 44–54.
[26]S. Höfer, J. Popp, T.G. Mayerhöfer, Vib. Spectrosc. 72 (2014) 111–118.
[27]W.H. Baur, Acta Crystallogr. 12 (1959) 988–994.
[28]L.N. Dias, M.V.B. Pinheiro, R.L. Moreira, K. Krambrock, K.J. Guedes, L.A.D. Menezes Filho, J. Karfunkel, J. Schnellrath, R. Scholz, Am. Mineral. 96 (2011) 42–52.
[29]I.Cerná, P.Cerný, R.B. Ferguson, Am. Mineral. 58 (1973) 291 –301.
[30]B. Rondeau, E. Fritsch, P. Lefevre, M. Guiraud, A.-M. Fransolet, Y. Lulzac, Can. Mineral. 44 (2006) 1109–1117.
[31]L.A. Groat, B.C. Chakoumakos, D.H. Brouwer, C.M. Hoffman, C.A. Fyfe, H. Morell, A.J. Schultz, Am. Mineral. 88 (2003) 195–210.
[32]A.-M. Fransolet, P. Tarte, Am. Mineral. 62 (1977) 559–564.
[33]L.A. Groat, M. Raudsepp, F.C. Hawthorne, T. Scott Ercit, B.L. Sherriff, J.S. Hartman, Am. Mineral. 75 (1990) 992–1008.
[34]V.I. Simonov, N.V. Belov, Kristallografiya 3 (1958) 428–437.
[35]P. Yeh, Optical Waves in Layered Media, Wiley, New York, 1988.
[36]D.L. Rousseau, R.P. Bauman, S.P.S. Porto, J. Raman Spectrosc. 10 (1981) 253–290.
[37]H.H. Adler, Am. Mineral. 49 (1964) 1002–1015.
[38]R.L. Frost, J.Cejka, G.A. Ayoko, M. Weier, Spectrochim. Acta A 66 (2007) 979–984.
[39]C.C. Pye, W.W. Rudolph, J. Phys. Chem. A 107 (2003) 8746–8755.
[40]N. Maubec, A. Lahfid, C. Lerouge, G. Wille, K. Michel, Spectrochim. Acta A 96 (2012) 925–939.
[41]D.A. Rusakov, A.A. Filaretov, M.N. Bubentsova, V.P. Danilov, L.N. Komissarova, Russ. J. Inorg. Chem. 51 (2006) 852–861.
[42]D.S. Andrianov, A.S. Blagoveshchenskii, T.D. Kolomiitsova, D.N. Shchepkin, Opt. Spectrosc. 94 (2003) 513–527.