MERGERS AND ACQUISITIONS CASE STUDY
THE CASE OF PEPSICO AND WHITEWAVE
MARIA LOBATO DE FARIA LAGES ABRANTES
152113350
Dissertation submitted in partial fulfillment of the requirements for the
degree of MSc in Business Administration at
Católica - Lisbon School of Business & Economics
Thesis written under the supervision of
Professor António Luís Traça Borges de Assunção
Abstract
This work is an analysis of the potential acquisition of WhiteWave by PepsiCo, two US publicly-traded players of the food and beverage industry. WhiteWave is a market leader in the emergent segments of the industry, including plant-based beverages and organic dairy. The firm presented a solid growth performance over the last periods and this trend is expected to continue as consumers are shifting their preferences from unhealthy food to protein, fiber, whole grains and organic products.
A combined firm would benefit from the established presence of WhiteWave in the growing segments of the industry and the scale and expertise of PepsiCo. Together, they would combine the target’s skills in developing products with high consumer loyalty and growth potential, with the acquirer’s production’s capacity, scale and financial resources.
We began by analyzing both firms separately using three valuation methods: the DCF-WACC, the APV and the market multiples approach. Using these three methods, we concluded that WhiteWave has an enterprise value between $8,601 and $9,634 million and PepsiCo one of $178,833 to $196,778 million.
We calculated the value of the synergies by analyzing the impact of the acquisition on the target’s costs and growth opportunities and used its cost of capital as the discount rate. The total value of synergies is between $873 million and $1,182 million, of which approximately 75% is the result of cost savings.
We recommend PepsiCo to acquire WhiteWave for a share price of $46,61 in cash, representing a 12% premium over the target’s market value1.
1 05/11/15
Sumário Executivo
Este trabalho consiste numa análise da potencial aquisição da WhiteWave pela PepsiCo, empresas públicas norte-americanas, que operam na indústria alimentar. A WhiteWave é líder de mercado em segmentos emergentes desta indústria, nomeadamente, bebidas à base de plantas e lacticínios orgânicos. A empresa tem vindo a apresentar um crescimento sólido e esta tendência aparenta continuar visto que os consumidores estão a trocar as suas preferências por alimentos calóricos e artificiais para proteínas, fibra e produtos orgânicos.
Uma combinação destas empresas iria beneficiar da forte presença da WhiteWave nestes segmentos industriais em crescimento e da dimensão e experiência da PepsiCo. Juntas combinarão as competências do target em desenvolver marcas e produtos com grande potencial de crescimento com as capacidades financeiras, dimensão e capacidade de produção do comprador.
Foi feita uma análise das duas empresas em separado, usando os métodos de avaliação DCF-WACC, APV e múltiplos. Concluímos que a WhiteWave tem um valor entre $8,601e $9,634 milhões e a PepsiCo entre $178,833 e $196,778 milhões.
No cálculo das sinergias, avaliámos os efeitos da aquisição na estrutura de custos e potencial de crescimento do target e utilizámos o seu custo de capital como taxa de desconto. O valor total das sinergias é entre $873 e $1,182 milhões, sendo que cerca de 75% deste valor resulta de redução de custos.
A nossa recomendação é de que a PepsiCo adquira a WhiteWave por um valor de $46.61 por ação, em dinheiro, representando um prémio de 12% face ao valor de mercado do target2.
2 05/11/15
Acknowledgements
I would like to express my sincere gratitude to my dissertation supervisor António Borges de Assunção, for his continuous orientation and advice as well as for his constant availability to give feedback and to answer my questions.
I am extremely grateful to my parents, Eduarda Lobato de Faria and José Luis Abrantes, for their constant support in all my choices and guidance throughout my studies.
Lastly, I want to thank my family, particularly my grandparents and sisters, and my friends, especially Duarte, for their enthusiasm and encouragement.
Table of Contents
Introduction ... 7
1. Literature Review ... 8
1.1. Motives for Mergers and Acquisitions ... 8
1.2. Synergies Overview ... 10
1.3. Valuation Techniques ... 13
1.3.1. The Discounted Cash Flow Approach ... 14
1.3.1.1. Cost of Equity ... 14 1.3.1.2. Cost of Debt ... 15 1.3.1.3. Cost of Capital ... 15 1.3.2. WACC ... 16 1.3.3. APV ... 16 1.4. Forms of Payment ... 18 2. Industry Overview ... 19
2.1. The Food and Beverage Industry ... 19
2.1.1. Industry Environment ... 19
2.1.2. Current Trends and Challenges ... 20
2.1.3. Growth Opportunities ... 21
2.1.4. M&A in the Industry ... 22
2.2. The WhiteWave Foods Company ... 23
2.2.1. Business Profile ... 23
2.2.2. Key Competitive Advantages and Challenges ... 23
2.2.3. WhiteWave and Dean Foods ... 24
2.2.4. Financial Profile ... 25
2.2.4.1. Growth Performance ... 25
2.2.4.2. Profitability Performance ... 25
2.2.4.3. Management Effectiveness ... 26
2.2.4.4. Stock Performance ... 26
2.2.4.5. Ownership and Governance Structure ... 27
2.3. PepsiCo ... 28
2.3.1. Business Profile ... 28
2.3.2. Key Competitive Advantages and Challenges ... 28
2.3.3. Financial Profile ... 29
2.3.3.1. Growth Performance ... 29
2.3.3.2. Profitability Performance ... 29
2.3.3.3. Management Effectiveness ... 30
2.3.3.4. Stock Performance ... 30
2.3.3.5. Ownership and Governance Structure ... 31
2.4. Conclusions and Deal Rationale ... 32
3. Independent Firms’ Valuation ... 33
3.1. Target Valuation (WhiteWave) ... 33
3.1.1. Comparable Companies’ Analysis ... 33
3.1.1.1. Peer Group ... 33
3.1.1.2. Multiples and Firm Value ... 34
3.1.2. Financial Projections ... 34
3.1.2.1. Revenues ... 35
3.1.2.2. EBITDA ... 36
3.1.2.3. CAPEX ... 37
3.1.2.4. Depreciation & Amortization ... 38
3.1.2.5. Investment in Working Capital ... 38
3.1.2.6. Debt Structure ... 39
3.1.3. DCF - WACC ... 40
3.1.3.1. Cost of Capital ... 40
3.1.3.3. Terminal Value ... 42
3.1.3.4. Firm Value ... 43
3.1.4. APV ... 44
3.1.4.1. Base Case Scenario ... 44
3.1.4.2. Interest Tax Shields ... 44
3.1.4.3. Bankruptcy Cost ... 45
3.1.4.4. Firm Value ... 45
3.1.5. Target Valuation Conclusion ... 46
3.2. Acquirer Valuation (PepsiCo) ... 47
3.2.1. Comparable Companies’ Analysis ... 47
3.2.1.1. Peer Group ... 47
3.2.1.2. Multiples and Firm Value ... 47
3.2.2. Financial Projections ... 47
3.2.2.1. Revenues ... 48
3.2.2.2. EBITDA ... 48
3.2.2.3. CAPEX ... 49
3.2.2.4. Depreciation & Amortization ... 49
3.2.2.5. Investment in Working Capital ... 49
3.2.2.6. Debt Structure ... 50 3.2.3. DCF - WACC ... 52 3.2.3.1. Cost of Capital ... 52 3.2.3.2. FCF Projections ... 53 3.2.3.3. Terminal Value ... 53 3.2.3.4. Firm Value ... 54 3.2.4. APV ... 55
3.2.4.1. Base Case Scenario ... 55
3.2.4.2. Interest Tax Shields ... 55
3.2.4.3. Bankruptcy Cost ... 56
3.2.4.4. Firm Value ... 56
3.2.5. Acquirer Valuation Conclusion ... 57
4. Post-Acquisition Analysis ... 58
4.1. Cost Synergies ... 59
4.2. Growth Synergies ... 59
4.3. Total Value of Synergies ... 60
5. Deal Analysis ... 62 5.1. Target Price ... 62 5.2. Transaction Costs ... 63 5.3. Form of Payment ... 63 6. Conclusion ... 65 References ... 66 Appendices ... 70 List of Appendices ... 92 List of Figures ... 93 List of Tables ... 94
Introduction
The global food industry is highly affected by changes on consumers’ preferences, which may be due to such factors as taste and lifestyle. Currently, consumers are more informed about what they buy and are increasingly interested in natural and healthy ingredients. Consequently, sales of fat and sugary food such as carbonated drinks are expected to grow at less than 1%. Another trend affecting the food industry is the increasing number of lactose intolerant individuals, which are recommended to avoid dairy products and to opt for alternatives, such as plant-based food and beverages. Therefore, there are two major opportunities among the food industry: the organic food segment and the plant-based food and beverages segment.
In this work we will analyze the potential acquisition of WhiteWave by PepsiCo. With a market capitalization of $146,588 million (05/11/15), PepsiCo, mostly known for its beverages and snacks, is facing a decrease in sales due to consumers’ shift to more healthy food. Over the past years, the firm has been focusing on beverages with less sugar and more natural ingredients to respond to consumers’ preferences. WhiteWave is a US based producer of dairy products and plant-based foods and beverages, holding, among others, the brands Alpro® and Provamel®. The firm has a market capitalization of $7,259 million (05/11/15) and its volume of sales has increased by an average of 19.3% annually since 2013.
The first section of this work will be the literature review, consisting of an overview of the relevant literature regarding the motives for mergers and acquisitions, the different types of synergies and the valuation techniques used to analyze the target company.
Secondly, we will present an overview of the business and financial profile of WhiteWave and PepsiCo as well as a review of the food and beverage industry, with a particular focus on the current trends and business opportunities.
The third section will include a separate valuation of both firms, using the DCF-WACC, the APV and the market multiples methods.
In the fourth section, we will analyze the post-acquisition combined firm and calculate the value of the cost and growth synergies and, finally, the value of the total synergies.
Lastly, in the fifth and final section we will analyze the transaction structure, price and method of payment and proceed to make our final recommendation in accordance with the previous findings.
1. Literature Review
Mergers and acquisitions have drawn the attention of academicians since the mid-1950s (Chatterjee, 1986). Several questions have been raised and studied in the existing literature, such as the different motivations for mergers, its impact on the returns of the bidding shareholders, the valuation of the target firm and the impact of M&A in the overall economy. In this section we will discuss the relevant literature regarding the motives for mergers and acquisitions, analyze the value creation of mergers for both the acquiring and target shareholders’, summarize the different types of synergies created by mergers, and, finally, present an overview of the valuation techniques used to analyze the target company, focusing on the best practices to estimate the cost of capital.
1.1. Motives for Mergers and Acquisitions
Given the magnitude3 of the M&A industry and its wide universe of bidders and targets, the motives behind takeover deals are broad and diversified. A classic measure to evaluate the success of a merger is to analyze whether it increases the combined value of the target and acquiring firms. A successful tender offer increases the value of the target and acquiring firms by an average of 7.4% (Bradley, Desai, & Kim, 1988).
Using this approach, synergy appears to be the primary motive for takeovers. Mukherjee, Kiymaz, & Baker (2004), surveyed chief financial officers of US firms engaged in M&A deals during 1990-2001 who identified operating synergies as the dominant motivation. Similarly, Berkovitch & Narayanan (1993) analyzed 330 tender offers, and 76.4% presented positive total gains, indicating that synergy was the dominant reason for the takeovers. Moreover, they suggested two additional motives for takeovers: the agency motive and hubris. The former refers to takeovers that occur due to the acquiring management’s self-interest in increasing its welfare at the expense of the acquiring shareholders. This motive is more frequent in conglomerate mergers as they diversify the business risk, and seems to be the major reason for the existence of value-reducing acquisitions. The hubris hypothesis suggests that management’s valuation of the target is incorrect and that mergers happen even when there is no synergy. Trautwein (1990) introduces seven theories of merger motives for takeovers and categorizes them according to their plausibility: valuation, empire-building, and process theories have the highest degree of plausibility; followed by the efficiency and the monopoly theories, for which
the existent evidence is mainly unfavorable; and lastly, the raider and the disturbance theories which are described as “rather implausible, as well as unsupported by evidence”.
Valuation theory suggests mergers are executed by managers who have better information to value the target than the market. The empire building theory, as the agency motive described above, suggests mergers are driven by the manager’s self-interest. In line with this theory, Maquieira, L. Megginson, & Nail (1998) find insignificant net gains for security holders in conglomerate mergers, suggesting that managers of acquiring firms in conglomerate mergers are not acting in their shareholder’s best interest. Process theory argues that mergers and other strategic decisions are seen “not as comprehensively rational choices but as outcomes of
processes governed by one or more of the following influences” (Trautwein, 1990).
Efficiency theory refers to a planned merge with the primary purpose of achieving synergies. The efficiency theory of mergers dominates the field of corporate strategy as well as the research on mergers’ motives. This theory is consistent with several findings, including those of Berkovitch & Narayanan (1993) that identify synergy as the key reason for takeovers. From a monopoly theory perspective, mergers are a way to achieve market power. Chatterjee (1986) refers to the advantages resulting from the increased market power as collusive synergies and points out that they are “created artificially at the expense of the consumer”. Moreover, Devos, Kadapakkam, & Krishnamurthy (2009) argue that increased market power is not economically beneficial as it generates stockholders’ gains at the expense of other stakeholders such as customers and suppliers.
The raider theory refers to mergers that are executed to transfer wealth from the target’s shareholders, which Trautwein (1990) describes as being “illogic”. Also, this theory is inconsistent with evidences provided in much research regarding mergers’ wealth creation, including Maquieira, L. Megginson, & Nail (1998) which document that “target firm
shareholders’ always experience net wealth gains” either in conglomerate or non-conglomerate
mergers. Regarding the disturbance theory, “economic disturbances generate discrepancies in
valuation of the type needed to produce mergers” (Gort, 1969). These disturbances result in
two things, first, they alter individual expectations and second, they increase the variance of valuations because past information becomes less accurate to predict the future.
M&A deals can also be motivated by changes in economic conditions and industry shocks including, among others, the availability of credit in favorable terms, opportunities in emerging markets, consumers’ preferences and government regulations. According to Eccles (1999), an M&A is executed to create a stronger competitive position in the market place by creating a
“better platform for growth”. Bradley, Desai, & Kim (1988) identified exogenous changes in
consumers’ preferences and supply or technological innovations as the primary economic changes motivating tender offers. Mulherin & Boone (2000) studied “whether corporate
restructuring can best be typified as an efficient response to economic shocks”, and concluded
that firms efficiently respond to economic changes by adapting their size through either a merge or a divesture.
The existing literature suggests that M&A transactions create value at the macroeconomic level. Sirower & Sahni (2006) analyze the changes in the market capitalization of both buyers and sellers and report an aggregate value creation of 1% at the announcement of an M&A deal. For Mulherin & Boone (2000), the value creation is 3.5% for acquisitions during the 1990s. They also argument that wealth creation, both in acquisitions and divestures, is directly related to the relative size of the deal. Similarly, results of Chatterjee (1986) indicate that when a large firm merges with a smaller firm, the wealth gain of the target is proportional to the relative size of the bidder to the target and related diversification strategies create more value than unrelated strategies.
Although mergers create value in aggregate terms, the gains for the shareholders of the two firms diverge. Eccles (1999) points out that acquisitions don’t create value for the acquiring shareholders. Similarly, Sirower & Sahni (2006) report negative returns for the acquiring firm one-week after the deal announcement. Shareholders of the target firm appear to be the main beneficiaries of M&A transactions while those on the acquiring side can report negative returns. Researchers attribute this to investors’ skepticism regarding the value of the combined firms and whether synergies will outweigh the premium paid. Government regulations may also play an important role in the repartition of the wealth created in M&A deals. Bradley, Desai, & Kim (1988) analyzed successful tender offers between 1963 and 1984 and concluded that target shareholders captured the majority of the gains from tender offers. They also outlined that the Williams Amendment in 1968 and other government regulations are a zero sum game, which transfer gains from the acquiring shareholders to the target.
1.2. Synergies Overview
Although there are several motives for M&A covered by the existing literature, there is a dominant and more recurrent one: synergies. In fact, most of the literature support the importance of synergy as a primary merger motive (Mukherjee, Kiymaz, & Baker, 2004), (Berkovitch & Narayanan, 1993) and (Bradley, Desai, & Kim, 1988).
The word synergy is derived from the Greek word sunergos, which means, "working together". Damodaran (2005) describes synergies as “the additional value that is generated by combining
two firms, creating opportunities that would not been available to these firms operating independently” and as the “magic ingredient that allows acquirers to pay billions of dollars in premiums in acquisitions”. On average, these premiums paid for target companies average 30%
above market value.
Damodaran (2005) and Devos, Kadapakkam, & Krishnamurthy (2009) outline two types of synergies resulting from an M&A: operating synergies and financial synergies. Operating synergies have an impact on the operations of the combined firm, which can be translated into economies of scale, stronger market power or higher growth potential. Financial synergies come from an increase in debt tax shields, diversification or higher debt capacity.
Devos, Kadapakkam, & Krishnamurthy (2009) documented an average total synergy gain of 10% of the combined equity value of the merging firms. Operating synergies are the most relevant type of synergies representing 8.38% of the equity value of the merged firm. Similarly, Mukherjee, Kiymaz, & Baker (2004) report that 89.9% of the interviewed CFOs appointed operating economies as the main source of synergies. Figure 1 summarizes the sources of synergies according to Damodaran (2005):
Figure 1-Synergies and Value
Goold & Andrew (1998) suggested six types of synergies: shared know-how, coordinated strategies, shared tangible resources, vertical integration, pooled negotiating power and combined business creation. The latter is described as “the creation of new businesses as a
result of the combining know-how from different units”. This type of synergy is particularly
power occurs when the combined firm has more leverage over suppliers and is able to either reduce costs or improve the quality of the purchases. For instance, when the target is significantly smaller than the acquiring, by combining both firms’ purchases the target’s units can gain greater leverage over suppliers. This effect is an operating synergy because it is a consequence of economies of scale (Devos, Kadapakkam, & Krishnamurthy, 2009).
Eccles (1999) documents five types of synergies: cost savings, revenue enhancement, process improvements, financial engineering and tax benefits. In what concerns the value of these synergies, revenues’ enhancements are extremely difficult to predict because they depend on external factors. Given this volatility, some firms don’t include them in the synergy value calculations4. However, they can be able to create significant value, namely when the target has a complementary product and is able to take advantage of the buyer’s extensive distribution channels, which can increase its sales both in current and new markets. Cost savings are easier to estimate and the level of accuracy and certainty is higher. They arise from eliminating duplication, such as jobs or facilities, and from increased economies of scale. Process improvements occur when there is a transfer of the best practices of each firm and core competencies, resulting in both reduced costs and increased revenues.
It is important to analyze the link between the type of M&A and the resulting type of synergies, for instance, costs savings are particularly large when the transaction is between two firms operating in the same industry in the same country (Eccles, 1999). Sirower & Sahni (2006) introduced a matrix to evaluate deals in terms of changes in capabilities and market access. According to the place of the deal in the matrix, it can yield revenue or cost synergies. They state that deals which have overlap but improve capabilities or market access can lead to both revenue and cost synergies, whereas deals that bring non-overlapping capabilities and market access, will result in revenue increases.
Sirower & Sahni (2006) introduced the synergy matching principle to outline that synergies also have a cost. As they explained, “synergies don’t come from free” therefore “it is important
to account for the incremental capital investments or costs that will be required to realize any synergies”.
Although synergies have been proven to create wealth, if they rely on unrealistic assumptions and managers’ euphoria, they can lead to overpriced premiums. There are four bias that can
4 Matthew Slatter, the CEO of Bank of Melbourne, says, “We model this (revenue enhancement), but never factor it into the price.” (Eccles 1999)
affect managers while analyzing a possible merge: the synergy bias – overestimating the benefits and underestimating the costs of synergy; the parenting bias – becoming too involved in the valuation and deal; the skill bias – believing they have the skills to intervene and finally, the upside bias – focusing too much on positive knock-on effects (unforeseen consequences) while overlooking the downsides (Goold & Andrew, 1998).
1.3. Valuation Techniques
Although several valuation techniques are covered by the existing literature, two methods stand out: The Discounted Cash Flows (DCF) and the market multiples approach.
The DCF analysis emerged as the best practice for valuing corporate assets in the 1970s. This is the most used method to value either a public or a private target firm (49.3%) and a considerable number of CFOs use it along with the market multiples approach (33.3%) (Mukherjee, Kiymaz, & Baker, 2004). The DCF approach is also the most used investment-evaluation technique (Robert F., M. Eads, S. Harris, & C. Higgins, 1998) and it performs at least as well as the multiples approach (Kaplan & Ruback, 1995). Mohan, Ainina, Kaufman, & Winger (1991) argued that the DCF represents the maximum price to be paid for an acquisition. Regarding the comparables approach, several ratios can be used to calculate the target’s value, which can be based either on recent similar transactions or in industry peers’ market values. Mohan, Ainina, Kaufman, & Winger (1991) find that managers commonly use the P/E ratio5. In addition to the DCF and market multiples analysis referred above, Sirower & Sahni (2006) suggest a “three-step risk management approach” as a complement to these traditional valuation techniques. The goal is to control the potential overvaluing of synergies. The first step consists of combining all revenues and cost synergies that would be required to pay the premium; the second step is to define boundaries of the likely revenues and costs synergies based on previous transactions, and finally; the third step is an analysis of the sources of those synergies.
In what concerns the methods used in the investment decision-making process, the majority of firms rely on the net present value (81%) and on the internal rate of return (79.8%) (Emery A. & J. Gitman, 1995).
5
Where company value is the product of either current or projected earnings multiplied by a P/E ratio
1.3.1. The Discounted Cash Flow Approach
Using the DCF method requires an estimate of future cash flows and an appropriate discount rate. The analysis is extremely sensitive to the financial projections and cost of capital, therefore 63.1% of the firms perform a sensitivity analysis to account for the impact of changes on these variables (Emery A. & J. Gitman, 1995). Given the large sums of money involved with these variations, 70% of the surveyed CFOs use the results of sensitivity analysis to make their investments decisions (Mohan, Ainina, Kaufman, & Winger, 1991).
1.3.1.1. Cost of Equity
There is much controversy regarding which cost of equity should be used to value the target firm. Emery A. & J. Gitman (1995) surveyed CFOs of the Fortune 500 largest industrial companies and Forbes 200 best small companies and reported that 30% of the respondents use the Capital Asset Pricing Model (CAPM) to calculate the cost of equity (Equation 1). Different studies also identify the CAPM as the preferred model to estimate the cost of equity (Gitman & Vincent, 1982) and (Robert F., M. Eads, S. Harris, & C. Higgins, 1998). Other multi-factor asset pricing models, such as the arbitrage pricing theory, are also used, although by a small minority.
RE = RF + βE (RM – RF)
(1) Where RE is the cost of equity, RF is the risk-free rate, βE is the levered beta and (RM – RF) is
the market risk premium.
Although there is a consensus that the CAPM is the best method to calculate the cost of equity, the criteria for the inputs used varies. Robert F., M. Eads, S. Harris, & C. Higgins (1998) documented the best practices to choose the beta, the risk-free rate and the market risk premium: Betas should be collected from published sources, preferably those using a long interval of equity returns (e.g. 5-year monthly observations); the risk-free rate should have a long-term maturity of ten or more years to “reflect the default-free holding period returns available on
long lived investments”; and finally, for the market risk premium, which is the most
controversial element of the model, most companies use a premium of 6% or lower, despite financial advice to opt for higher numbers. In 2015, most firms in the US used a premium of 5.5% (Fernandez, Ortiz, & Acin, 2015).
1.3.1.2. Cost of Debt
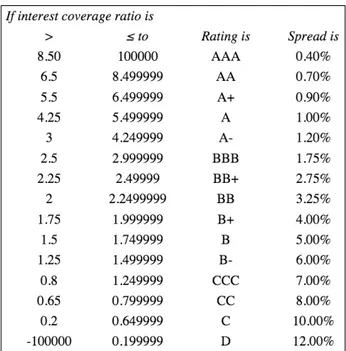
Damodaran (2015) identifies two methods to calculate the cost of debt for traded firms. First, if the firm has traded bonds, the long-term yield to maturity can be used as the pre-tax cost of debt. The second method is to use a risk free rate and add a default spread, which varies with the rating of the firm and its bonds (Figure 2). The spread can be obtained by calculating the interest coverage ratio of the firm (EBIT / Interest Expenses), which gives is a synthetic rating, or by using the actual ratings provided by rating agencies.
Figure 2-Default Spread
(Damodaran, 2015)
1.3.1.3. Cost of Capital
The cost of capital is the most controversial element of the DCF method, therefore it is important to understand the best practices suggested by the existent literature. We can only use the cost of equity as the discount rate when we are using free cash flows to equity, otherwise it can lead to overvaluing the target firm (Mukherjee, Kiymaz, & Baker, 2004). Evidence provided in the studies of Robert F., M. Eads, S. Harris, & C. Higgins (1998) and Mohan, Ainina, Kaufman, & Winger (1991) suggest a lack of sophistication or inability to determine the appropriate target’s cost of capital. The last study found that the majority of the respondent firms using DCF models use their own WACC as the discount rate (55%), 41% used management's judgment, while only 12% used the target firm's cost of capital.
Over the past 30 years, the standard version of DCF is the one using the WACC as the discount rate (Luehrman, 1997). More recently however, an alternative has emerged called Adjusted Present Value (APV). Unlike the WACC, APV “unbundles components of value and analyses
each one separately” (Luehrman, 1997), providing a more accurate valuation of the financial
side effects6.
Where the two methods differ the most is regarding the future level of leverage, therefore, opting for one or the other “depends entirely on the plan chosen to determine future debt
transactions” (Ezzell & Miles, 1983). The APV method assumes that the level of debt in
absolute terms will be initially determined (at period 0) and never revised, whereas the WACC requires an adjustment of the debt value in order to maintain a constant leverage ratio in terms of realized market values. Both approaches can be used to estimate the value of the interest tax shields of a firm into perpetuity (Bradley & Jarrell, 2008).
1.3.2. WACC
The WACC is the dominant discount rate used in DCF analysis (Bierman, 1993). Best practice firms are able to calculate their WACC with an accuracy of no more than or minus 100 to 150 basis points. Although firms should only use the same WACC for investments of comparable risks, only 26% of the surveyed companies adjust the WACC to reflect the risk of different investments (Robert F., M. Eads, S. Harris, & C. Higgins, 1998). Instead, companies do recognize risk differences but they adjust the cash flows and the multiples instead of changing the discount rate.
In order to obtain a correct valuation using the WACC approach, the firm needs to maintain a constant leverage ratio in terms of realized market values (Ezzell & Miles, 1983). The same discount rate can only be used when the level of risk is identical (Robert F., M. Eads, S. Harris, & C. Higgins, 1998) and (Bradley & Jarrell, 2008) so, in order to keep the same level of risk between tax shields and cash flows, debt must remain in constant proportion of the value of the firm.
1.3.3. APV
Although the DCF is considered the best method to value operating assets, using the WACC as the discount rate might be considered “obsolete” and can be replaced by a more flexible
alternative called APV (Luehrman, 1997). Using the APV and assuming a Modigliani-Miller (MM) world7, the value of the firm could be expressed as showed in Equation (2):
VL = VU + TCD
(2) Where VL is the levered market value, VU is the unlevered market value and TCD is the interest
tax shields, assuming a perpetual debt. 1.3.3.1. Discount Rate
Since we are assuming an unlevered firm, the appropriate discount rate is the unlevered cost of equity, which is simply obtained by replacing the beta on Equation (1) by the unlevered beta8
(βu):
𝛽(𝑈) = 𝛽(𝐿)
1 + 𝐷𝐸 × 1 − 𝑡
(3) Where 𝛽 𝐿 is the levered beta, /0 is the market level of debt to equity and 𝑡 is the marginal tax rate.
As for the terminal value in the APV, it should reflect the “earliest point after which we can
regard the assets as perpetuity” (Luehrman, 1997). The APV model assumes that all interest
tax shields should be discounted using the same cost of debt, however, academics don’t agree on their riskiness and therefore on which discount rate to use. A common assumption is that tax shields are equally or more unpredictable than the principal and interests payments (Luehrman, 1997).
1.3.3.2. Limitations
There are two particularly important limitations of using the APV method. Firstly, when computing the interest tax shield, we can overestimate the benefits of debt when income from stocks differs from that of bonds.
Secondly, in 1958 when Modigliani & Miller suggested that “the market value of any firm is
independent of its capital structure”, they assumed no bankruptcy risk, however as Luehrman
(1997) highlights, the possible costs of financial distress associated with high levels of debt
7 A MM world assumes a perfect market (i.e. no agency costs, no information asymmetries, no bankruptcy costs
etc.)
cannot be ignored. In fact, for very high levels of debt, the cost of bankruptcy may be even higher than the tax benefit of debt (Damodaran, 2015).
1.4. Forms of Payment
In cash transactions the buying shareholders bear all the risk, whereas in equity transactions this synergy risk is shared with selling shareholders in proportion to the percentage of the combined company that each will own (Sirower & Sahni, 2006). Travlos (1987) studied 167 acquisitions conducted during 1972-1981 and identified a connection between the form of payment and the type of transaction: mergers are mostly paid with common stock whereas tender offers are more often cash financed.
In stock offers, bidders experience negative returns at the proposal announcement date, whereas in cash deals the returns appear to be normal (Travlos, 1987). A possible justification for this discrepancy of returns is the signaling hypothesis, which posits that financing a transaction using stock implies the negative information that the bidding firm is overvalued. Surprisingly, if the target is a privately held firm, bidders experience a positive abnormal return (Chang, 1998). When the transaction is a takeover, the negative effects are in part offset by the positive effect of the takeover announcement. After the transaction, the acquiring firms continues to outperform their industry peers (Heron & Lie, 2002), however there is no evidence that the method of payment provides information about the firm's future operating performance.
2. Industry Overview
This section includes an overview of the business and financial profile of the two firms analyzed, WhiteWave and PepsiCo, as well as a review of the food and beverage industry, in which they both operate.
2.1. The Food and Beverage Industry
Both WhiteWave and PepsiCo operate in the consumer packaged goods (CPG) industry, more precisely in the food and beverages sector. The global CPG industry is growing at a fast pace and is expected to nearly double in size to $14 trillion by 2025, from $8 trillion in 2014, (McKinsey&Company, 2015). The food and beverage sector is highly competitive with several powerful and widely known players such as Nestlé, General Mills and Mondelēz International.
2.1.1. Industry Environment
The intense competition and high capital requirements of the food and beverage industry are a constraint to growth and a barrier for expanding geographically. Over the past years, several firms in the sector have been focusing in expanding to the BRICs. Today, however, this trend is changing due to the intense competition established in these emerging countries. Firms are increasingly shifting their focus to other regions of the world, such as Africa and non-BRIC Asia and Latin America. By 2025 emerging markets “will account for $30 trillion in consumer
spending, or nearly half of global consumption” (McKinsey&Company, 2015). The substantial
growth of the global middle class will also impact demand in the industry. As stated by the Director of the OECD Development Centre “the size of the global middle class will increase
from 1.8 billion in 2009 to 3.2 billion by 2020 and 4.9 billion by 2030” (Mario Pezzini, 2012).
The most relevant key competitive advantages to succeed in the industry consist of: product innovation; product quality and price; brand recognition and loyalty; product packaging; effectiveness of marketing; and lastly, the ability to identify and satisfy consumers’ tastes and preferences. Therefore, research and development is a key driver in the industry.
The risks that affect the operations of firms in this sector include adverse weather conditions, natural disasters and other unpredictable events that affect raw materials’ production and have a negative impact on costs and operating margins.
2.1.2. Current Trends and Challenges
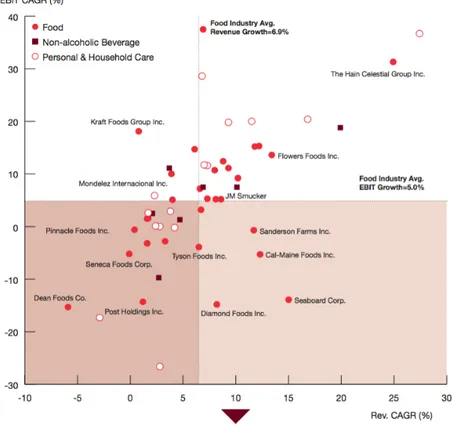
Figure 3 illustrates the current performance of the key players operating in the industry. Overall, revenues in the food industry have grown at 6.9%, while EBIT has grown at 5.0% (≈35% of the industry has declining EBIT) (PwC, 2015).
Figure 3-Performance Overview Within the Food Industry (2010-2013)
(PwC, 2015)
The food industry is highly affected by changes on consumers’ preferences which includes taste, lifestyle and social trends. Consumers are increasingly health conscious and place greater importance on environmental sustainability, mostly in developed countries “but more and more
in emerging markets” (McKinsey&Company, 2015).
There is an increased demand for “healthier, functional and certified food that are guaranteed
to meet a certain level of safety and environmental or corporate social responsibility
(McKinsey&Company, 2015)”. Consumers are more informed about what they buy and are increasingly interested in natural foods (Financial Times, 2013). Consequently, there is an increasing number of government regulations for food production, such as labeling requirements and organic and environmental regulations. This is a relevant characteristic of the sector, since a failure to comply with food safety and environmental laws may disrupt the
supply of products. Moreover, a high number of government regulations increases compliance costs and challenges firms to maintain their profitability margins.
Another trend affecting the food industry is the increasing number of lactose intolerant individuals. In fact, approximately 75% of the adult population loses its ability to digest lactose (U.S. National Library of Medicine, 2012). In South America, Africa and Asia, the prevalence is around 50% and is expected to increase by 100% in some Asian countries (British Journal of Cancer, 2014).
2.1.3. Growth Opportunities
The first growth opportunity relies within the organic food segment. Consumers are shifting their preferences from “gluten, simple carbohydrates and artificial ingredients to protein, fiber,
whole grains and organic products” (General Mills, 2015). As so, several players of the
industry such as The Coca-Cola Co., are facing a decrease in sales because their processed foods and sugary drinks are inconsistent with the current concerns for health and wellness. In order to clean their brand image and win credibility with customers, these large firms are buying smaller natural and organic companies.
By buying such brands these firms are not only investing in improving their customer’s loyalty, but also entering into a fast growing market. U.S. industry sales for “natural and organic foods
have been growing at a double-digit pace over the past three years” (General Mills, 2015) and
non-carbonated drinks are expected to grow at 4-5% as opposed to canned food and carbonated drinks which are expected to grow at less than 1% (McKinsey&Company, 2015). The growth of the organic sector is outpacing the growth of the overall food and beverage industry (WhiteWave, 2014), providing an opportunity for firms to enter this market.
The second major opportunity is in the plant-based food and beverages segment. Although lactose-intolerant individuals can consume small amount of dairy products, they are usually recommended to avoid them (British Journal of Cancer, 2014) and to opt for dairy alternatives, such as plant-based food and beverages. Plant-based beverages are becoming increasingly popular among consumers9, hence, firms have the opportunity to expand into this category, in
particular to regions with high rates of lactose intolerance10 such as in Asia and South America. In addition to beverages, other plant-based categories in the U.S., such as yogurt or ice cream, are expected to be worth $2.7 billion according to WhiteWave’s CEO, Gregg Engles (cf. Appendix 1), representing a substantial opportunity for firms in the industry to explore this still undeveloped segment.
2.1.4. M&A in the Industry
Over the past years, M&A activity in the food and beverage sector has accelerated, “with more
than 200 announced US deals over $50 million in the last five years, totaling about $235 billion” (PwC, 2015). Geographic expansion and economies of scale or learning are amongst
the most frequent motives for takeovers in the industry (cf. Appendix 2).
10 The rates of lactose intolerance vary with the region of the world, Northern Europe has the lowest rate, (5% in
2.2. The WhiteWave Foods Company
2.2.1. Business Profile
As stated in the company’s 2014 annual report, “WhiteWave Foods is a leading consumer
packaged food and beverage company that manufactures, markets, distributes, and sells branded plant-based foods and beverages, coffee creamers and beverages, premium dairy products and organic products throughout North America and Europe”.
The firm’s popular brands in North America are Silk® and So Delicious®, plant-based foods and beverages; International Delight® and LAND O LAKES®, coffee creamers and beverages; Horizon Organic®, premium dairy products; and Earthbound Farm®, organic salads, fruits and vegetables. In Europe, WhiteWave is mostly recognized for Alpro® and Provamel®, brands of plant-based foods and beverages. Recently, WhiteWave formed a joint venture (49% owned) with China Mengniu Dairy Company and sells plant-based beverages in China under the Silk® ZhiPuMoFang brand.
Figure 4-WhiteWave’s Most Popular Brands
With 4,500 employees11, the firm sells products mainly in North America (85% of 2014 sales) and Europe, to grocery stores, mass merchandisers and convenience stores. WhiteWave is extremely dependent on its largest customer, Wal-Mart, which accounted for 44% of the total net sales in 2014. This may affect the profitability of the business since Wal-Mart may seek to use its position to lower pricing and increase promotional programs.
2.2.2. Key Competitive Advantages and Challenges
The company’s main competitive advantage is its ability to quickly identify and meet consumers’ changing needs and preferences. The product categories that distinguish WhiteWave within the industry – plant-based foods and beverages; coffee creamers and beverages; premium dairy products and organic products – are aligned with the consumers’ emerging concerns for health as well as the increase in lactose intolerance. Currently the firm
11 December 2014
is focused on meeting consumers’ “increasing desires for nutritious, flavorful, convenient, and
responsibly-produced products” (WhiteWave, 2014).
WhiteWave operates in a highly competitive industry along with larger firms that have substantial financial and marketing resources. The firm competes with global players of the food industry such as Group Danone, Nestlé S.A. and Kraft Foods Group, as well as with natural and organic food firms like Organic Valley. The largest competitors may be able to introduce innovative products more quickly or to market their products more successfully than WhiteWave. This disadvantage can have a negative impact in the growth rate of certain categories, volume growth and market share.
Overall, WhiteWave’s future growth and profitability will depend on its ability to meet customers’ demand and support the required operating costs and capital expenditures. The firm’s manufacturing plants are operating at high rates of utilization, hence, one challenge facing WhiteWave is to maintain sufficient internal production capacity by expanding the production facilities or by entering into co-packing agreements12.
2.2.3. WhiteWave and Dean Foods
Until its initial public offering in October 2012, the company operated as a segment of Dean Foods, rather than as a stand-alone company. One of the reasons that led Dean Foods to do the IPO of the Silk products and Horizon Organic dairy products was to relieve debts (Financial Times, 2012). The company used the proceeds to reduce its long-term debt by approximately 33%. The market reacted positively to this transaction and the stock increased by approximately 40%, from $12.42 to $14.95 (cf. Appendix 3) at the announcement (August 2012).
Since 2012, the number of customers for WhiteWave’s products has been increasing and the company is struggling to meet the demand, making it a prime takeover target (Business Insider, 2015).
2.2.4. Financial Profile
Currently, WhiteWave operates independently with a market capitalization of $7,259 million13 and a stock price of $41.6. The firm has an EBITDA multiple14 of 23, which is 28% higher than the average multiple of its peer group15.
In terms of size, in 2014 the firm generated sales over $3 billion and an EBITDA of $388 million. Since 2013, the volume of sales has been increasing by an average annual rate of 19.3%, significantly outperforming the growth performance of its industry’s peers (5.5%). WhiteWave has a level of leverage in line with the industry average of 20% net debt-to-enterprise value (cf. Appendix 4). In 2016, net debt is expected to be 3x the value of EBITDA, slightly higher than the peer group level (≈ 2.5x).
2.2.4.1. Growth Performance
As previously referred, the firm has been achieving significant growth since 2012 and is expected to continue to outperform its peers over the next periods (Table 1). The firm’s extraordinary growth over the last years is a combination of both organic growth and acquisitions. WhiteWave has been acquiring several organic food brands in order to establish a strong presence into the fast growing segments in which it operates.
Table 1-Historical and Expected Growth
2.2.4.2. Profitability Performance
Regarding WhiteWave’s profitability, the firm’s ability to convert sales into profit has been slightly bellow the average level of the industry (Table 2). One reason might be the fact that WhiteWave competes with producers of non-organic products that have lower production costs
13 Market values were taken from Thomson Reuters (05/11/15) 14 Trailing twelve months (TTM)
15 The group consists of General Mills Inc., Danone S.A., Kellogg Co., Campbell Soup Co., Hain Celestial
and therefore can achieve higher margins. Regarding the historic price-to-earnings ratio, the firm is above the industry’s peers which reflects investors’ bullish expectations of future earnings.
Table 2-Profitability Ratios
2.2.4.3. Management Effectiveness
On what concerns the ability to generate returns for its investors, the firm is underperforming comparing with its peers. In fact, Table 3 shows that WhiteWave has a return on equity below the peer average, suggesting that it could improve its ability to effectively manage the capital entrusted by shareholders and generate more income for them.
Table 3-Efficiency Ratios
2.2.4.4. Stock Performance
The firm’s stock price increased 11% over the last year and in 2015, ranged between $32.3716
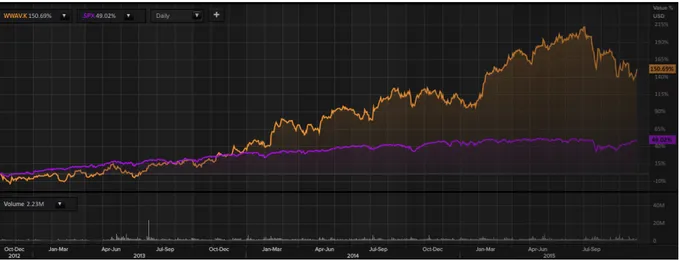
and $52.5317. In 2013, for the first time since the IPO, WhiteWave outperformed the S&P index (cf. Appendix 5), since then the stock price returns have been consistently higher than those of the S&P 500 index (Figure 5). In fact, since October 2012 WhiteWave’s stock value increased by 150.69% outperforming the S&P 500 increase of 49.02%.
16 52-week low (14/01/15)
Figure 5-WhiteWave’s Daily Stock Price Evolution Since the IPO (Oct.2012- Nov.2015)
In orange: WhiteWave, in purple: S&P500
2.2.4.5. Ownership and Governance Structure
Regarding WhiteWave’s ownership structure, 98.19% of the outstanding shares are free float and the remaining 1.81% are owed by ten strategic entities. Institutional investors, owe the majority of the shares outstanding (79.42%) and are either investment managers (≈75%) or brokerage firms (≈5%), mostly from the US. More than one third of all outstanding shares are detained by only 10 investors.
Regarding WhiteWave’s governance, Table 4 summarizes its structure and key persons.
Table 4- Governance Structure
Name
Gregg L. Engles Chairman of the Board of Directors and Chief Executive Officer Kelly J. Haecker Executive Vice President and Chief Financial Officer
Bernard P.J. Deryckere Executive Vice President and Chief Executive Officer, Europe Foods & Beverages Blaine E. McPeak Executive Vice President and President, Americas Foods & Beverages
Kevin C. Yost Executive Vice President and President, Americas Fresh Foods Edward F. Fugger Executive Vice President, Strategy and Corporate Development Roger E. Theodoredis Executive Vice President, General Counsel
Thomas N. Zanetich Executive Vice President, Human Resources
WhiteWave, 2015
2.3. PepsiCo
2.3.1. Business Profile
PepsiCo Inc. is a global food and beverage company with 271,000 employees18. The Company
manufactures, markets, distributes and sells a variety of beverages, foods and snacks, in every continent, over 200 countries. The company owns 22 billion-dollar iconic brands, including among others, Pepsi, Tropicana, Schweppes, 7UP, Gatorade, Frito-Lay, Fritos, Quaker and Lay’s (cf. Appendix 6).
Figure 6-PepsiCo’s Most Iconic Brands
The Company operates through six segments: Frito-Lay North America, Quaker Foods North America, Latin America Foods, PepsiCo Americas Beverages, PepsiCo Europe (Europe) and PepsiCo Asia, Middle East and Africa.
PepsiCo’s main competitors include The Coca-Cola Co., Monster Beverage Co., Kellogg Co., Nestlé S.A., Red Bull GmbH and Snyder’s-Lance, Inc.
2.3.2. Key Competitive Advantages and Challenges
Indra K. Nooyi, PepsiCo’s Chairman of the Board and CEO, highlights adaptability as a core attribute that contributes to PepsiCo’s strong outperformance. In the 2014 annual report, she explained that PepsiCo “anticipated major shifts in the consumer landscape and business
environment and met them head-on by preemptively retooling the company for advantage and growth.” In fact, PepsiCo has been focusing on beverages with less sugar and more natural
ingredients, such as the Tropicana fruit juices, in order to respond to consumers’ concerns about calories and healthier products (Reuters, 2015). The company should act quickly and pursue with its focus on organic and natural food, in order to distant itself from the image of a producer of unhealthy, salty, and sugary food and drinks.
18 December, 2014
2.3.3. Financial Profile
PepsiCo has a market capitalization of $146,588 million19 and a stock price of $100.7. The firm is one of the biggest players in the food and beverage industry with total annual revenues of $66,683 million (in 2014). In 2015, the firm’s EBITDA multiple (TTM) was 15.8% which is 18% lower than the peer group20 average (19.4).
PepsiCo is less leveraged than the target firm and then the peer group average. Its net debt represents 12.4% of its enterprise value and 1.7x of its expected 2016 EBITDA (cf. Appendix 7).
2.3.3.1. Growth Performance
Unlike WhiteWave, PepsiCo’s sales have been declining over the past years, mostly due to consumers’ shift towards non-carbonated drinks. In fact, total revenues of the Americas beverages segment declined 4% from 2013 to 2014.
Table 5 clearly shows the decline in EBITDA suffered by PepsiCo in the last periods. Although revenues are expected to increase by 1.6% in the next periods, the firm’s growth will still remain below its peers.
Table 5-Historical and Expected Growth
2.3.3.2. Profitability Performance
Looking at the profitability margins (Table 6), we can observe that PepsiCo is underperforming its peers, particularly regarding the net profit margin, but is significantly above WhiteWave’s margins. However, the historic price-to-earnings ratio is about half the target firm’s ratio
19 Market values were taken from Thomson Reuters (05/11/15)
20 The peer group of PepsiCo consists of Coca-Cola Co., Dr. Pepper Snapple Group Inc., Nestlé S.A. and
Kellogg Co. Growth (%) Total Revenue, 3 Yr CAGR EBITDA, 3 Yr CAGR Revenue Growth (Next Yr/This Yr) PepsiCo 0,1 -0,2 1,6 Variation -1,7 -2,7 -0,7 Peer mean 1,8 2,5 2,3 Thomson Reuters, 26/10/2015
(44.42), which reflects the differences in investors’ expectations regarding future earnings growth between the two firms.
Table 6-Profitability Ratios
2.3.3.3. Management Effectiveness
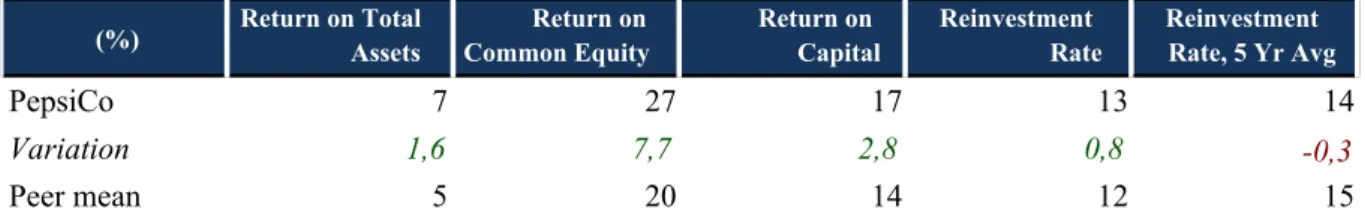
Despite the declining trend in revenues and profitability, PepsiCo is efficiently managing its shareholders’ capital, clearly outperforming its peers (Table 7).
Table 7-Efficiency Ratios
2.3.3.4. Stock Performance
The firm’s stock price increased 8.39% over the last year, less than WhiteWave’s stock price growth of 11% over the same period. In 2015, the price reached a maximum value of $76.4821and a minimum of $103.4422. Unlike WhiteWave’s stock, since 2012, PepsiCo has underperformed the S&P 500 index (cf. Appendix 5 & Figure 7).
21 52-week low (14/01/15) 22 52-week high (05/08/15) Profitability ratios EBITDA Margin (%) Operating Profit Margin (%)
Income Aft Tax Margin (%)
Historic P/E Net Profit Margin (%)
PepsiCo Inc 19 14 10 23 10
Variation -1,3 -0,4 0,1 -2,3 -2,0
Peer mean 21 15 10 25 12
Thomson Reuters, 26/10/2015
(%) Return on Total Assets Common EquityReturn on Return on Capital Reinvestment Rate Reinvestment Rate, 5 Yr Avg
PepsiCo 7 27 17 13 14
Variation 1,6 7,7 2,8 0,8 -0,3
Peer mean 5 20 14 12 15
Figure 7-Pepsico’s Daily Stock Price Evolution (Oct.2012-Nov.2015)
In orange: PepsiCo, in purple: S&P500
2.3.3.5. Ownership and Governance Structure
PepsiCo’s ownership structure is quite similar to that of WhiteWave. Institutional investors, owe the majority of the shares outstanding (72.5%) and are either investment managers (≈67.8%) or brokerage firms (≈3.7%), mostly from the US, whereas individual investors owe only 0.22%. Investors’ ownership is not as concentrated as in WhiteWave, since 10 investors owe 23% of all the outstanding shares (vs. ≈33%).
On what concerns PepsciCo’s governance, Table 8 summarizes its structure and key persons.
Table 8- Governance Structure
Name
Albert P. Carey Chief Executive Officer, PepsiCo Americas Beverages Sanjeev Chadha Chief Executive Officer, PepsiCo Asia, Middle East and Africa Marie T. Gallagher Senior Vice President and Controller, PepsiCo
Thomas Greco Chief Executive Officer, Frito-Lay North America
Enderson Guimaraes Executive Vice President, Global Categories and Operations Hugh F. Johnston Executive Vice President and Chief Financial Officer, PepsiCo
Dr. Mehmood Khan Vice Chairman, PepsiCo; Executive Vice President, PepsiCo Chief Scientific Officer, Global R&D Ramon Laguarta Chief Executive Officer, PepsiCo Europe
Laxman Narasimhan Chief Executive Officer, PepsiCo Latin America Foods
Indra K. Nooyi Chairman of the Board of Directors and Chief Executive Officer, PepsiCo
Cynthia M. Trudell Executive Vice President, Human Resources and Chief Human Resources Officer, PepsiCo Tony West Executive Vice President, Government Affairs, General Counsel and Corporate Secretary, PepsiCo
PepsiCo, 2015 Position
2.4. Conclusions and Deal Rationale
By analyzing the growth performance of both firms, we can observe a clear dispersion in terms of historical and expected growth levels. PepsiCo’s sales have been declining over the past years as a result of an increasing appeal for the products that WhiteWave commercializes i.e. organic and healthy food and beverages. In fact, WhiteWave is a market leader both in the US and in Europe, with its brands of plant-based food and drinks. Considering the current trends in consumers’ preferences presented earlier, it is clear that the organic segment represents an opportunity for large producers of processed food and drinks such as PepsiCo, to improve their results not only because it is a fast growing segment but also because it represents an opportunity to clear their image and regain consumers’ loyalty.
Regarding the profitability margins and the ability to effectively manage assets and provide returns to shareholders, PepsiCo clearly outperforms WhiteWave. This comes as a result of decades of experience within the industry and of long-term relationships with third parties. PepsiCo has the size and the market power to benefit from economies of scale and generate higher operating margins, whereas WhiteWave is a market leader in the fastest growing segment within the industry.
A combined firm would therefore benefit from the established presence of WhiteWave in the growing segments of the industry and the scale and expertize of PepsiCo. Together, they would combine the target’s skills in understanding the market and developing brands with high consumers’ loyalty, with the acquirer’s internal capacity of production, financial resources to invest in research & development and the scale to improve operating margins.
3. Independent Firms’ Valuation
As covered in the literature review, there are two widely used methods to value a firm: the DCF analysis, which is the most used approach, and the multiples method. In this section we will analyze the value of the target and the acquirer independently, using three valuation methods: the comparables approach, the DCF-WACC and the APV.
For the DCF method, we will use a projection period of 5 years, since both firms operate in a relatively predictable and established industry that is not highly dependent on external variables, unlike natural resources or utilities firms. Moreover, they are not in an early stage of development since, although WhiteWave has been a stand-alone company for only two years, the firm operates since 1977.
3.1. Target Valuation (WhiteWave)
WhiteWave has been an independent public company since October 2012, therefore historical financial information prior to 2012 may not be representative of what the firm “would have
achieved as a stand-alone public (…) and may not be a reliable indicator of future results”
(WhiteWave 2015). In fact, data prior to 2013 does not consider the changes, both in terms of capital, cost and tax structure that occurred after the spin-off. Given the higher size of Dean Foods23 it is expected that WhiteWave has also suffered changes in its operating performance due to a deterioration of its purchasing power. After 2012, the firm might have been unable to negotiate with third parties in such favorable terms as when it was a segment of Dean Foods. For these reasons, we will only consider historical data of 2013 and 2014 to support our financial projections of WhiteWave.
3.1.1. Comparable Companies’ Analysis 3.1.1.1. Peer Group
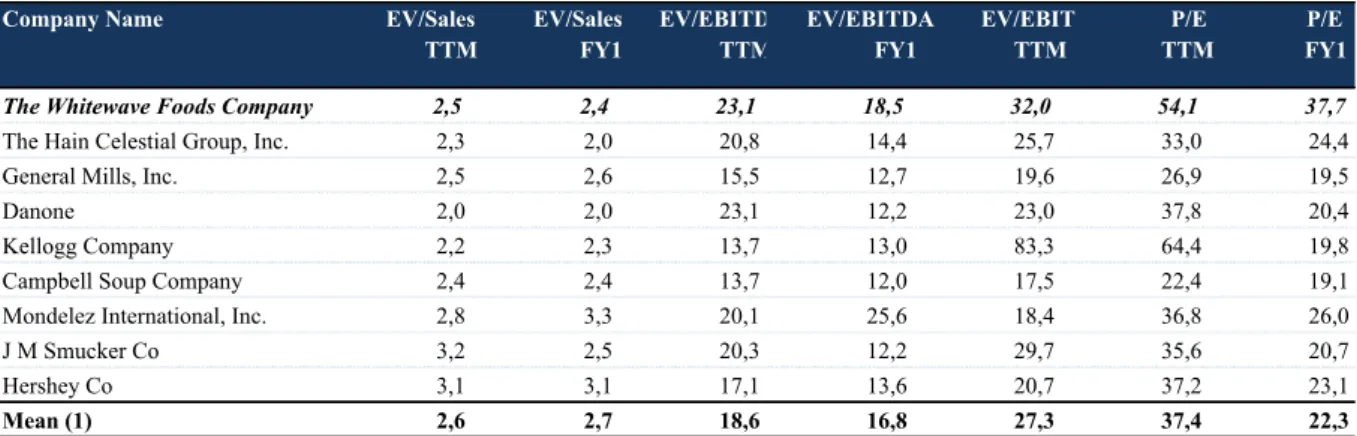
We analyzed WhiteWave’s main competitors and similar firms operating in the same industry and then filtered the most similar in terms of geographic area, size, capital structure and product line (cf. Appendix 4). We obtained the peer groupand respective multiples represented in Table 9.
Table 9- Peer Group Multiples
3.1.1.2. Multiples and Firm Value
Using the average of the peer’s multiples and WhiteWave’s financial data (cf. Appendix 8) the firm value is between $6,754 and $11,496 million.
Table 10-Multiples' Valuation
We will focus on the EBITDA FY1 multiple since it is an important measure of profitability and it can be used as a proxy for operating cash flow. Moreover, the EBITDA multiple is useful to compare companies in the same sector regardless of their capital structure, depreciation level and tax expenditures. By performing a sensitivity analysis to the enterprise value using the EBITDA FY1 multiple (cf. Appendix 9), we obtained a firm value between $7,801 and $9,482 million.
3.1.2. Financial Projections
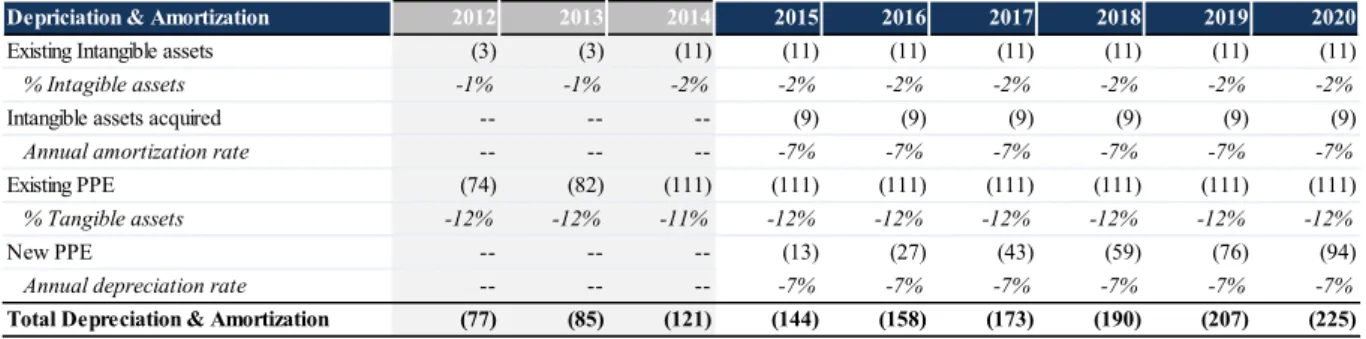
Appendices 10, 11 and 12 present the complete forecasts of the income statement, balance sheet and cash flow statement for the target firm.
Company Name EV/Sales
TTM EV/Sales FY1 EV/EBITDA TTM EV/EBITDA FY1 EV/EBIT TTM P/E TTM P/E FY1
The Whitewave Foods Company 2,5 2,4 23,1 18,5 32,0 54,1 37,7
The Hain Celestial Group, Inc. 2,3 2,0 20,8 14,4 25,7 33,0 24,4
General Mills, Inc. 2,5 2,6 15,5 12,7 19,6 26,9 19,5
Danone 2,0 2,0 23,1 12,2 23,0 37,8 20,4
Kellogg Company 2,2 2,3 13,7 13,0 83,3 64,4 19,8
Campbell Soup Company 2,4 2,4 13,7 12,0 17,5 22,4 19,1
Mondelez International, Inc. 2,8 3,3 20,1 25,6 18,4 36,8 26,0
J M Smucker Co 3,2 2,5 20,3 12,2 29,7 35,6 20,7
Hershey Co 3,1 3,1 17,1 13,6 20,7 37,2 23,1
Mean (1) 2,6 2,7 18,6 16,8 27,3 37,4 22,3
(1) Weighted average by the market capitalization
EV/Sales TTM EV/Sales FY1 EV/EBITDA TTM EV/EBITDA FY1 EV/EBIT TTM P/E TTM Equity Value 7 249 9 914 5 646 7 019 5 698 5 172 Enterprise Value 8 831 11 496 7 228 8 601 7 280 6 754 USD Millions
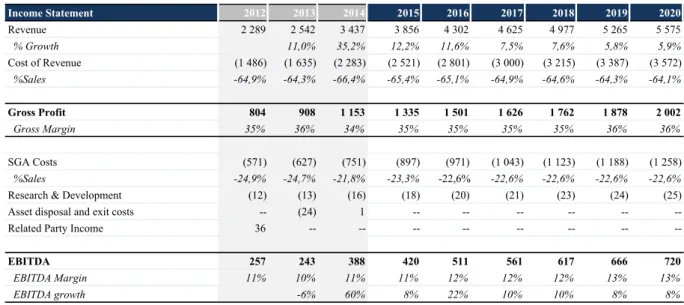
3.1.2.1. Revenues
As covered in the industry review, the segments in which WhiteWave operates – organic and plant-based food and beverages – are growing at an extremely fast pace, as a result of an increase in the demand.
In 2013, revenues increased by 11% and in 2014, the firm more than tripled its annual growth rate to 35%. This extraordinary expansion was a result of both organic growth (≈11%24) and of two business acquisitions: So Delicious and Earthbound, for approximately $22.7 and $573 million respectively, both in cash. These acquisitions increased revenues by $596 million, in 2014.
In 2015, the acquisition trend continued and the firm acquired EIEIO, Inc. and Wallaby Yogurt
Company, Inc., for approximately $40.2 and $125 million, respectively, both in cash using
borrowings under the existing credit facility. On June 9, 2015 the firm announced its plans to acquire Sequel Naturals Ltd, for around $550 million in cash, in order to expand its fast-growing segment of plant-based foods and beverages.
The 2015 acquisitions, in particular the new brand Vega25, are expected to generate annual
revenues of approximately $130 million26. Given that the acquisitions were made throughout
the period of 2015, we considered that it would take two periods to incorporate the full amount of additional revenues, which is 3.8% of the 2014 revenues. Therefore in 2015, we assumed that WhiteWave’s revenues would have an organic growth of 10% plus an additional growth of 2.2%27 resulting from the acquisition:
𝑔 2015 = 10% + 3.8% × (7
12)
(4) For the period of 2016, the remaining additional revenues will be incorporated and we considered the same organic growth rate:
𝑔 2015 = 10% + 3.8% × (5
12)
(5)
24 Organic Growth (%)=Total annual growth (35%)-Acquisition growth (24%) 25 Vega is the main brand of Sequel Naturals Ltd
26 Vega had annual sales of $100 million in 2014 and presented a 30% annual growth. We assumed this growth
rate would continue over the next two periods
Since we didn’t consider any future acquisitions, for the periods of 2017 and 2018 we used analysts’ estimates28 (Table 11). Finally, for the last two periods, we considered that the firm would be closer to a steady state, hence, we computed an annual growth rate (equation 6) lower than in the previous periods (cf. Appendix8).
𝑔 2019/20 = 𝐴𝑛𝑛𝑢𝑎𝑙 𝐺𝐷𝑃 + 𝜋 + 𝑅𝑂𝐼𝐶 × 𝑅𝑒𝑖𝑛𝑣𝑒𝑠𝑡𝑚𝑒𝑛𝑡 𝑅𝑎𝑡𝑒
(6) 3.1.2.2. EBITDA
The cost of goods sold (COGS) represented around 64% of sales in 2014 and increased to 66% in 2015 due to the impact of acquisitions. In 2015, we assumed that the COGS level will be the average of the past two periods, since we didn’t expect any relevant changes in the negotiation power with third parties or significant price variations of raw materials. For the subsequent periods, we considered that the firm will be able to reduce its COGS level and improve the gross margin by 0.4% yearly until 2020 (Table 11).
Regarding the Selling, General and Administrative (SGA) expenses, in 2015 there will be an increase of $13.2 million due to higher employee related costs required to accommodate the business expansion and the employee long-term incentive compensation; and $17.4 million related to higher marketing and distribution expenditures (WhiteWave, 2015). Also, in the period of 2015, SGA expenses will include extraordinary transaction-related costs29. We computed the total SGA of 2015 as follows:
𝑆𝐺𝐴 2015 = 𝑆𝐺𝐴 2014
𝑅𝑒𝑣𝑒𝑛𝑢𝑒𝑠 2014 ×𝑅𝑒𝑣𝑒𝑛𝑢𝑒𝑠 2015 + 𝑇𝑟𝑎𝑛𝑠𝑎𝑐𝑡𝑖𝑜𝑛 𝑐𝑜𝑠𝑡 + ∆ 𝐸𝑚𝑝𝑙𝑜𝑦𝑒𝑒 + ∆ 𝑀𝑎𝑟𝑘𝑒𝑡𝑖𝑛𝑔 𝐶𝑜𝑠𝑡𝑠
(7) For the subsequent years, the level of SGA costs will be the average of the levels in 2014 and 2015.
28 Thomson Reuters (22/12/15)
29 In 2015, there were extraordinary expenses of $2.7 million associated with the acquisitions of Magicow and