Microwave Absorbing Properties of NiFe
2O
4Nanosheets Synthesized Via a Simple
Surfactant-Assisted Solution Route
Chengyun Zhaoa,b, Wei Huanga, Xianguo Liua,b*, Siu Wing Orb,c, Caiyun Cuia,b
Received: September 29, 2015; Revised: June 6, 2016; Accepted: August 11, 2016
NiFe2O4 nanosheets have been synthesized via a simple surfactant-assisted solution route, which
are conirmed by X-ray powder difraction, scanning electron microscopy and transmission electron
microscopy. The NiFe2O4 sample exhibits the sheet-like structure, with width varying from 200 to 800 nm and thickness ranging from 20 to 60 nm. The electromagnetic properties of NiFe2O4
nanosheets-parain composites have been deeply investigated. The multiple dielectric relaxation loss in NiFe2O4 nanosheets is attributed to the size distribution and morphology of the NiFe2O4 nanosheets. The magnetic loss in the present system is caused mainly by the natural resonance. An absorber with a
thickness of 4.3 mm exhibits an optimal relection loss (RL) value of -47.1 dB at 7.67 GHz. RL values exceeding -20 dB in the 2.68-17.96 GHz range are obtained by choosing an appropriate absorption-layer thickness between 1.9 and 10 mm. Not only the RL peak frequency but also the number of the peaks can be well explained by the quarter-wavelength cancellation model.
Keywords: Nanosheets, Ferrites, Transmission electron microscopy, Microwave absorbing materials
* e-mail: [email protected]
1. Introduction
With the rapid development of microwave shielding
technology in solving the electromagnetic (EM) interference pollution problem, huge interests have been focused on EM shielding and absorbing materials. The EM shielding materials cannot eliminate EM wave radically. Therefore, the microwave absorbing materials (MAMs) with the capability of absorbing and attenuating EM energy have become the focus of attention1-3.
MAMs are generally classiied into three types: the resistive
loss type, the dielectric loss type and magnetic loss type4. Single
loss type MAMs limits their application in GHz frequencies due to their intrinsic disadvantages. Among the MAMs, ferrite
with the electric and magnetic loss as advantage factor, has been most studied in experiment and applied in both military
and civil ields for its large saturation magnetization, superior
antioxidation and corrosion resistance, and easy preparation5.
However, their fatal disadvantages restrict their widespread
applications. For example, they have relatively large density
(e.g. the density of NiFe2O4 is about 5 g/cm
3). Compared to
their bulk counterparts, the scientiic interest on nano-sized
ferrite is on the rising, due to their interesting chemistry and
physical properties from the size efect and the low density6.
Spinel nanoferrites (MFe2O4: M=Fe, Co, Ni, Mn, Zn, etc) have recently attracted a great deal of attention, due to the broad
practical applications in several important ields such as magnetic refrigeration, ferroluids making, magnetic resonance imaging and
high density data storage7. Among them, nickel ferrite (NiFe2O4) is one of the most important spinel ferrites. It is particularly attractive to researchers due to its high magneto crystalline anisotropy,
high saturation magnetization and unique magnetic structure8.
To date, diferent shaped NiFe2O4 nanostructures such as iber, sheet, ribbon, and rod have been synthesized using organic sol-gel technology, porous anodic aluminum oxide templates, mechano chemical method, microemulsion method, etc9-13.
Snoek pointed that the product of the initial permeability
and the resonance frequency was proportional to the saturation magnetization: (μS-1)fr=4γMS/3
6,14. Because of the precession
of magnetization under uniaxial anisotropy iled, both the
extent of such precession and the loss of energy are small. In order to solve this problem, planar anisotropy picture has been proposed6,14,15, which bases on the uniaxial anisotropy. According to the planar anisotropy picture, the amplitude of precession is relatively bigger, which is ascribed to the correction of Snoek’s constant with the increase of the
ratio (R H Hi/ zW). Larger Hθwith smaller Hϕ can get higher permeability and higher resonance frequency, where Hθ
is the out-of-plane anisotropic ield and Hϕ is the in-plane
anisotropy ield14.
The planar anisotropy ferromagnetic particles have been attracting considerable interest in experiment6. Herein we report an alternative new wet chemical route to NiFe2O4 nanosheets in large scale via a simple surfactant-assisted solution route. The NiFe2O4 nanosheets are believed to exhibit good absorbing properties
and potential applications in the microwave absorption ields.
a School of Materials Science and Engineering, Anhui University of Technology, Maanshan 243032, PR China.
b Department of Electrical Engineering, The Hong Kong Polytechnic University, Hong Kong
c Hong Kong Branch of National Rail Transit Electriication and Automation Engineering Technology
2. Experimental Procedure
2.1 Sample Preparation
All chemicals used were of analytical grade and
used as received without further puriication. The typical
procedure for the as-prepared products was as follows:
Under air atmosphere, 8 ml of polyglycol (mw≈400), 0.72
g of FeSO4·7H2O, 0.175g of NiCl2·6H2O, and 1 mL of
cyclohexane were in order dissolved in 50 mL of water.
After being under ultrasonic radiation for 80 min at room
temperature, the above mixture was heated to 70 oC and a
solution composed of 20 mL of NH2-NH2H2O (85 wt%)
and 0.4 g of NaOH was added. After a reaction for 30 min, the inal products were separated by centrifugation, washed ive times with water, and dried in vacuum at 60 oC for 5 h.
2.2 Material Characterization
The phase of the as-synthesized products was characterized
using X-ray difraction (Brucker D8 Advance difractometer) with Cu-Kα radiation (λ = 1.5406 Å). Scanning electron
microscopy was performed using JEOL-6300 F SEM at an
acceleration voltage of 20 kV. The morphology and size of the products were examined by transmission electron microscopy
(JEOL JEM-2100F) at an acceleration voltage of 200 kV.
The NiFe2O4 nanosheets-parain composite was prepared by uniformly mixing NiFe2O4 nanosheets with parain, as described in detail elsewhere, by pressing them into cylinder-shaped compacts16. Then the compact was cut into toroidal
shape with 7.00 mm outer diameter and 3.04 mm inner diameter. The EM parameters were measured for NiFe2O4
nanosheets-parain composite containing 40 wt% NiFe2O4 nanosheets, using an Agilent N5244A vector network analyzer.
Coaxial method was used to determine the EM parameters of the toroidal samples in a frequency range of 2-18 GHz with a transverse EM mode. The vector network analyzer was calibrated for the full two-port measurement of relection
and transmission at each port. The complex permittivity and complex permeability were calculated from S-parameters tested by the vector network analyzer, using the simulation
program of Relection/Transmission Nicolson-Ross model on the 85071E Materials Measurement Software16.
3. Results and Discussion
3.1. The phase structure and the morphologies of
NiFe
2O
4nanosheets
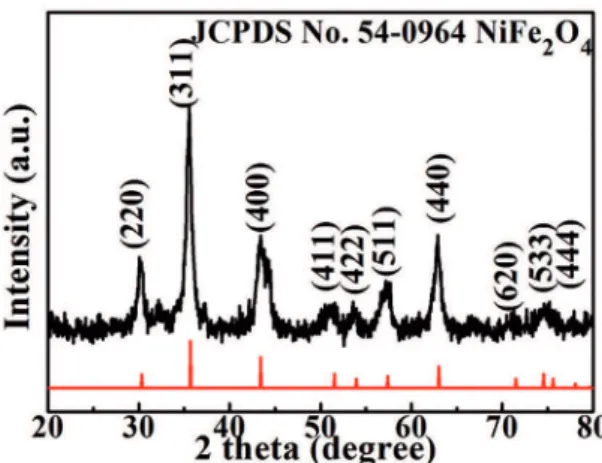
Figure 1 shows the X-ray difraction (XRD) pattern
of the as-synthesized NiFe2O4 powders. The powders are considered to be single-phase spinel structure as no extra peaks and no unreacted constituents are observed. These
Figure 1: XRD pattern of the as-synthesized NiFe2O4 powders and the corresponding JCPDS card igure.
peaks are indexed to the cubic NiFe2O4 phase according to
the standard JCPDS (Card No. 54-0964). The nano-sized
nature of the ferrite leads to broadening of the powder
XRD peaks. The crystallite size of NiFe2O4 particles were
calculated to be 9.4 nm by using the relection peak of (311) and Debye-Scherrer’s relation.
The morphology of the NiFe2O4 powder is analyzed
by scanning electron microscopy (SEM) and the image is
shown in Figure 2a. Obviously, the powder is composed of nanosheets, with width varying from 200 to 800 nm and thickness ranging from 20 to 60 nm. In Figure 2b, the
transmission electron microscopy (TEM) image of the NiFe2O4
powder further conirms the result of SEM image in Figure 2a. A typical High resolution TEM (HRTEM) image of a
nanosheet, as shown in inset of Figure 2b, clearly indicates the d-spacing of 0.481 nm corresponds to the lattice fringe {111} of NiFe2O4. The NiFe2O4 powders are identiied to be NiFe2O4 nanosheets.
3.2. Electromagnetic parameters and absorbing
performance
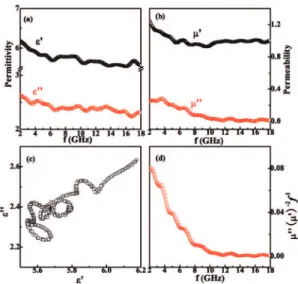
Figure 3a and Figure 3b show the complex permittivity
(εr) and complex permeability (μr) versus frequency for
the parain-based composites containing 40 wt% NiFe2O4
nanosheets dispersed in a parain matrix. In addition, the εr and μr of the parain-based composites are fundamental
physical quantities in determining the microwave absorbing
properties17,18. Figure 3a shows the frequency dependencies
of the real part (ε’) and the imaginary part (ε’’) of the εr.
Both ε’ and ε’’ display a similar tendency of decreasing
with the frequency increasing from 2 to 18 GHz which is
due to increased lagging behind of the dipole-polarization
response with respect to the electric-ield change at higher frequencies17. It is noteworthy that there are multi-nonlinear
Figure 2: (a) SEM and (b) TEM images of NiFe2O4 nanosheets. The inset of Fig.2 (b) shows the HRTEM image of NiFe2O4 nanosheets.
Figure 3: (a) Complex permittivity and (b) permeability, (c)
Cole-Cole semicircles and (d) values of n n’’ ’
Q V
-2f-1as a function of frequency for the composite with 40 wt% NiFe2O4 nanosheets.
the size distribution and the irregular shape of the NiFe2O4 nanosheets. In addition, the higher-order multipoles of NiFe2O4 nanosheets and the interaction of inter-nanostructure also introduced multi-resonance peaks16,19. From Figure 3b, it
can be seen that the real part (μ’) of μr decreases from 1.24
to 1.00 with frequency increasing. The imaginary part (μ’’) has a resonance peak at 3.67 GHz, and the large resonance band is observed in the range of 2-10 GHz. The resonance frequency is dependent on the particle’s radius, lattice defects
and interior stress resulting from the core-shell structure,
which can bring a great increase in the efective anisotropy ield and further lead to resonance frequency appearing at a diferent frequency4. The large resonance band may be
interpreted as a consequence of size and morphology of the
NiFe2O4 nanosheets. Owing to the fact that their length and width is larger than a magnetic wall, NiFe2O4 nanosheets are made up of several magnetic domains, and the large resonance
band may be interpreted as a consequence of their magnetic polydomain coniguration. The frequency band broadening is
also related to the morphology of the nanostructure because
of the efect of the demagnetization ields which are related
to the shapes of NiFe2O4 nanosheets17.
According to the Debye relaxation theory, for most
dynamic processes of dielectric relaxation loss, ε’ and ε’’
follow the equation of the Cole semicircle. The Cole-Cole semicircles between ε’ and ε’’ for the present system are displayed in Figure 3c.The multi-semicircles are clearly observed in the present system. The multi-semicircles indicate that the multiple dielectric relaxation loss, which is attributed to the size distribution and morphology of the NiFe2O4 nanosheets. As a typical magnetic material, the magnetic loss of NiFe2O4 nanosheets is mostly associated with magnetic hysteresis, domain wall resonance, eddy current loss, natural resonance, and exchange resonance for particles smaller than 100 nm17. Magnetic hysteresis stemming from irreversible magnetization occurs only in a highly applied
ield, whereas domain wall resonance derived from multi-domain materials occurs only in the less than GHz frequency range. Exchange resonance should be excluded in the present
system, due to the fact that the size of NiFe2O4 nanosheets is larger than 100 nm. If the magnetic loss only stems from the eddy current loss, then the values of n n’’Q V’-2f-1
should
be constant when the frequency is changed. We can call this the skin-efect criterion. As shown in Figure 3d, the values of
’’ ’ 2f1
n nQ V-
of the NiFe2O4 nanosheets decrease remarkably
with increasing frequency. Therefore, the magnetic loss in the
present system is caused mainly by the natural resonance20.
The relection loss (RL) of the microwave absorbing
material backed on a conductor can be calculated using the
εr and μr at a given frequency and thickness according to
the transmit-line theory:
/
tanh
/
( )
Z
in=
Z
0Q
n f
r rV
Fj
R2
r
fd c
Wn f
r rI2
|
/
| ( )
lg
RL
=
20
Q
Z
in-
Z
0V
Q
Z
in+
Z
0V
1
Where Z0 is the impedance of free space, and Zin is the
input characteristic impedance, which can be express as:
Where c is the velocity of light and d is the thickness of an absorber.
The RL values of the NiFe2O4 nanosheets are derived
according to Eqs. (1) and (2). The three dimensional (3D) dependence of the RL of the NiFe2O4 nanosheets-parain
nanocomposites with varying layer thickness (0.6-10 mm) on the frequency in the 2-18 GHz range is presented in Figure 4a. The peak of RL is found to sensitively depend on the
thickness. With increasing thickness of the absorption layer,
the peak frequency of RL of the NiFe2O4 nanosheets shifts
to lower frequency, and more than one peak of RL appears when the thickness is thicker than a critical value (Figure 4a).
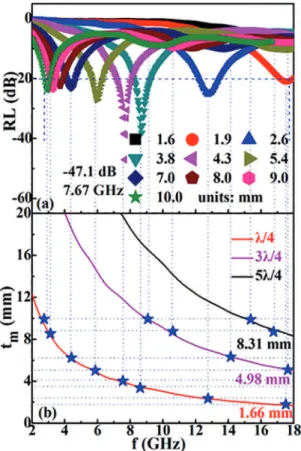
An absorber with a thickness of 4.3 mm exhibits an optimal
peak frequency of RL, tm is the thickness of the absorber.
QWC has been successfully used to explain the relationship between RL peak frequency and absorber thickness for lake-shaped carbonyl-iron particle composites, Ni@Ni2O3 core-shell particles and hcp-cobalt particles16,21,26. Figure 5b gives the dependence of λ/4, 3λ/4 and 5λ/4 on frequency for the NiFe2O4 nanosheets. The thickness contours at 1.6,
1.9, 2.6, 3.8, 4.3, 5.4, 7.0, 8.0, 9.0 and 10.0 mm, which
correspond to the absorber thickness in Figure 5a, are plotted in Figure 5. In Figure 5a, the vertical dot lines are extended
from the RL peaks, and each line from the RL peak under an
absorber thickness crosses with its corresponding thickness contour in Figure 5b. The crossover points are indicated by
the asteroid dots. Since the RL peak comes from the QWC, the frequency and number of RL peak are determined by the QWC condition when the composite thickness is ixed.
Furthermore, we can get the following information in 2-18
GHz range from the thickness contours in Figure 5b: (1) when
the absorber thickness t<1.66 mm, the thickness contour has no crossover point with the λ/4 curve, indicating no RL peak
exists in the RL curve, as shown in Figure 5a at t = 1.6 mm; (2) when 1.66 mm<t<4.98 mm, the thickness contour has
one crossover point with the λ/4 curve and one peak should
exist in the RL curve; (3) when 4.98 mm< t <8.31 mm, the
thickness contour has crossover points with the λ/4 and
Figure 4: (a) 3D representation of RL as a function of frequency
and (b) contour map of the bandwidth with RL<-10 dB (70% absorption) as a function of the absorber thickness.
than the perfect matching frequency (7.67 GHz), and they are going in the opposite direction when frequency is larger than 7.67 GHz21. RL values exceeding -20 dB in the
2.68-17.96 GHz range are obtained by choosing an appropriate
absorption-layer thickness between 1.9 and 10 mm. This
frequency range covers the absorption frequency range of
many earlier reported nanocomposites18-25. Figure 4b shows
the bandwidth of the absorption frequency for RL<-10 dB in a two-dimensional (2D) contour plot. The result indicates that a thicker absorber layer has a wider frequency bandwidth
when the thickness is less than 6 mm, and the bandwidth gradually decreases with increasing layer thickness when
the thickness is more than 6 mm. The bandwidth of a RL peak is inluenced by the derivation of matching thickness to frequency, the matching thickness, the relected wave energy from air-metal interface, the energy diference of peak frequency, and designated frequency21.
For the microwave absorbing material backed on
a conductor, the peak frequency dependence of the RL complies with the quarter-wavelength cancellation model (QWC): tm=nc/4fm |f nr r| (n = 1,3,….), where fm is the
Figure 5: (a) dependence of RL on frequency at various thickness and
3λ/4 curves, and two peaks should exist in the RL curve, as
shown in Figure 5a at t=5.4, 7.0 and 8.0 mm; (4) when t >
8.31 mm, the thickness contour has crossover points with
λ/4, 3λ/4 and 5λ/4 curves, and three peaks should exist in the
RL curve, which has been veriied in the RL curve shown
in Figure 5a at 9.0 and 10.0 mm. We can clearly see that all the asteroid dots locate on the λ/4, 3λ/4 and 5λ/4 curves, which demonstrates all the absorber thicknesses are in good
agreement with the quarter-wavelength of the composite when the peak appears in the RL curve.
4. Conclusions
In summary, NiFe2O4 nanosheets, with width varying from 200 to 800 nm and thickness ranging from 20 to 60 nm, have been synthesized in high yield and large-scale
via a simple surfactant-assisted solution route. The EM
properties of NiFe2O4 nanosheets-parain composites have been deeply investigated. An absorber with a thickness of 4.3
mm exhibits an optimal RL value of -47.1 dB at 7.67 GHz. RL values exceeding -20 dB in the 2.68-17.96 GHz range
are obtained by choosing an appropriate absorption-layer thickness between 1.9 and 10 mm. The multiple dielectric relaxation loss in NiFe2O4 nanosheets is attributed to the size distribution and morphology of the NiFe2O4 nanosheets. The magnetic loss in the present system is caused mainly by
the natural resonance. Considering the low-cost and facile
synthesis process of NiFe2O4 nanostructure with special
morphologies, the present study ofers promising materials
for microwave absorption.
5. Acknowledgements
This study has been supported partly by the National Natural
Science Foundation of China (Grant No. 51201002), by the National College Students Innovation and entrepreneurship training program of China (Grant No. 201510360009), and by the Innovation and Technology of the HKSAR Government to the Hong Kong Brach of National Rail Transit Electriication and Automation Engineering Technology Research Center under Grant 1-BBYF.
6. References
1. Zhan J, Yao YL, Zhang CF, Li CJ. Synthesis and microwave absorbing properties of quasione-dimensional mesoporous NiCo2O4 nanostructure. Journal of Alloys and Compounds. 2014;585:240-244.
2. Wu ND, Liu XG, Zhao CY, Cui CY, Xia AL. Efects of particles size on the magnetic and microwave absorption properties of carbon-coated nickel nanocapsules. Journal of Alloys and Compounds. 2016;656:628-34.
3. Li MF, Guo JJ, Xu BS. Superelastic carbon spheres under high pressure. Applied Physics Letters. 2013;102:121904.
4. Jiang LW, Wang ZH, Li D, Geng DY, Wang Y, An J, et al. Excellent microwave-absorption performances by matched magnetic-dielectric properties in double-shelled Co/C/polyaniline nanocomposites. RSC Advances. 2015;5(50):40384-40392.
5. Mehdipour M, Shokrollahi H. Comparison of microwave absorption properties of SrFe12O19, SrFe12O19/NiFe2O4, and NiFe2O4 particles.
Journal of Applied Physics. 2013;114:043906.
6. Liu XG, Cui CY, Li TT, Xia AL, Lv YH. Ni@C nanocapsules-decorated SrFe12O19 hexagonal nanolakes for high-frequency microwave absorption. Journal of Alloys and Compounds. 2016;678:234-240.
7. Tyagi S, Baskey HB, Agarwala RC, Agarwala V, Shami TC. Synthesis and characterization of SrFe11.2Zn0.8O19 nanoparticles for enhanced microwave absorption. Journal of Electronic Materials. 2011;40:2004-2014.
8. Sivakumar P, Ramesh R, Ramanand A, Ponnusamy S, Muthamizhchelvan C. Synthesis and characterization of NiFe2O4 nanoparticles and nanorods. Journal of Alloys and Compounds. 2013;563:6-11.
[9. Sivakumar P, Ramesh R, Ramanand A, Ponnusamy S, Muthamizhchelvan C. Preparation and properties of NiFe2O4 nanowires. Materials Letters. 2012;66(1):314-317.
10. Sivakumar P, Ramesh R, Ramanand A, Ponnusamy S, Muthamizhchelvan C. Synthesis, studies and growth mechanism of ferromagnetic NiFe2O4 nanosheet. Applied Surface Science. 2012;258(17):6648-6652.
11. Li FS, Song LJ, Zhou D, Wang T, Wang Y, Wang HB. Fabrication and magnetic properties of NiFe2O4 nanocrystalline nanotubes.
Journal of Materials Science. 2007;42(17):7214-7219.
12. Yang HM, Zhang XC, Ao WQ, Qiu GZ. Formation of NiFe2O4 nanoparticles by mechanochemical reaction. Materials Research Bulletin. 2004;39(6):833-837.
13. Sun YP, Liu XG, Feng C, Fan JC, Lv YH, Wang YR, et al. A facile synthesis of FeNi3@C nanowires for electromagnetic wave absorber. Journal of Alloys and Compounds. 2014;586:688-692.
14. Qiao L, Han R, Wang T, Tang LY, Li FS. Greatly enhanced microwave absorbing properties of planar anisotropy carbonyl-iron particle composites. Journal of Magnetism and Magnetic Materials. 2015;375:100-105.
15. Xue DS, Li FS, Fan XL, Wen FS. Bianisotropy picture of higher permeability at higher frequencies. Chinese Physics Letters. 2008;25:4120-4123.
16. Liu XG, Sun YP, Feng C, Jin CG, Li WH. Synthesis, magnetic and electromagnetic properties of Al2O3/Fe oxides composite-coated polyhedral Fe core-shell nanoparticles. Applied Surface Science. 2013;280:132-137.
17. Wen SL, Liu Y, Zhao XC, Cheng JW, Li H. Synthesis, multi-nonlinear dielectric resonance and electromagnetic absorption properties of hcp-cobalt particles. Journal of Magnetism and Magnetic Materials. 2014;354:7-11.
19. Liu XG, Geng DY, Shang PJ, Meng H, Yang F, Li B, et al. Fluorescence and microwave-absorption properties of multi-functional ZnO-coated α-Fe solid-solution nanocapsules.
Journal of Physics D: Applied Physics. 2008;41(17):175006.
20. Liu XG, Feng C, Or SW, Sun YP, Jin CG, Li WH, et al. Investigation on microwave absorption properties of CuO/Cu2 O-coated Ni nanocapsules as wide-band microwave absorbers.
RSC Advances. 2013;3(34):14590-4.
21. Wang T, Han R, Tan GG, Wei JQ, Qiao L, Li FS. Relection loss mechanism of single layer absorber for lake-shaped carbonyl-iron particle composite. Journal of Applied Physics. 2012;112:104903.
22. Yan LG, Wang JB, Han XH, Ren Y, Liu QF, Li FS. Enhanced microwave absorption of Fe nanolakes after coating with SiO2 nanoshell. Nanotechnology. 2010;21(9):095708.
23. Wang H, Dai YY, Gong WJ, Geng DY, Ma S, Li D, et al. Broadband microwave absorption of CoNi@C nanocapsules enhanced by dual dielectric relaxation and multiple magnetic resonances. Applied Physics Letters. 2013;102:223113.
24. Liu QL, Zhang D, Fan TX. Electromagnetic wave absorption properties of porous carbon/Co nanocomposites. Applied Physics Letters. 2008;93:013110.
25. Pan HS, Cheng XQ, Zhang CH, Gong CH, Yu LG, Zhang JW, et al. Preparation of Fe2Ni2N/SiO2 nanocomposite via a two-step route and investigation of its electromagnetic properties.
Applied Physics Letters. 2013;102:012410.