Body composition of preschool children and relation to birth
weight
THAIS COSTA MACHADO1, VIVIANE G. NASCIMENTO2, JANAÍNA P. C. DA SILVA1*, CIRO JOÃO BERTOLI3, CLAUDIO LEONE4
¹Masters in Public Health, PhD graduate student in Public Health, Department of Maternal and child Health at the School of Public Health, University of São Paulo (FSP/USP), São Paulo, SP, Brazil. ²PhD in Public Health, PhD researcher of the Department of Maternal and child Health at FSP/USP, and professor at Paulista University (UniP), São Paulo, SP, Brazil.
3M.D. in the Department of Pediatrics at USP Medical School (FMUSP) and professor of the Department of Medicine at University of taubaté (Unitau), taubaté, SP, Brazil.
4PhD and full professor (Livre-docente) in Pediatrics, Department of Pediatrics, FMUSP; associate professor of the Department of Pediatrics at FMUSP, and titular professor of the Department of Maternal and child Health at FSP/USP, São Paulo, SP, Brazil.
A
BSTRACTWork carried out at the Department of
Maternal and child Health, School of Public Health, University of São Paulo
(FSP/USP), São Paulo, SP, Brazil.
Article received: 10/2/2012
Accepted for publication: 9/11/2013
*Correspondence:
address: av. Dr. arnaldo, 715 São Paulo, SP, Brazil
ZiP code: 01246-904 Phone: +55 11 3061-7974
http://dx.doi.org/10.1590/1806-9282.60.02.011
Conflict of interest: none
Objective: to evaluate the relationship between body composition of preschool children suffering from excess weight and birth weight (BW).
Methods: probabilistic sample, by conglomerates, with 17 daycare centers (of a total of 59) composing a inal sample of 479 children. We used Z-score of Body Mass Index (zBMI) ≥ +1 and ≥ +2, respectively, to identify preschool children with risk of overweight and excess weight (overweight or obesity). The arm mus-cle area (AMA) and the arm fat area (AFA) were estimated from measurements of arm circumference, triceps skin fold thickness.
Results: the prevalence of risk of overweight was 22.9% (n=110) and excess weight was 9.3% (n=44). The risk of overweight and excess weight in children did not show correlation between BW and AFA, but it did with adjusted arm muscle area (AMAa) (rP= 0.21; p= 0.0107). The analysis of the group with ex-cess weight alone also showed a positive correlation between BW and AMAa (rP= 0.42; p= 0.0047).
Conclusion: among overweight children, lower BW is associated with a lower arm muscle area in early preschool age, regardless of the fat arm area presented by them.
Key words: body composition, preschool, birth weight, excess weight.
I
NTRODUCTIONBirth weight reflects, among other things, intrauteri-ne growth and nutritional status of the intrauteri-newborn, be-ing regarded as a separate indicator of health that can influence the growth and development of the child, in the medium and long term, also affecting the health conditions in adulthood.1 In this sense, overweight and obesity, described as having an increasing preva-lence in the population and now also affecting very young children, even in families of lower socioecono-mic status, in several studies, have been linked to birth weight.2-5
Research has also shown that low birth weight is associated with the development of chronic noncom-municable diseases in adulthood, especially when due
to intrauterine growth restriction (IUGR) and excess weight in childhood.6-9 According to Martins and Car-valho,10 among the various factors that have been lin-ked to overweight and obesity in childhood, birth weight appears all too often.
Other factors that would be determinant of risk of excess weight are significant catch-up growth in the first 2 years of life9 and body composition. The latter would modify the body’s ability to deal with glucose metabolism,8,11 especially when there is reduction in muscle mass.12,13
lean body mass that these children may have. The first hypothesis is that, in situations of stress during preg-nancy, the development of vital organs like the brain would be favored at the expense of muscle tissue. The second suggests that fetal hypoglycemia due to insuf-ficient glucose supply would cause a reduction in in-sulin secretion that, in turn, would stimulate protein breakdown. The last hypothesis is that poor fetal nu-trition would reduce the concentration of insulin-like growth factor type 1 (IGF-1), thereby undermining the growth of muscle mass.
Singhal et al.,12 in a study of adolescents, showed that an increase of the order of one standard deviation in birth weight was associated with 2% to 3% increase in lean body mass without corresponding increase in fat mass. Since muscles are important “organs” for glu-cose metabolism, “metabolic programming” that re-sults in a reduction in muscle mass would be able to cause insulin resistance.
This would be one possible mechanism by which low birth weight due to IUGR would be associated with increased risk of developing chronic noncommunica-ble diseases in adulthood.12,13
Considering the importance of early detection of risk for overweight/obesity, and its possible relation with a lower birth weight and lower lean mass, this study was conducted to evaluate the relationship between birth weight and body composition in pres-chool children with excess weight.
M
ETHODSCross-sectional study with preschoolers aged 2 to less than 4 years, enrolled and attending daycare centers in the city of Taubaté, São Paulo, Brazil. The sampling was probabilistic and random, by clusters, from a list of 59 daycare centers provided by the Department of Education and Culture of the City of Taubaté, in the state of São Paulo, Brazil, so that 17 were randomly se-lected to compose a final study sample.
In order to calculate the size of the sample, an expec-ted prevalence of at least 25% for excess weight was used, estimated to have an accuracy of 5% for a level of signii-cance (α) of 0.05 and test power (1-β) 0.80, leading to a required minimum sample size of 528 preschoolers.
The sample of randomly selected daycare centers included a total of 534 children. The data collection period was from September of 2008 to March of 2010. All children in the sample had the consent of parents
or guardians to participate in the study. Of the initial
sample, 55 children (10.3%) who had a low birth weight or whose weight at birth was above 4.5 g were exclu-ded, changing the total number of children in the fi-nal sample to 479.
From a total of 479 children and estimating a con-fidence interval of 95% (for 80% statistical power), it was found that the final sample would discriminate 4-percentage point differences, which was considered adequate for the study, with no need to replace the 55 children excluded, corresponding to 10.3% of the ini-tially selected sample.
Birth weight (BW) and birth length (BL) of these children were collected through standardized forms, derived from three sources: the register of the Munici-pal University Maternity Hospital; the child’s card, which is attached to the daycare center’s enrollment forms; and, if necessary, information provided by mo-thers and/or guardians of the child, in order to dimi-nish the losses caused by the lack of this information. Retrieving information on gestational age was not pos-sible and therefore no assessment of appropriateness of weight and birth length was performed. In the analy-sis, we chose to operationalize birth weight (in grams), birth length (in centimeters) and weight:length ratio at birth (g/cm) on an ongoing basis.
All children underwent anthropometric assessment in their own daycare centers, recording weight, height, arm circumference (AC) and triceps skin fold thickness (TST). The measurements were performed by nutritio-nists and medical students previously trained in accor-dance with the standards of the World Health Organi-zation (WHO).14
The anthropometric measurements were perfor-med at the daycare centers, on days previously schedu-led. For weighing, a portable digital scale SECA ® (Seca ® 803) was used, with a capacity of 150 kg and 100 g precision. Children were weighed without shoes and in light clothing. Height was obtained using portable stadiometer WISO ®, wall mounted, standardized in centimeters and millimeters. The children’s height was measured without shoes and without hair ornaments; they were placed standing up, with arms outstretched at their sides, shoulders relaxed, heels put together, and aligned with the Frankfurt horizontal plane.14
The measurement of triceps skin fold thickness (TST) was taken with a LANGE ® skin fold caliper, with constant pressure at the midpoint of the dorsal surfa-ce of the non-dominant arm in the trisurfa-ceps area.14 The fold of skin was measured twice, so that, if there was discrepancy between the two measurements, the pro-cedure would be performed again. Thereafter, for pur-poses of analysis, the average of the recorded values was used for each child.
To point out the children at risk of being overweight, we used a cut off ≥ +1 for the Z score of body mass index (zBMI) and, in order to identify those with excess weight (overweight or obese), the cutoff ≥ +2 zBMI was used as the reference values adopted by the WHO (2006)15 and the guidelines of both the Ministry of Health (2009)16 and the WHO.17
The arm muscle area (AMA) and arm fat area (AFA) were estimated based on mathematical formulas by Rolland-Cachera et al.,18 using triceps skin fold and arm circumference measures. The correction of AMA (AMAa), used in this study, follows the proposition of Heymsfield et al.,19 being proportionally adjusted to this population.
For statistical analysis, Medcalc® (9.3.9.0 version) and SPSS® (15.0 version) softwares were used. Fre-quencies, proportions and means were calculated ac-cording to their relevance, with subsequent estimate of their associations. We opted to use the significance level of 0.05 and, where appropriate, confidence inter-vals (CI) of 95% were also estimated.
This study was in accordance with resolution CNS 196/96, and was approved by the Ethics Committee in Research of the University of (CEP/Unitau), no. 0002/05, and the Research Ethics Committee of the School of Public Health, at University of São Paulo (protocol no 361/09).
R
ESULTSThe mean age of the final sample was 3.3 years, with a standard deviation (SD) of 0.3 years. Of the total num-ber of children assessed, 53.9% (n = 258) were male.
The prevalence of normal weight was at 67.8% (n= 325), with risk for overweight at 22.9% (n= 110) and ex-cess weight at 9.3% (n= 44).
In the group of preschoolers at risk for overweight, overweight and obesity, we observed that 52% of chil-dren were female.
When comparing the group of preschool children without nutritional disorders with the risk of
over-weight or excess over-weight, it was found that there was no significant difference in terms of age (p= 0.645) and birth weight (p= 0.370).
The arm muscle area (AMA) (p = 0.002), arm fat area (AFA) (p <0.001) and zBMI (p <0.0001), as expected, sho-wed signiicant differences between the groups at risk of being overweight or presenting excess weight.
In the inal sample (n = 479), there was a positive cor-relation between birth weight and zBMI (rP= 0.23; p < 0.0001) and birth length (rP= 0.16; p= 0.0004), as well as the weight:length ratio at birth (rP= 0.20; p < 0.0001).
In 154 children at risk for overweight or excess weight, a positive correlation was observed between zBMI and AMAa (rP= 0.33; p < 0.0001) and AFA (rP= 0.74; p < 0.0001). Nevertheless, zBMI was not correlated with weight at birth (rP= 0.04; p= 0.62).
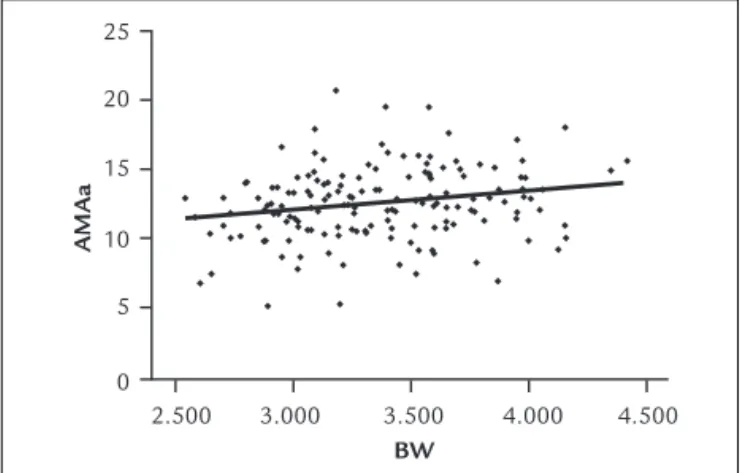
Figure 1 shows the positive correlation between birth weight and AMAa (rP= 0.21; p= 0.0107), observed in the group of children at risk for overweight and ex-cess weight. In both groups, there was a positive cor-relation between birth weight and unadjusted AMA (rP= 0.21; p= 0.0086), even though no correlation was ob-served between birth weight and AFA (rP= -0.13; p= 0.1082).
2.500 25
20
15
10
5
0
3.000 3.500 4.000 4.500
AMAa
BW
FIGURE 1 Corr elation between birth weight (BW) and adjust ed arm muscle ar ea (AMAa) in pr eschool childr en at risk f or over weight
and excess weight.
dren, adolescents and/or adults,10,22,23 but, with respect to the beginning of the preschool age, we found only two studies on the relationship between birth weight and lean mass - both conducted in developed countries.24,25
Hediger et al.24 found that the arm muscle area (AMA) was lower in children born small for gestational age (SGA) when compared to large for gestational age (LGA). Similar results were observed in this study, i.e., lower birth weight was related to lower AMA. However, no as-sociation was found between birth weight and AFA, un-like the observations made by Hediger et al.24 that AFA was associated with birth weight, being lower in SGA. Still according to these authors, the weight at birth was more weakly associated with AFA compared with AMA. Another study showed that children born SGA also had less lean body mass, despite having more fat mass com-pared with children appropriate for gestational age (AGA). Both groups (SGA and LGA) had similar weight gain and BMI.25
A limitation of this study was that it was not possi-ble to retrieve information on the gestational age of a part of the children included in the sample. But even though this has made almost impossible to compare this work in more detail with the aforementioned stu-dies, the validity of the results observed in this study, as well as the trends indicated by it, were certainly not com-promised.
As for studies in later life, a survey among school chil-dren also found no relationship between birth weight and proportion of body fat mass, but noted a positive corre-lation between birth weight and lean mass in these chil-dren.20 Similar results were also observed in other studies with preadolescents20 and adults.12 These data suggest that other factors, such as weight gain in the irst year of life and/or a genetic predisposition,22,26 would be associa-ted with the development of a greater amount of body fat in childhood.
Regarding the Barker hypothesis,6,7 there seems to be consensus on the relationship between birth weight and lean body mass, regardless of age group, but the relation-ship with fat mass remains controversial.
All these facts, together with the results of this study reinforce the initial hypothesis that there is indeed a po-sitive association between birth weight and arm muscle area of preschool children, which is indicative of the exis-tence of this very association with lean body mass.
AMA, a measure to estimate lean mass, seems to be a more consistent indicator than the single use of BMI for assessing possible risks of overweight in childhood. The importance of this consideration is reinforced by the fact
2.500 25
20
15
10
5
0
3.000 3.500 4.000 4.500
AMAa
BW
FIGURE 2 Correlation between birth weight (BW) and adjusted arm muscle area (AMAa) of preschool children with excess weight (overweight or obese).
Figure 3 shows that, in the group of preschool children at risk for overweight or with excess weight, there was no correlation between AFA and AMAa (rp= 0.0110; p= 0.8923).
25
20
15
10
5
0
25 20 15
10 5
0
AMAa
AFA
FIGURE 3 Correlation between the adjusted arm muscle area (AMAa) and arm fat area (AFA) of preschool children at risk for overweight and excess weight.
D
ISCUSSIONIn this study, in preschoolers at risk for overweight or ex-cess weight, birth weight was directly associated with the adjusted arm muscle area (AMAa), regardless of the arm fat area (AFA) displayed by the child, even if there was no association between birth weight and zBMI in the pres-chool age range.
chil-that our results show no association between birth weight and BMI in preschool children presenting excess weight or who are obese.
Thus, even considering the relationship between lean mass and ‘metabolic changes in the body’, as described in the literature, evaluating the AMA becomes even more important in the routine of child care.
If future research conirms these correlations, the AMA will become an important marker of risk for deve-loping or maintaining obesity until early adulthood, with all of its consequences. This is particularly important for children who are born with lower weight and become overweight as early as in the beginning of the preschool age, which would justify even the adoption of AMA as-sessment as part of these children’s routine care.
This research was funded by the São Paulo Research Foundation – FAPESP, process no. 08/53142-9.
R
ESUMOObjetivo: avaliar a relação entre a composição corporal de pré-escolares portadores de excesso de peso e o seu peso ao nascimento (PN).
Métodos: amostra probabilística, por conglomerados, com 17 creches (de um total de 59), composta por 479 crianças. Para identiicar os pré-escolares portadores de risco de sobrepeso e de excesso de peso (sobrepeso ou obe-sidade), utilizou-se o escore Z de índice de massa corpó-rea (zIMC) ≥ +1 e ≥ +2, respectivamente. A ácorpó-rea muscular do braço corrigida (AMB) e a área gorda do braço (AGB) foram estimadas a partir das medidas de circunferência do braço e da dobra cutânea tricipital.
Resultados: a prevalência de risco de sobrepeso foi de 22.9% (n= 110) e de excesso de peso de 9.3% (n= 44). Jun-tas, as crianças com risco de sobrepeso e excesso de peso não mostraram correlação entre o PN e a área gorda do braço, mas, sim, com a área muscular do braço corrigida (AMBc) (rP= 0.21; p= 0.0107). A análise só do grupo com excesso de peso também evidenciou correlação positiva entre PN e AMBc (rP= 0.42; p= 0.0047).
Conclusão: nas crianças com excesso de peso, um menor PN está associado a uma menor área muscular do braço no início da idade pré-escolar, independentemente da área gorda do braço que elas apresentem.
Unitermos: composição corporal, pré-escolar, peso ao nascer, excesso de peso.
R
EFERENCES1. Wilcox AJ. On the importance and the unimportance of birth weight. Int J Epidemiol 2001; 30:1233-41.
2. Raj M, Sundaram KR, Paul M, Sudhakar A, Kumar RK. Dynamics of growth and weight transitions in a pediatric cohort from India. Nutr J 2009; 8:55.
3. Nascimento VG, Bertoli CJ, Bertoli LMQ, Feferbaun R, Abreu LC, Leone C. Tendência secular de crescimento de crianças pré-escolares, Brasil, 1997-2007. Rev Bras Crescimento Desenvolv Hum 2010; 20:199-207. 4. Shoeps DO, Abreu LC, Valenti VE, Nascimento VG, Oliveira AG, Gallo PR
et al. Nutritional status of pre-school children from low income families. Nutr J 2011; 10:43.
5. Nascimento VG, Shoeps DO, Souza SB, Souza JMP, Leone C. Risco de sobrepeso e excesso de peso em crianças de pré-escolas privadas e ilantrópicas. Rev Assoc Med Bras 2011; 57:657-61.
6. Barker DJ, Bull AR, Osmond C, Simmonds SJ. Fetal and placental size and risk of hypertension in adult life. BMJ. 1990;301:259-62.
7. Barker DJ, Hales CN, Fall CH, Osmond C, Phipps K, Clark PM. Type 2 (non-insulin-dependent) diabetes mellitus, hypertension and hyperlipidaemia (syndrome X): relation to reduced fetal growth. Diabetologia 1993; 36:62-7.
8. Wilkin TJ, Metcalf BS, Murphy MJ, Kirkby J, Jeffery AN, Voss LD. The relative contributions of birth weight, weight change, and current weight to insulin resistance in contemporary 5-year-olds: the EarlyBird Study. Diabetes 2002; 51:3468-72.
9. Ong KK, Ahmed ML, Emmett PM, Preece MA, Dunger DB. Association between postnatal catch-up growth and obesity in childhood: prospective cohort study. BMJ 2000; 320:967-71.
10. Martins EB, Carvalho MA. Associação entre peso ao nascer e o excesso de peso na infância: revisão sistemática. Cad Saúde Pública 2006; 22:2281-300.
11. Ong KK, Dunger DB: Birth weight, infant growth and insulin resistance. Eur J Endocrinol 2004; 151(Suppl 3):U131-9.
12. Singhal A, Wells J, Cole TJ, Fewtrell M, Lucas A. Programming of lean body mass: a link between birth weight, obesity, and cardiovascular disease? Am J Clin Nutr 2003; 77:726-30.
13. Ylihärsilä H, Kajantie E, Osmond C, Forsén T, Barker DJP, Eriksson JG. Birth size, adult body composition and muscle strength in later life. Int J Obes (Lond). 2007;31:1392-9.
14. World Health Organization. Physical status: the use and interpretation of anthropometry. Report of a WHO Expert Committee. Geneva; 1995. 15. World Health Organization. Child growth standards based on length/
height, weight and age. Acta Paediatr 2006; 450 (Suppl):76-85. 16. Ministério da Saúde. Departamento de Atenção Básica. SISVAN. Disponível
em: http://nutricao.saude.gov.br\\sisvan.php?conteudo=curvas_cresc_oms. 17. De Onis M, Lobstein T. Deining obesity risk status in the general childhood population: Which cut-off should we use? Int J Pediatr Obes 2010; 5:458-60.
18. Rolland-Cachera MF, Brambilla P, Manzoni P, Akrout M, Sironi S, Maschio AD, Chiumello G. Body composition assessed on the basis of arm circumference and triceps skin fold thickness: a new index validated in children by magnetic resonance imaging. Am J Clin Nutr 1997; 65:1709-13. 19. Heymsield SB, McManus C, Smith J, Stevens V, Nixon DW. Anthropometric measurement of muscle mass: revised equations for calculating bone-free arm muscle area. Am J Clin Nutr 1982; 36:680-90.
20. Kelly LA, Lane CJ, Ball GD, Weigensberg MJ, Vargas LG, Byrd-Williams CE et al. Birth weight and body composition in overweight Latino youth: a longitudinal analysis. Obesity 2008; 16:2524-8.
21. Wells JC, Hallal PC, Wright A, Singhal A, Victora CG. Fetal, infant and childhood growth: relationships with body composition in Brazilian boys aged 9 years. Int J Obes (Lond) 2005; 29:1192-8.
22. Ong KK. Size at birth, postnatal growth and risk of obesity. Horm Res 2006; 65(Suppl. 3):65-9.
24. Hediger ML, Overpeck MD, Kuczmarski RJ, McGlynn A, Maurer KR, Davis WW. Muscularity and fatness of infants and young children born small- or large-for-gestational-age. Pediatrics 1998; 102(5):e60.
25. Ibáñez L, Ong K, Dunger DB, De Zegher F. Early development of adiposity and insulin resistance after catch-up weight gain in small-for-gestational-age children. J Clin Endocrinol Metab 2006; 91(6):2153-8.