Brazilian Microwave and Optoelectronics Society-SBMO received 29 Jun 2017; for review 06 July 2017; accepted 11 Nov 2017
Brazilian Society of Electromagnetism-SBMag © 2017 SBMO/SBMag ISSN 2179-1074
Abstract— In this paper we propose an improved version of a single receiver DF system that combines a PLL scheme with the MUSIC algorithm to obtain both azimuthal and zenithal angles. The new approach uses a more efficient algorithm to remove the typical ambiguities of PLL-based schemes. We carry out several experiments to assess the algorithm performance. Among them, we consider complex environments, such as wireless communication channels where the received signal is corrupted by noise and suffers from distortion, interference, and multipath effects. The new scheme is tested for BPSK and QPSK signals under these conditions. The simulated results show superior performance of the proposed PLL algorithm when compared to previous techniques.
Index Terms— Direction Finding, DOA Estimation, MUSIC and PLL.
I. INTRODUCTION
The phased-lock loop (PLL)-based direction finding (DF) technique is employed herein to
determine the direction of arrival (DOA) of a radiofrequency (RF) signal using a single receiver
system. The basic system is formed by a circular antenna array and an RF switch [1], [2], [3]. Each
antenna has one PLL to track the phase of the RF signal. After locked, phase ambiguity needs to be
removed so that the direction of arrival can be estimated correctly [1]. Then, curve fitting algorithms
are explored in this paper to correct the data for applications where PLL ambiguity is present.
Multichannel techniques are usually applied for DOA estimation purposes, among which we find
high-resolution algorithms, such as MUSIC (multiple signal classification) [4] and ESPRIT
(estimation of signal parameters via rotational invariance technique) [5]. However, practical
situations (related to power consumption and/or volume constraint) may require a reduced number of
receiving channels. For that reason, single receiver techniques have attracted significant attention for
both military and civilian applications.
The PLL-based single receiver approach was introduced in [1] for digital modulated signals, using a
system with 8 antennas. Further, [2] studied systems with 16 antennas and presented an algorithm to
remove the slight frequency offset which can be found in RF signals. More recently, [3] used a PLL
technique independent of the number of antennas, maintaining low complexity but with a zenithal
angle of 90º. These techniques were tested for BPSK signals only. In [6], we described the PLL-based
Improved PLL-based MUSIC Algorithm for
Single Receiver DF Systems
Aline G. T. Duarte, José A. Apolinário Jr. and José C. A. Santos,
Military Institute of Engineering - IME
Electrical Engineering Department - SE/3
Rio de Janeiro, RJ - Brazil
Journal of Microwaves, Optoelectronics and Electromagnetic Applications, Vol. 16, No. 4, December 2017 983
DOI: http://dx.doi.org/10.1590/2179-10742017v16i4972
Brazilian Microwave and Optoelectronics Society-SBMO received 29 Jun 2017; for review 06 July 2017; accepted 11 Nov 2017
Brazilian Society of Electromagnetism-SBMag © 2017 SBMO/SBMag ISSN 2179-1074
technique used in tandem with the MUSIC algorithm. In addition, its application was extended for
QPSK signals. In the current paper, we present an improved version of the latter technique, with a
more efficient algorithm to remove the typical ambiguity of PLL-based schemes. Among the
improvements found in the new algorithm, we highlight the addition of a minimum search approach
and a threshold factor γ. We also evaluate the new algorithm in more complex environments, for both
BPSK and QPSK signals, and compare it to previous techniques.
This work is organized as follows. Section II presents the primary PLL-based single-receiver DF
system. Section III presents the improved PLL-based MUSIC version. Next, Section IV presents
advanced simulated experiments with the new approach and Section V investigates means to improve
the PLL response and shows the proposed algorithm performance analysis in a diversity of
environments. Section VI presents the conclusions of this paper.
II. PLL-BASEDSINGLERECEIVERDFSYSTEMS
In systems that use multiple channels, the impinging signals on all antenna elements are
simultaneously measured and can be straightly compared to estimate DOA. However, in a single
receiver structure, antenna elements are switched, such that the incoming signals at the receiving
antennas are sequentially observed. In this case it is not possible to process these signals directly in
the space-time domain.
The PLL-based single-receiver DF system is shown in Fig. 1. The receiver has two digital PLL
implementations. More specifically, implementations whose phase error detectors are tuned for BPSK
and QPSK, respectively.
We have assumed that the signal related to the modulation, , is represented by = − Ω� . The message symbol represents the Non-Return to Zero (NRZ) waveform having
levels +1 or −1 [7].
In the BPSK case, there is a π radian phase ambiguity. It is possible for the demodulated output to
be − rather than , i.e. there are two stable operating points for each cycle of the input. The
QPSK case has a similar behavior, however, there are four stable operating points for each cycle of
the input. It follows that the QPSK loop has a �⁄ radian phase ambiguity [7].
In Fig. 1, the signal received from each of the M antennas is sampled and processed by an
independent PLL. The PLL tracks the common phase offset � plus the specific phase of each
Brazilian Microwave and Optoelectronics Society-SBMO received 29 Jun 2017; for review 06 July 2017; accepted 11 Nov 2017
Brazilian Society of Electromagnetism-SBMag © 2017 SBMO/SBMag ISSN 2179-1074
Fig. 1: PLL-based Single-Receiver DF System.
From the PLL technique introduced in [1] and detailed in our previous work [6], if modulation is
not considered, the PLL output is presented as
= �� � � ( �� − �) − � ,
where is the radius of the circular array and � is the wavelength.
Although the phase is desired, the PLL has an operating characteristic which adds ambiguity to
the phase of the signal. The ℎ PLL phase output, 0 ≤ m < M, is given as
´ = �� � � ( �� − �) − � + � ,
where is the modulation factor ( = , ± , ± in the case of BPSK, = , ± . , ± , ± . , ±
for QPSK) and � represents the ambiguity; � and � are the azimuthal and zenithal angles,
respectively. Being and � fixed by design, as well as M, there are four unknown variables: �, � , �
and . Hence, DOA estimation depends on the knowledge of , along with the constant offset � .
Phase ambiguity must be removed from the demodulation loop so that DOA estimation can be carried
out.
The first part of the solution is performed by removing the phase offset (� ) with a differentiation
stage. Eq. (3) represents the unambiguous answer, where is defined as the PLL output without
ambiguity, while Eq. (4) represents the actual first difference.
Δ = − − = − si� � si� � si� (� �� −� − �) ,�
� ´ = ´ − ´ − = − � � � �� � ( �� −�� − �) + � �,
(2) (1)
(3)
Journal of Microwaves, Optoelectronics and Electromagnetic Applications, Vol. 16, No. 4, December 2017 985
DOI: http://dx.doi.org/10.1590/2179-10742017v16i4972
Brazilian Microwave and Optoelectronics Society-SBMO received 29 Jun 2017; for review 06 July 2017; accepted 11 Nov 2017
Brazilian Society of Electromagnetism-SBMag © 2017 SBMO/SBMag ISSN 2179-1074
where ∆ = − − .
In both equations, = �
� = �, when the radius is assumed to be =
� . The first difference is a
sinusoid (as a function of m) that has the maximum amplitude for � = 90º, given by
|�� | ��= � � �
.
After that, a curve fitting algorithm is used to remove the PLL ambiguity of the first difference in
order to obtain the DOA. In the literature, there are four distinct curve fitting versions:
1. Algorithm I [1] chooses the correct sequence by minimizing the squared error among the
possible existing curves. The number of possible solutions can be reduced by using the
maximum amplitude |Δ | ��. It has been applied to 8 antennas and BPSK signals.
Although it can also be used for QPSK and 16 antennas, with an increased computational
complexity, this application was not presented.
2. Algorithm II [2] is used for the case of 16 antenna array with =�. In this case, the
maximum amplitude of the first and the second differences are |Δ ´ | ��≈ . � and |Δ ´´ | ��≈ . �, respectively. This information is the essence of this algorithm for the ℎ element of the first difference cannot be more than . � from the − ℎ element.
Thus, the correct phase shall be the closest point.
3. Algorithm III [3] was proposed in an attempt to reduce the computational complexity of
Algorithm I. It is based on the second difference to correct the first one and was validated
for BPSK signals with zenith fixed to 90º.
4. Algorithm IV [6] presents the FFT Peak Finder Algorithm, where the PLL-based
technique was used with MUSIC for the first time; also, the analysis was extended for
QPSK signals. Considering that the FFT Peak Finder Algorithm removes the PLL
ambiguity of all phases , the input signal correlation matrix can be formed and used to
obtain the MUSIC spectrum � ���� �, � , a function that depicts the desired direction, �
(azimuth) and � (zenith), as its highest power peak.
After finding the correct first difference curve, the FFT of the sequence Δ ´ is performed to
obtain the azimuth angle (�). The FFT of this vector has its � ℎ element given by [�] =
∑ − � ´ =
− ��
� from which angle � can be estimated using the second FFT coefficient:
� =�− � − ∠ [ ].
(5)
Brazilian Microwave and Optoelectronics Society-SBMO received 29 Jun 2017; for review 06 July 2017; accepted 11 Nov 2017
Brazilian Society of Electromagnetism-SBMag © 2017 SBMO/SBMag ISSN 2179-1074
′
III. THEIMPROVEDPLL-BASEDAPPROACHAPPLYINGMUSICALGORITHM
The block diagram of the proposed technique is essentially that in [6], shown in Fig. 2. However,
the curve fitting block of the figure is modified such that the new algorithm removes the PLL
ambiguity more efficiently. As its previous version, the improved algorithm employs the high
resolution MUSIC algorithm to obtain both horizontal (azimuthal) and vertical (zenithal) angles.
While the curve fitting algorithm in [6] searched for FFT maximums, the new version, in the
following, searches for maximums and minimums.
Fig. 2: PLL-based block diagram.
A. The FFT Peak & Min Finder Algorithm
The proposed curve fitting algorithm is based on finding the possible peaks and minimums of the
first difference and choosing the correct sine curve. For BPSK signals, it was observed that in an M
element array the largest number of maximums (peaks) and minimums is M. For other modulations,
the largest number of peaks and minimums corresponds to NM, where N is the number of bits per
symbol.
For detecting limits, we consider the peak between 0 and |Δ | �� and the minimum between −|Δ | �� and 0, both extended by a threshold factor γ, related to the percentage of points that exceed the value of |Δ | �� in the presence of noise. Thus, the algorithm considers that the peak
is in the positive range [ , |Δ | ��+ γ] and the minimum is in the negative range [−|Δ | ��− �, ].
The algorithm calculates and stores all replica of the �. The values in the actual first differences
will be added by � in order to evaluate these values within the target range (either positive or
Journal of Microwaves, Optoelectronics and Electromagnetic Applications, Vol. 16, No. 4, December 2017 987
DOI: http://dx.doi.org/10.1590/2179-10742017v16i4972
Brazilian Microwave and Optoelectronics Society-SBMO received 29 Jun 2017; for review 06 July 2017; accepted 11 Nov 2017
Brazilian Society of Electromagnetism-SBMag © 2017 SBMO/SBMag ISSN 2179-1074
Each peak and minimum of Δ ´ , given by Eq. (4), is assigned to a theoretical sinusoid with a
fundamental frequency = �, which is taken as a target solution. Then, the closest points to this
sinusoid are picked out, and the resulting curve is designated as a candidate solution. The complete
process generates a set of candidate solutions.
Following, we use the natural response of a sinusoid in the frequency domain to select the best
candidate solution. For that, we use the Fast Fourier Transformer (FFT)
[�] = ∑ � ´ −
=
− � ,
where � ´ is the first difference of the PLL output.
The FFT of the correct curve (� ) has the following features:
[ ] corresponds to the DC level;
[ ] concentrates the sine energy;
[�] values, ≤ � ≤ � − , are close to zero. The FFT Peak & Min Finder objective function is set to
� = | [ ]| ∑ − [ ]
= ,
which is a generalization of Eq. (19) in [6]. The candidate with the highest ξ (objective function) is
select as the best solution.
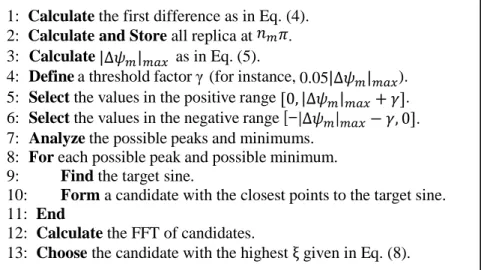
The complete algorithm is shown in Fig. 3, which will be henceforth referred to as Algorithm V.
Fig. 3: Algorithm V: the proposed FFT Peak & Min Finder Algorithm.
1: Calculate the first difference as in Eq. (4). 2: Calculate and Store all replica at �. 3: Calculate |Δ | �� as in Eq. (5).
4: Define a threshold factor γ (for instance, 0.05|Δ | ��). 5: Select the values in the positive range [ , |Δ | ��+ �]. 6: Select the values in the negative range [−|Δ | ��− �, ]. 7: Analyze the possible peaks and minimums.
8: For each possible peak and possible minimum. 9: Find the target sine.
10: Form a candidate with the closest points to the target sine. 11: End
12: Calculate the FFT of candidates.
13: Choose the candidate with the highest ξ given in Eq. (8).
(7)
Brazilian Microwave and Optoelectronics Society-SBMO received 29 Jun 2017; for review 06 July 2017; accepted 11 Nov 2017
Brazilian Society of Electromagnetism-SBMag © 2017 SBMO/SBMag ISSN 2179-1074
The proposed improved algorithm is more elaborate when compared to the previous version in [6].
The inclusion of minimums makes it more robust to noisy conditions. The threshold factor � is set to
0.05|Δ | �� in order to avoid loss of data needed to find the correct sinusoid.
Fig. 4 shows an example of how the proposed algorithm works using a QPSK signal with 16
antennas. Fig. 4 (a) presents the PLL output points (Δ ´ ) in red, the |Δ | �� threshold in yellow,
and the limits of positive and negative ranges in black, the selected values in the target ranges for
peak and minimum analyzes in green and blue, respectively. It also shows the points in the positive
range with peaks in 3, 8, and 14; and the points in the negative range with minimums in 6, 11, and 16.
After the peak & minimum analyzes, the result is shown in Fig. 4 (b), where the candidate with the
highest ξ (objective function), in other words, the correct data sequence that forms the sinusoid Δ ,
is shown in red.
Fig. 4: DOA estimation using The FFT Peak & Min Finder Algorithm, with � = 120º and � = 50º: (a) peaks and minimums selection; (b) Choosing the correct sinusoid.
B. Applying MUSIC to Single Receiver DF Systems
Algorithm MUSIC is essentially a multichannel technique. Its correlation matrix is given by ��=
[� �H ], where, for an array of M sensors, we can write
� = − �� +� [
− ���
⋮ − ����−
] ,
Journal of Microwaves, Optoelectronics and Electromagnetic Applications, Vol. 16, No. 4, December 2017
DOI: http://dx.doi.org/10.1590/2179-10742017v16i4972
Brazilian Microwave and Optoelectronics Society-SBMO received 29 June 2017; for review 06 July 2017; accepted 11 Nov 2017
Brazilian Society of Electromagnetism-SBMag © 2017 SBMO/SBMag ISSN 2179-1074 989
ω
m
with � defined as the time that the signal travels the distance from the ℎ antenna to the central
reference point, expressed in samples for a given sampling frequency = ���
�� , � being the central
frequency of a narrowband signal.
In a PLL-based single receiver DF system, the estimated phase ´ is obtained integrating the best
candidate solution Δ ´ ). Thus, assuming unit variance and unit antenna gain, the elements of the
correlation matrix become
[ �] , = � � −� ,
with u and v from 0 to M− 1.
From �� as in Eq. (10), introduced previously in [6], the noise subspace � is formed [4] and
the MUSIC spectrum,
� � � �, � =a
�,� a�,�,
is evaluated for each � and �. The MUSIC spectrum P ����, obtained from the correlation matrix
��, is a function that shows the highest power peak of the signal in the direction of arrival given by � (azimuth) and � (zenith). In this way, Eq. (11) becomes an alternative solution obtaining both
horizontal (azimuthal) and vertical (zenithal) angles instead of using Eq. (6).
IV. PERFORMANCEEVALUATIONWITHSIMULATEDSIGNALS
The performance of the present PLL-based approach is compared to existing algorithms in a
controlled scenario. All simulations are carried out in MATLAB®.
We use a carrier frequency ( �) of 70 MHz, a sampling frequency = 6 �, a switching cycle time
of 0.1 ms and a bit rate of 1.6 Mbps. Each measure is obtained by averaging the results over ten
independent runs.
A. Performance Analysis
Figs. 5 and 6 show a comparative performance among the proposed Algorithm V and Algorithms I,
II, III, and IV, for various azimuthal and zenithal angles. Input signals were modulated in BPSK and
QPSK with additive random white noise; signal-to-noise ratio (SNR) was kept to 20dB.
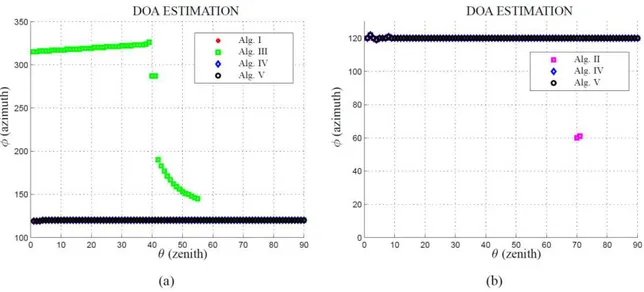
The experimental results show that Algorithm III is valid only for azimuthal angles above 55° and
BPSK signals, whereas Algorithm II is limited to 16 antennas only (Fig. 5 (b) and Fig. 6 (b)).
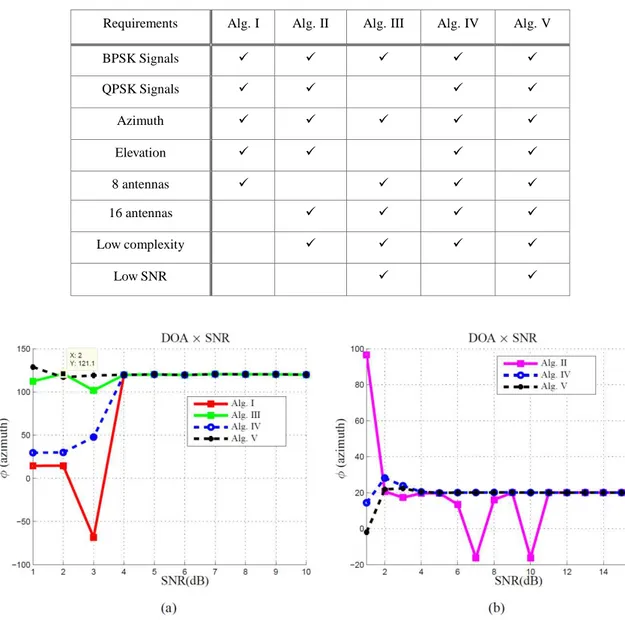
Fig. 7 (a) and Fig. 7 (b) show the result for lower SNR conditions, where good results were
obtained for SNR > 2dB. Algorithm V presented better performance for lower SNR values.
(10)
Brazilian Microwave and Optoelectronics Society-SBMO received 29 June 2017; for review 06 July 2017; accepted 11 Nov 2017
Brazilian Society of Electromagnetism-SBMag © 2017 SBMO/SBMag ISSN 2179-1074 Fig. 5: Azimuthal angle estimation: (a) 8 antennas BPSK; (b) 16 antennas QPSK signals, with � = 90°.
Fig. 6: Zenithal angle estimation: (a) 8 antennas BPSK; (b)16 antennas QPSK signals, with � = 120°.
The main conclusions of this comparison are summarized in Table I where we see that
Algorithm V complies to all conditions, presenting consistent results and better performance in all
Journal of Microwaves, Optoelectronics and Electromagnetic Applications, Vol. 16, No. 4, December 2017
DOI: http://dx.doi.org/10.1590/2179-10742017v16i4972
Brazilian Microwave and Optoelectronics Society-SBMO received 29 June 2017; for review 06 July 2017; accepted 11 Nov 2017
Brazilian Society of Electromagnetism-SBMag © 2017 SBMO/SBMag ISSN 2179-1074 991
TABLEI. SUMMARYOFRESULTS
Requirements Alg. I Alg. II Alg. III Alg. IV Alg. V
BPSK Signals
QPSK Signals
Azimuth
Elevation
8 antennas
16 antennas
Low complexity
Low SNR
Fig. 7: DOA estimation for several SNRs: (a) BPSK Signal and 8 antennas array, where � = 120°; (b) QPSK signal and 16 antennas array, where � = 20º.
B. Computational Burden
In order to evaluate the computational performance of the new algorithm, a processing time
analysis is performed. Tab. II shows the processing time for all algorithms using MATLAB® on a
computer with CPU Intel Core i7–4500U, 1.8GHz and 8GB RAM. The simulations were performed
for a 64 different DOAs (corresponding to 64 different sinusoids), except for Algorithms II and III,
Brazilian Microwave and Optoelectronics Society-SBMO received 29 June 2017; for review 06 July 2017; accepted 11 Nov 2017
Brazilian Society of Electromagnetism-SBMag © 2017 SBMO/SBMag ISSN 2179-1074 TABLE II. PROCESSINGTIMEFORALLALGORITHMS
All schemes were evaluated for the three scenarios of Table II. It is observed that more antennas
and more complex modulations impact on the average number of interactions, increasing the
processing time. In these cases, ambiguity removal becomes more difficult. The new features
(minimum search and use of a threshold) rendered robustness to the proposed algorithm. However,
this came with a price, a slightly larger processing time when compared to Algorithms III and IV, for
the 8-antenna BPSK case. Nevertheless, the new Algorithm V showed good performance for all these
scenarios, for up to 16 antenna arrays and QPSK modulations. It is worth noting that Algorithm I
presents a very high processing time for arrays with many antennas.
V. PERFORMANCEEVALUATIONINCOMPLEXENVIRONMENTS
In this section, we investigate the performance of the proposed algorithm in more complex
environments, with the main sources of error due to multipath and interference.
Angular errors are defined as � = |� − �̂| and �= |� − �̂|, for zenith and azimuth, respectively,
where �̂ and �̂ are the estimated values for these quantities.
Each measure is obtained by averaging the results over ten independent runs.
Scenario Method Target Sines
Average Number of Interactions
Processing Time
8 Antennas Array Signal BPSK Algorithm I Algorithm II Algorithm III Algorithm IV Algorithm V 64 – – 64 64 256 – 16 8 16 0.158657s – 0.055402s 0.022683s 0.119697s 8 Antennas Array
Signal QPSK Algorithm I Algorithm II Algorithm III Algorithm IV Algorithm V 64 – – 64 64 65536 – – 16 32 0.755744s – – 0.289961s 0.353768s 16 Antennas Array
Signal QPSK Algorithm I Algorithm II Algorithm III Algorithm IV Algorithm V 64 – – 64 64
Journal of Microwaves, Optoelectronics and Electromagnetic Applications, Vol. 16, No. 4, December 2017
DOI: http://dx.doi.org/10.1590/2179-10742017v16i4972
Brazilian Microwave and Optoelectronics Society-SBMO received 29 June 2017; for review 06 July 2017; accepted 11 Nov 2017
Brazilian Society of Electromagnetism-SBMag © 2017 SBMO/SBMag ISSN 2179-1074 993
A. PLL parameters sensitivity and their relation to the SNR
The digital PLL used for DOA estimation is based on a second order lowpass filter and a
voltage-controlled oscillator (VCO). Within these components, we find the damping factor � and oscillation
frequency that define the PLL response. Thus, the PLL sensitivity can be controlled changing these
parameters, such that the PLL achieves the desired performance [9].
For � < (under damped) the PLL has a faster response, but at the cost of oscillations. For � =
(critically damped) or � > (over damped), there is no oscillation, but the response time is slower
[9]. The proper damping factor value depends on the PLL application.
Fig. 8 shows DOA estimation for various damping factors as a function of the noise bandwidth ,
defined as = � � +
4� [7], with SNR fixed in 7dB for all cases. Hence, the greater value of �,
the lower the noise bandwidth.
Fig. 8: DOA estimation (�) for a BPSK signal with SNR = 7dB. The simulation changes the PLL noise bandwidth (Hz) for the cases: (a) � = . ; (b) � = . ; (c) � = .
Fig. 9 shows DOA estimation for three different SNR conditions, using a damping factor � = . .
We can observe that noisy signals need higher noise bandwidth.
Fig. 9: DOA estimation (�) for a BPSK signal with � = . . The simulation changes the PLL noise bandwidth (Hz) for the cases: (a) SNR = 5dB; (b) SNR = 7dB; (c) SNR= 10dB.
From the results of several experiments, it was observed that the configuration with larger and
over dumped � provides better PLL results for lower SNRs, regardless of ambiguity correction. Fig. 7
Brazilian Microwave and Optoelectronics Society-SBMO received 29 June 2017; for review 06 July 2017; accepted 11 Nov 2017
Brazilian Society of Electromagnetism-SBMag © 2017 SBMO/SBMag ISSN 2179-1074 Consider four signals with the following properties:
Signal 1 (signal of interest): � = 90°, � = 80°, SNR from 8 to 30dB;
Signal 2: � = 75°, � = 70°, SNR = 5dB;
Signal 3: � = 45°, � = 60°, SNR = 5dB;
Signal 4: � = 60°, � = 65°, SNR= 5dB.
Also consider these signals in two scenarios: 8 antennas array with four simultaneous BPSK
signals; and 16 antennas array with four simultaneous QPSK signals.
Fig. 10: DOA estimation for (a) azimuth and (b) zenith angles in a multipath scenario with 8 antennas and four BPSK signals.
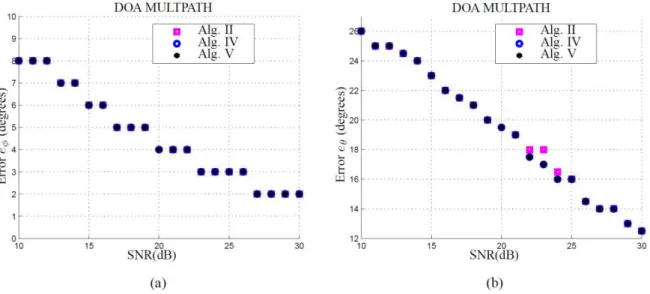
Fig. 11: DOA estimation for (a) azimuth and (b) zenith angles in a multipath scenario with 16 antennas and four QPSK signals.
Fig. 10 and Fig. 11 show azimuthal and zenithal error estimates for Signal 1 (signal of interest), for
Journal of Microwaves, Optoelectronics and Electromagnetic Applications, Vol. 16, No. 4, December 2017
DOI: http://dx.doi.org/10.1590/2179-10742017v16i4972
Brazilian Microwave and Optoelectronics Society-SBMO received 29 June 2017; for review 06 July 2017; accepted 11 Nov 2017
Brazilian Society of Electromagnetism-SBMag © 2017 SBMO/SBMag ISSN 2179-1074 995
1 that simulate multipath effects. Algorithm I is the first in the sequence of tests and it is shown in the
results under the others algorithms. All algorithms showed comparable performance. The main
advantage of Algorithm V is their applicability in different scenarios, keeping good performance for
multipath.
C. Interference Analysis
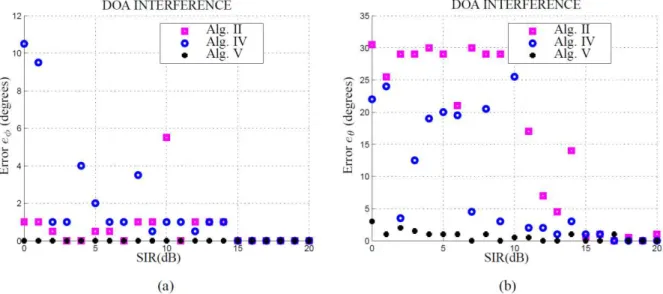
Fig. 12 shows azimuthal and zenithal estimate errors for a QPSK signal with � = 100°, � = 75°, and
SNR = 30dB, in a 16-antenna scenario, with an interfering QPSK signal with � = 90°, θ = 60°, and
signal-to-interference ratio (SIR) from 0 to 20dB. The proposed algorithm shows superior
performance to Algorithm II and IV. It presents comparable performance to Algorithms I, III and IV
for 8-antenna array systems. This analysis considers the average of 100 independent runs.
Fig. 12: DOA estimation for (a) azimuth and (b) zenith angles in an interference scenario with 16 antennas and two QPSK signals.
VI. CONCLUSION
This paper presents an improved version of a single receiver PLL-based algorithm for DOA
estimation. Its performance was compared to previous techniques in controlled scenarios, with
complex environmental conditions.
The proposed FFT Peak & Min Finder is more elaborate and robust than the initial release.
Modifications have been proposed that add more processing, but improve performance in more
aggressive situations such as scenarios with lower SNRs and interference.
The new approach computes azimuthal and zenithal angles for BPSK and QPSK signals, for 8
and 16-antenna arrays, keeping accuracy and low computational burden. It was the only one able to
Brazilian Microwave and Optoelectronics Society-SBMO received 29 June 2017; for review 06 July 2017; accepted 11 Nov 2017
Brazilian Society of Electromagnetism-SBMag © 2017 SBMO/SBMag ISSN 2179-1074 [1] J. J. Keaveny, “Analysis and implementation of a novel single-channel direction finding algorithm on a Software Radio Platform,” Master thesis of Virginia Polytechnic Institute and State University, Virginia, USA, February 2005.
[2] N. M. Harter, “Development of a novel single-channel direction finding algorithm,” Master thesis of Virginia Polytechnic Institute and State University, Virginia, USA, April 2007.
[3] H. T. Thanh and V. V. Yem, “High performance direction finding algorithm based on phase locked loop,” Journal on Electronics and Communications, vol. 4, pp. 1–2, January-June 2014.
[4] R. O. Schmidt, “Multiple emitter location and signal parameter estimation,” IEEE Trans. Antennas and Propagation, vol. AP-34, no. 3, pp. 276–280, October 1986.
[5] R. Roy and T. Kailath, “Esprit - estimation of signal parameters via rotational invariance techniques,” IEEE Trans. Acoustic, Speech, Signal Processing, vol. 37, no. 7, pp. 984–995, July 1989.
[6] A. G. T. Duarte, J. A. Apolina´rio Jr., and J. C. A. Santos, “An efficient single receiver high resolution DOA estimation algorithm for modulated signals,” IEEE International Microwave and Optoelectronic Conference, November 2015.
[7] W. H. Tranter, R. Thamvichai and T. Bose, Basic Simulation Models of Phase Tracking Devices Using MATLAB, 5th Ed.
Morgan & Claypool publishers, 2010.
[8] N. Harter, J. J. Keaveny, S. Venkatesh and R. M. Buehrer, “Analysis and implementation of a novel single-channel direction-finding method,” IEEE Communications Society/WCNC, vol. 4, May 2005.




![Fig. 8 shows DOA estimation for various damping factors as a function of the noise bandwidth , defined as = � � + 4� [7], with SNR fixed in 7dB for all cases](https://thumb-eu.123doks.com/thumbv2/123dok_br/18888254.424354/12.892.125.791.439.635/shows-estimation-various-damping-factors-function-bandwidth-defined.webp)
