ABSTRACT: In recent years, advances in aeronautical engineering ield include, among others, the development of increasingly lightweight and lexible materials, allowing better performance of systems in applications such as Unmanned Aerial Vehicles, photographic model airplanes, light weight aircraft etc. This progress, however, can cause dificulties in design and various types of tests, such as those performed in modal analysis, since the instrumentation weight and shape can inluence the behavior of very light and aerodynamic structures. This paper proposes a new technique to perform modal analysis in simple structures, eliminating the use of accelerometers, which must be numerous in this type of analysis and have signiicant weight; the whole structure can be analyzed at the same time, and this is an advantage in comparison with other techniques as vibrometer laser, that analyses one point at a time. The technique in question makes use of infrared imaging, detecting, through the heat, the structure deformation, allowing the trace of its modal shape. For this, a theoretical analysis and a thermomechanical modeling of a known structure are performed, with subsequent test to be validated, and inally the conclusions and suggestions for future work are presented.
KEYWORDS: Modal response, Infrared imaging, Thermomechanics.
Modal Shape Analysis Using Thermal Imaging
Jorge Henrique Bidinotto1, Eduardo Morgado Belo2
INTRODUCTION
Recent Engineering advances during the last years have included the development of new materials with the most diverse applications, emphasizing its best performance and improving the functioning of complete systems in the area of mechanical, electrical, aeronautical, and others.
Among the most common applications is the aircrat design, where the best performance depends on more lightweight and lexible materials that allow ease in manufacturing, increased payload and better aerodynamic performance.
The development of these materials, however, brings diiculties in design and implementation of structural tests due the inluence of the sensors on the material’s tested behavior.
An example is the setting of accelerometers for experimental modal analysis, which can greatly afect the behavior of low-weight structures, such as UAVs or model airplanes for photo applications, since this type of sensor includes in its structure a seismic mass, a piezoelectric crystal and a base, which carry weight to the set. An experimental modal analysis should ideally include multiple accelerometers on the same structure, increasing this problem or the test must be repeated with one accelerometer ixed in diferent positions, as performed by De
Marqui Jr. et al. (2007), increasing time and cost for the test.
his paper proposes a kind of modal analysis that provides the shape of each vibration mode based on infrared imaging. his proposal is based on the fact that the structure deformation generates internal stresses, resulting in local temperature increase, detectable by infrared cameras. he temperature variation is very small, requiring a highly accurate experimental apparatus, as described along the text.
For infrared technology research, Hudson Jr. (1969) provides the basic theory of infrared radiation and Holst (2003) explains
1.Universidade Federal de São Carlos – Centro de Ciências Exatas e de Tecnologia – Departamento de Engenharia Mecânica – São Carlos/SP – Brazil. 2.Universidade de São Paulo – Escola de Engenharia de São Carlos – Departamento de Engenharia Aeronáutica – São Carlos/SP – Brazil.
Author for correspondence: Jorge Henrique Bidinotto | UFSCar/CCET/DEMec | Rodovia Washington Luís, km 235 | CEP: 13.565-905 – São Carlos /SP – Brazil Email: [email protected]
Figure 1. Electromagnetic spectrum (Bidinotto et al., 2013).
Increasing energy
Increasing wavelength
0.0001 nm
0.01 nm 10 nm 1,000 nm
0.01 cm 1 cm 1 m 100 m
Gamma rays X-rays Infrared Radio waves
Radar TV FM AM
Visible light
400 nm 500nm 600nm 700nm
Ultra violet
W
= α
W
+ τ
W
+ ρ
W
α + τ + ρ = 1
(1)
(2) its use for imaging and as thermo sensor, while Wyatt (1987)
gives design concepts for devices for this purpose.
McShea (2010) shows aeronautical applications for infrared
imaging, while Cliton (1996) and Fisher et al. (2003) provide
applications speciically targeting the light tests.
Dehne et al. (2012), Fujino et al. (2003) and FLIR Systems
(2011, 2012a) show some applications of infrared imaging in the aircrat industry, mainly aimed at thermal comfort or aerodynamic transition from laminar low to turbulent.
he same themes are addressed, but in an academic way, in
the work of Malerba et al. (2008), Banks (2000) and Zuccher
et al. (2003). FLIR Systems (2012b) and Infrared Training Center (2008) provide information about the use and ideal conditions for application of infrared cameras for various purposes.
To analyze the material’s thermomechanic behavior, a study was conducted in three different fronts, given the multidisciplinary character of this phenomenon. he irst one was in Materials Science, where Guy (1976) and Van Vlack (1989) had a big importance. he second front of this study was in Mechanics of Materials, obtaining all the necessary
information in Beer et al. (2006). he third line of research was
in hermodynamics, where Schulz (2003) and Van Wylen and Sonntag (1986) provided the necessary information for the study.
Few articles were found in this area, none of them with similar
purpose. Razo et al. (1995) make an interesting thermomechanical
analysis of a speciic material, patented by a private company.
Other references, such as Lee et al. (1993) and Wedekind et
al. (2010), mention the study of thermomechanical behavior
focused on a mechanical manufacturing approach. Yang and Wang (2013) and Brinson (1993) address the issue from the perspective of intelligent materials such as shape memory alloys.
he paper presents the theoretical fundamentals on which this method is based in the following section. Theoretical Model section shows the structure used in this work and its modeling. Experimental Procedure section presents experiments conducted to validate the model with its respective results and some conclusions are presented on Conclusions section, followed by References.
THEORY
INFRARED TECHNOLOGY
Infrared images are generated by processing electro-optical radiation emitted by any object and captured by proper equipment called infrared cameras.
Infrared radiation means the part of the electromagnetic spectrum radiation (Fig. 1) with a wavelength between 0.8 and 1,000 microns and are divided into 3 categories: short infrared radiation (0.8 to 1.5 μm), medium (1.5 to 5.6 μm) and long (5.6 to 1,000 μm), as described by Holst (2003).
hermal radiation is generally in the region of medium infrared radiation (high temperatures) or long infrared radiation (low temperatures), and this diference in wavelength (and hence in the frequency) captured by the infrared camera is processed to generate the images based on radiation. Some important features of thermal radiation are:
• All objects emit thermal radiation.
• It does not require a material environment to occur,
so radiation can cross vacuum.
• It easily crosses most gases.
• Normally, it is not able to cross liquids or solids.
In addition to emission an object reacts to the incident radiation environment, absorbing and relecting a part of it, or allowing a small amount of radiation to cross (such
as through a lens). he law of total radiation (W) is derived
from this physical principle and can be determined by the following equation:
where:
he coeicients α, ρ, and τ describe the absorption of incident
ρ +
ε
= 1E
=hv
u(v,T)
=4π
/c . I(v,T)
=(
8π
hv
3/c
3) .
1/(e
hv/kT-
1)
ε
=W
obj/
W
bbW
=σT
4(3)
(5)
(7)
(6) (4)
0 500 1,000 1,500 2,000
(a)
(b)
B
lack
b
o
dy r
adi
at
io
n in
te
ns
it
y T=5,500K
T=5,000K
T=4,500K
T=4,000K
T=3,500K
S
p
ec
tr
al irr
adi
anc
e
W/(m
2nm) 2.0
1.6
1.2
0.8
0.4
0.0
0 500 1000 1500 2000
Wavelength (nm)
λ (nm)
Extraterrestial solar spectral irradiance, Total area: 1,367 W/m2
Blackbody spectrum for
T=5,777K, Total area 1367 W/m2
Each coeicient may have a value between 0 and 1, depending on the way the object absorbs, relects or transmits the incident
radiation. For example, if ρ = 0, τ = 0 and α = 1, then there is
no energy relected or transmitted and 100% of the incident radiation is absorbed. That is called a perfect blackbody (Hudson Jr., 1969).
Holst (2003) describes mathematically the behavior of bodies with respect to heat using the Kirchhof ’s law. he properties
related to the energy irradiation are denoted by the symbol ε,
called emissivity of the body. Kirchhof ’s law provides that α = ε,
either, as both depend on the wavelength, α(λ) = ε(λ). Equation 2
in the case of opaque bodies (τ = 0) can be simpliied by:
In the case of the black body ρ = 0 and has therefore ε = 1.
he same reference shows the Planck’s law given by Eq. (4), that describes the amount of energy radiated by a black body in
thermal equilibrium as function of speed of light (c), Boltzmann
constant (k) and temperature (T, in kelvin) and was formulated
in 1900 with empirically determined constant. Planck accurately described the blackbody radiation (Fig. 2a), suggesting that electromagnetic radiation was emitted in quanta (Wyatt, 1987). he Sun is an excellent approximation of a black body (Fig. 2b).
where:
u: amount of energy radiated; I: spectral radiance; h: Planck
constant.
Planck assumed that the energy of these oscillations is limited to
integer multiples of the fundamental energy E and proportional to
the oscillation frequency v as in Eq. 5. He assumed that quantization
theory ive years ater Albert Einstein have suggested the existence of photons to explain the phenomenon of photoelectric efect.
From Planck’s law, the total energy radiated from a blackbody can be calculated. his is expressed by the Stefan-Bolzmann’s law:
Figure 2. (a) Blackbody radiation and (b) its approximation
to the solar irradiance (Bidinotto et al., 2013).
he properties of radioactive objects are generally described in relation to a perfect blackbody. If the energy emitted from
a blackbody is denoted as Wbb, and the one of an ordinary
object at the same temperature, as Wobj, the relationship
between these two values describes the emissivity (ε) of the
object, as in Eq. 7.
Consequently, the emissivity is a number between 0 and 1. he better the radioactive properties of the object, the higher its emissivity. An object that has the same emissivity for all wavelengths is called a grey body.
The current infrared cameras can transform the radi-ation emitted by an object to an image. The infrared radiation is emitted by all objects with a temperature above absolute 0 (0 kelvin) and has similar characteristics to the radiation as a visual reflection, refraction and transmission. The higher the temperature of the body, the greater the radiated energy.
where:
(8)
(a) (b)
(9)
(10)
P: shear force; L: lenght of the beam.
For this reason, the principle of operation of an infrared camera is similar to a light visible wavelength camera. It has a lens which focuses the radiation onto the detector and a set of electronic hardware and sotware that processes and samples the generated signals and images.
herefore, thermography allows one to make temperature measurements of an object without physical contact. Infrared detectors from modern cameras are composed by a Focal Plane Array (FPA) of various materials sensitive to speciic wavelength. he sensor resolution array can vary from about 160 × 120 pixels to 1,024 × 1,024 pixels. Depending on the size and resolution of the detectors array, it can contain more than 60,000 to 1 million of individual detectors.
THERMOMECHANICAL MODELING
Deformation in materials generates energy dispersion as heat (Guy, 1976). Van Vlack (1989) is consistent with this explanation and adds that when a stress is applied to a material deforming elastically, and then removed, the energy involved in this deformation is dispersed mostly in the form of heat, generating a local temperature increase, which soon is transferred to environment.
In order to quantify this temperature increase, a study was performed to create a numerical model and predict the rise in temperature in each section of the structure when a load is applied.
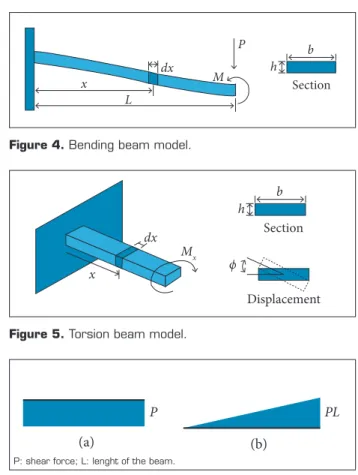
In the present paper, the structure analyzed is modeled as a cantilever beam subject to a bending force, a momentum and torque, as shown in Fig. 3, following the energy method
described by Beer et al. (2006).
For simplification, the bending load effect (P and M)
represented by Fig. 4 is studied separately from the torsion
(Mx) showed by Fig. 5.
Following this method, the energy obtained in deformation
is a sum of two parts: the strain energy of normal stress (Uσ)
and the energy of shear stress (Uτ), which will be equated using
the shear and momentum diagrams shown in Fig. 6.
Normal stress has the strain energy given by (Beer et al., 2006):
Bending
Torsion
z y
M Mx
Mx
P P
M
x
Figure 3. Simpliied model for the studied structure.
Figure 5. Torsion beam model.
dx x
L
M P
h b
Section
P PL
Displacement
h
x
dx Mx
ϕ b
Section
Figure 4. Bending beam model.
Figure 6. Shear force (a) and momentum (b) diagrams from
the structure.
For shear stress,
where:
G: modulus of transversal elasticity.
Solving the integrals and converting the forces to stress
using the equations described by Beer et al. (2006), the sum of
(11)
(17)
(12)
(13)
(14)
(15)
(18) (16)
∫
δQ =∫
δW∫
δW = U =
∫
ρ
(
hbdx)c T
б
∆T
h= σ
2[3.563 x
10
-17x
–2+ 3.242 x 10
-21]
Using the same method, it was made the beam equationing subjected to torsion stress, schematized in Fig. 6 and modeled by Eq. 11.
τ
M
x
M
x
Figure 7. Shear stress applied to element dx.
Analyzing dx element, one can evaluate the presence of a
shear stress τ as shown in Fig. 7.
And, for this case, the shear stress can be represented by:
Substituting Eq. 12 in Eq. 11 and integrating it, one reaches:
For a closed system, it can be used the First Law of hermodynamics, which states that the cyclic integral of heat is equal to the cyclic integral of work (Van Wylen and Sonntag, 1986), reaching:
Considering that thermal energy results in temperature increasing and, as stated by the Law of Conservation of Energy (Schulz, 2003), all the energy involved in bending and torsional
stress (U) are converted to work (W), Eq. 15 can be written:
Substituting Eqs. 10 and 13 in Eq. 15, one has for bending:
and for torsion:
THEORETICAL MODEL
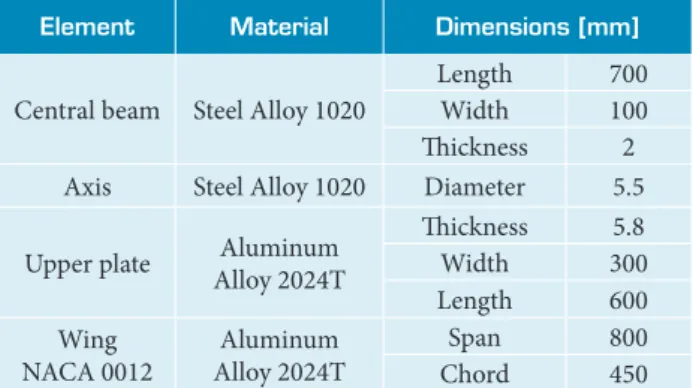
For this study, a set composed by a rigid wing ixed to a lexible support was used, which will be used in a complementary future work. he structure is shown in Fig. 8 and its details are described in Table 1.
Element Material Dimensions [mm]
Central beam Steel Alloy 1020
Length 700
Width 100
hickness 2 Axis Steel Alloy 1020 Diameter 5.5
Upper plate Aluminum Alloy 2024T
hickness 5.8
Width 300
Length 600 Wing
NACA 0012
Aluminum Alloy 2024T
Span 800
Chord 450
Figure 8. Images presenting the set used in this study.
Table 1. Structure’s properties.
Upper plate Wing
Axis Central
beam
Applying the structure properties in Eqs. 16 and 17, equations to predict the expected increase of temperature (in degrees Celsius) when a given load is applied can be obtained. he equations found are as follows:
For torsion:
For analysis, a Finite Element Model was raised using the MSC Patran 2010 sotware and the irst two vibration modes were obtained solving the modal analysis in MSC Nastran 2010 sotware. he results are presented in Fig. 9.
Knowing the shape and frequency of the irst two vibration modes, a new simulation by the Finite Element Method was carried out, statically loading the structure in order to deform it in bending and in torsion, similar to the deformation applied in the experiment explained in the next section, considering that the only part of interest in the structure is the support central beam. his simulation is intended to take a spectrum that gives the stress at each point of the structure, in order to complete the thermomechanical modeling. Figure 10 shows the position of the applied deformation in each case: 35 mm in bending case, 15 mm in torsion case, both in static conditions.
Figure 11 shows the simulation results for stress using the Von Misses criteria. he numerical results are presented in Pascal. Combining the result of simulation with Eqs. 18 and 19 obtained in thermomechanical modeling, it is possible to create the spectrum of temperature rise at each point of the structure shown in Fig. 12. he numerical results are presented in degrees Celsius.
2.80-001 2.61-001 2.42-001 2.24-001 2.05-001 1.86-001 1.68-001 1.49-001 1.30-001 1.12-001 9.32-002 7.46-002 5.59-002 3.73-002 1.86-002 0. 6.31-001 5.89-001 5.47-001 5.05-001 4.63-001 4.21-001 3.79-001 3.37-001 2.95-001 2.53-001 2.10-001 1.68-001 1.26-001 8.42-002 4.21-002 0. 8.89-007 8.30-007 7.71+007 7.11+007 6.52+007 5.93+007 5.33+007 4.74+007 4.15+007 3.56+007 2.96+007 2.37+007 1.78+007 1.19+007 5.93+006 4.15+003 3.63+007 3.39+007 3.15+007 2.91+007 2.66+007 2.42+007 2.18+007 1.94+007 1.70+007 1.45+007 1.21+007 9.69+006 7.27+006 4.85+006 2.42+006 1.44+003
5.92-001No Data 5.34-001 4.92-001 4.48-001 4.04-001 3.59-001 3.13-001 2.68-001 2.23-001 1.78-001 1.35-001 9.48-002 5.90-002 2.92-002 8.08-003 0 1.49+000 1.30+000 1.12+000 9.56-001 7.99-001 6.61-001 5.37-001 4.25-001 3.26-001 2.37-001 1.65-001 1.06-001 5.97-002 2.66-002 6.61-003 0
Figure 9. First (a) and second (b) vibration modes.
Figure 11. Simulation results for bending (a) and torsion (b).
Figure 10. Load position in simulation for bending (a) and
torsion (b).
Figure 12. Temperature raise spectrum for bending (a) and
torsion (b).
EXPERIMENTAL PROCEDURE
For validation of thermomechanical model, a test for obtaining the first and second vibration mode shapes was performed with the aid of infrared imaging, in order to compare them with those obtained by the model.
In this case, the structure was excited at natural frequencies, for better characterization and the mode shapes be captured by the infrared camera. For this reason, it was chosen the excitation by shaker at the same points and displacements used in the model (Fig. 10) obtaining its frequencies by an accelerometer ixed in the end of the driver, in order to accurate the sinusoidal excitation method. hus, the structure sufered deformations per cycle of vibration and the infrared camera could capture small changes in temperature along the central beam at each movement occurred.
he test was performed with the experimental coniguration shown in Fig. 13.
For the test, environment was conditioned at 18°C, the structure was painted matt black, and it was positioned, behind the structure, one plate at a considerably higher temperature than the structure in order to improve the contrast in images. (19)
∆T
θ
=
1.129 x
10
-15
τ
2Figure 14. Test performance.
Figure 15. Infrared images from the structure loaded in
bending (a) and torsion (b) at its maximum delection point.
Figure 17. Comparative results obtained in torsion case from
model (a), gross data (b) and processed experimental data (c).
Figure 16. Comparative results obtained in bending case from
model (a), gross data (b) and processed experimental data (c). 22.0oC
22.0oC
20.0 20.0
Sp6 21.7 Sp6 21.5 Sp8 20.8
Sp5 21.0
Sp3 20.6 Sp4 20.5
Sp1 21.2
Sp2 21.4 Sp7 21.0 Sp5 21.4
Sp4 21.2
Sp3 21.4
Sp2 21.5
Sp1 21.8
5.92-001No Data 5.34-001 4.92-001 4.48-001 4.04-001 3.59-001 3.13-001 2.68-001 2.23-001 1.78-001 1.35-001 9.48-002 5.90-002 2.92-002 8.09-003 0.
22.0oC
20.0
Sp6 21.7
Sp5 21.4
Sp4 21.2
Sp3 21.4
Sp2 21.5
Sp1 21.8
21.9 21.8 21.7 21.6 21.5 21.4 21.3 21.2 21.1 21 20.9
20.0
1.49-000 1.30-000 1.12-000 9.56-001 7.99-001 6.61-001 5.37-001 4.25-001 3.26-001 2.37-001 1.65-001 1.06-001 5.97-002 2.66-002 6.61-003 0.
22.0oC
Sp6 21.5
Sp5 21.0
Sp4 20.5
Sp3 20.6
Sp2 21.4 Sp1 21.2
Sp8 20.8
Sp7 21.0
21.5 21.4 21.3 21.2 21.1 21 20.9 20.8 20.7 20.6 20.5
bending. All numerical results are presented in degrees Celsius for Figs. 16 and 17. Similarly, results in torsion are shown in Fig. 17.
(1) Set wind/support ixed on ground; (2) Accelerometer PCB Piezotronics type 288D01 (Measurement range: ± 50 g; Sensitivity: 100 mV/g; Resonant frequency: > 20 kHz); (3) Shaker MB Dynamics Modal 50 (Range: 1 to 4,000 Hz; Maximum load: 220 N); (4) Signal analyzer LMS (Model: SCADA – SCM 0; 24 channels); (5) Signal Ampliier MB Dynamics (Model: SL500VCF); (6) Infrared Camera model FLIR E40 (Resolution: 160 x 120 pixels; Measurement range: -20 to 650°C; Thermal sensibility: < 0.07°C); (7) Laptop for data acquisition.
Figure 13. Experimental apparatus used in the test.
(a)
(a)
(a)
(b)
(b)
(c)
(c) (b)
Figure 14 shows images of the experimental apparatus used. Test results are shown in Fig. 15, which presents the structure on its maximum delection during bending (a) and torsion (b).
For image analysis, a sotware feature was used, which
provides a Microsot® Excel table, where each pixel from the
image generates a table cell, with the value of the temperature on that pixel. With this tool, pixels corresponding to the central bar structure were isolated and, using a routine in MATLAB, the data were iltered and plotted on a color chart for better characterization of the bar regions according to their temperature.
For a better visualization of the results predicted by the model, the gross experimental results and the experimental results ater processing of data, Fig. 16 was generated, which shows the three plots side by side for direct comparison in
1
6
7
3
2
5 4
CONCLUSIONS
REFERENCES
Banks, D.W., 2000, “Visualization of In-Flight Flow Phenomena Using Infrared Thermography”, NASA TM-2000-209027.
Beer, F.P., Johnston Jr., E.R. and DeWolf, J.T., 2006, “Mechanics of Materials”, 4th edition, McGraw-Hill, New York, USA.
Bidinotto, J.H., Kleinubing, M., Catalano, F.M. and Belo, E.M., 2013, “Thermography Applied on Boundary Layer Transition Visualization”, Proceedings of the International Congress of Mechanical Engineering, COBEM, Ribeirão Preto, Brazil.
Brinson, L.C., 1993, “One-Dimensional Constitutive Behavior of Shape Memory Alloys: Thermomechanical Derivations with Non-Constant Material Functions and Redeined Martensite Internal Variable”, Journal of Intelligent Material Systems and Structures, Vol. 4, No. 2, pp. 229-242. doi: 10.1177/1045389X9300400213
Clifton, J.M., 1996, “Introduction to Avionics Flight Test”, Vol. 15, AGARDograph, London, UK.
De Marqui Jr., C., Rebolho, D., Belo, E.M., Marques, F.D. and Tsunaki, R.H., 2007, “Design of an Experimental Flutter Mount System”, Journal of the Brazilian Society of Mechanical Sciences and Engineering, Vol. 29, No. 3, pp. 246-252. doi: 10.1590/S1678-58782007000300003
Dehne, T., Bosbach, J. and Heider, A., 2012, “Dynamics of Aircraft Cabin Ventilation by In-light Infrared Thermography”, Proceedings of the 11th International Conference on Quantitative InfraRed Thermography, QIRT, Naples, Italy.
Fisher, D., Horstmann, K.H. and Riedel, H., 2003, “Flight Test Measurement Techniques for Laminar Flow”, Vol. 23, AGARDograph, London, UK.
FLIR Systems, 2011, “Application Story – DLR Dornier 228”, Catalogue, FLIR Systems Co. Ltd., Hong Kong, China.
FLIR Systems, 2012a, “Application Story – Dassault Falcon 7X”, FLIR Advanced Thermal Solutions, France.
FLIR Systems, 2012b, “The Ultimate Infrared Handbook for R&D Professionals”, FLIR Systems AB, Sweden.
Fujino, M., Yoshizaki, Y. and Kawamura, Y., 2003, “Natural-Laminar-Flow Airfoil Development for a Lightweight Business Jet”, Journal of Aircraft, Vol. 40, No. 4, pp. 609-615. doi: 10.2514/2.3145
Guy, A.G., 1976, “Essentials of Materials Science”, McGraw-Hill, New York, USA.
Holst, G.C., 2003, “Electro-optical Imaging System Performance”, 3rd edition, JCD Publishing, Oviedo, USA.
Hudson Jr., R.D., 1969, “Infrared System Engineering”, John Wiley & Sons, New York, USA.
Infrared Training Center, 2008, “Termograia Nível 1 – Training course material”, ITC, Sorocaba, Brazil.
Lee, H.T., Chen, J.C. and Wang, J.M., 1993, “Thermomechanical Behaviour of Metals in Cycling Loading”, Journal of Materials Science, Vol. 28, No. 20, pp. 5500-5507. doi: 10.1007/BF00367821
Malerba, M., Argento, M., Salviuolo, A. and Rossi, G.L., 2008, “A Boundary Layer Inspection on a Wing Proile Through High Resolution Thermography and Numerical Methods”, WSEAS Transactions on Fluid Mechanics, Vol. 3, No. 1, pp. 18-28.
McShea, R.E., 2010, “Test and Evaluation of Aircraft Avionics and Weapon Systems”, SciTech Publishing, Inc., Raleigh, USA.
Razo, L.M., Solis, S., Asomoza, M. and Hernandez, A., 1995, “Establishment of Thermodynamic Properties of Pure Solid Substances by Thermomechanical Analysis”, Journal of Thermal Analysis, Vol. 45, No. 6, pp. 1323-1330. doi: 10.1007/BF02547426
Schulz, H.E., 2003, “O Essencial em Fenômenos de Transporte” (in Portuguese), EESC-USP, São Carlos, Brazil.
Van Vlack, L.H., 1989, “Elements of Material Science and Engineering”, 6th edition, Prentice-Hall, New Jersey, USA.
Van Wylen, G.J. and Sonntag, R.E., 1986, “Fundamentals of Classical Thermodynamics”, 3rd edition, John Wiley & Sons, New York, USA.
Wedekind, M., Both, J. and Baier, H., 2010, “Thermo Mechanical Behaviour of Metal Matrix Composite Structure”, International Journal of Material Forming, Vol. 3, No. 1, pp. 857-860.
Wyatt, C.L., 1987, “Radiometric System Design”, Macmillan Publishing Co., New York, USA.
Yang, H. and Wang, L.Y., 2013, “Thermomecanical Analysis of Shape-Memory Composite Tape Spring”, Applied Composite Materials, Vol. 20, No. 3, pp. 287-301. doi: 10.1007/s10443-012-9271-x
Zuccher, S., Saric, W.S., Reed, H.L. and McNeil, L.R., 2003, “The Role of Infrared Thermography in the Study of Crosslow Instability at M=2.4”, Proceedings of the 7th International Symposium on Fluid Control, Measurement and Visualization, FLUCOME, Sorrento, Italy.
since the ambient temperature during test was considerably lower than that of the frame (18°C), which may have caused a loss of heat from the bar, decreasing its temperature more markedly in its warmer regions.
These tests also showed some limitations in using this infrared camera model: low resolution and low speed in frames capture. Such problems can be solved using a camera with higher resolution and higher frequency. In future trials, one should consider obtaining such equipment.
For future work, some innovations are already planned:
• he acquisition of a new camera, with more precision
and better resolution, in order to give better images.
• Improving the test precision and studying its limitations,
such as the complexity of the studied structure and its excitation frequency.
• Development of a subroutine in MATLAB to provide a