www.atmos-chem-phys.net/15/6913/2015/ doi:10.5194/acp-15-6913-2015
© Author(s) 2015. CC Attribution 3.0 License.
Perturbations of the optical properties of mineral dust particles by
mixing with black carbon: a numerical simulation study
B. V. Scarnato1, S. China2, K. Nielsen1, and C. Mazzoleni2
1Naval Postgraduate School, 589 Dyer Road, Root Hall, Monterey, CA 93943-5114, USA
2Michigan Technological University, Department of Physics and Atmospheric Sciences Program, 1400 Townsend Drive,
Houghton, MI 49931, USA
Correspondence to:B. V. Scarnato ([email protected])
Received: 05 December 2014 – Published in Atmos. Chem. Phys. Discuss.: 27 January 2015 Revised: 10 May 2015 – Accepted: 24 May 2015 – Published: 25 June 2015
Abstract. Field observations show that individual aerosol particles are a complex mixture of a wide variety of species, reflecting different sources and physico-chemical transfor-mations. The impacts of individual aerosol morphology and mixing characteristics on the Earth system are not yet fully understood. Here we present a sensitivity study on climate-relevant aerosols optical properties to various approxima-tions. Based on aerosol samples collected in various ge-ographical locations, we have observationally constrained size, morphology and mixing, and accordingly simulated, us-ing the discrete dipole approximation model (DDSCAT), op-tical properties of three aerosols types: (1) bare black carbon (BC) aggregates, (2) bare mineral dust, and (3) an internal mixture of a BC aggregate laying on top of a mineral dust particle, also referred to as polluted dust.
DDSCAT predicts optical properties and their spectral de-pendence consistently with observations for all the studied cases. Predicted values of mass absorption, scattering and ex-tinction coefficients (MAC, MSC, MEC) for bare BC show a weak dependence on the BC aggregate size, while the asym-metry parameter (g) shows the opposite behavior. The sim-ulated optical properties of bare mineral dust present a large variability depending on the modeled dust shape, confirming the limited range of applicability of spheroids over different types and size of mineral dust aerosols, in agreement with previous modeling studies. The polluted dust cases show a strong decrease in MAC values with the increase in dust par-ticle size (for the same BC size) and an increase of the single scattering albedo (SSA). Furthermore, particles with a radius between 180 and 300 nm are characterized by a decrease in
SSA values compared to bare dust, in agreement with field observations.
This paper demonstrates that observationally constrained DDSCAT simulations allow one to better understand the variability of the measured aerosol optical properties in am-bient air and to define benchmark biases due to different ap-proximations in aerosol parametrization.
1 Introduction
Black carbon (BC), a distinct type of carbonaceous aerosol particle, is produced by incomplete combustion of fossil and biomass fuels. BC is a strong light absorber and therefore can contribute to atmospheric warming and surface dimming. Es-timates of direct BC radiative forcing (DRF) are highly un-certain and range from 0.2 to 1.2 W m−2 at the top of the
ab-sorption, the aerosol absorption optical depth (AAOD), is generally underestimated by models compared to values re-trieved by AERONET (Bond et al., 2013; Koch et al., 2009; Kim et al., 2008; Klingmüller et al., 2014). The sources of discrepancy are not well understood. In order to estimate BC DRF “consistently” with observations, scaling factors on the order of 2–3 need to be introduced to BC emission estimates to match observed AAOD values.
In Koch et al. (2009) BC predictions from the AeroCom model inter-comparison project showed a low model bias for AAOD, but an overestimation of surface and upper BC concentrations at lower latitudes. The authors suggest that most models are underestimating BC absorption and recom-mend to work on improving estimates of refractive indices, particle size, and optical effects of BC mixing. Many trans-port models assume BC to be externally mixed with other aerosol compounds, while few models assume that BC is ho-mogeneously internally mixed with other aerosol compounds (Bond and Bergstrom, 2006; Koch et al., 2009). Differences in the representation of the aerosol mixing (i.e., BC with non-absorbing aerosols) lead to different absorption values, which compared to measurements are too small in the case of external mixing and too high for the case of homogeneous in-ternal mixing. Less often an encapsulation of a spherical and homogeneous absorbing core surrounded by a spherical and homogeneous non-absorbing host material is adopted (core-shell configuration), which gives more realistic magnitudes of absorption (Jacobson, 2014, 2001).
Despite that, the core-shell configuration cannot always represent the absorption variability in the laboratory and field observations (Adachi et al., 2010; Bueno et al., 2011; Bond et al., 2013; Cappa et al., 2012b, a). The latter might be due to the miss-representation of the BC particle aggregation and mixing, as shown by more detailed light scattering model-ing studies performed by Kahnert (2010b), Scarnato et al. (2013) and Adachi and Buseck (2013). Recent studies show that internal mixing of BC with other aerosol materials in the atmosphere can alter its aggregate shape (Zhang et al., 2008; Xue et al., 2009; Cross et al., 2010; China et al., 2013), ab-sorption of solar radiation (Bueno et al., 2011; Cappa et al., 2012b), and radiative forcing (Adachi et al., 2010; Kahn-ert et al., 2012). China et al. (2014), furthermore, charac-terized the predominant mixing and morphology types ob-served with the electron microscopes from samples collected in different locations and for different sources (i.e., biomass burning aerosol and vehicle exhaust) by classifying BC into four main classes (bare BC, inclusions, thinly coated and em-bedded BC); similar classes where identified by Scarnato et al. (2013) for laboratory-generated mixtures of BC and sodium chloride (an aerosol mixture resembling dirty marine aerosol).
Several field campaigns have been showing the occurrence of internal mixing of BC with dust aerosols in the accumu-lation mode (e.g., Clarke et al., 2004; Liu et al., 2008). Dur-ing transport and agDur-ing in the atmosphere, various processes
can result in the formation of multi-component aerosols con-taining dust, including (i) heterogeneous chemistry, (ii) ad-sorption of water vapor on dust particle surfaces, (iii) cloud processing, and (iv) coagulation of dust with other aerosol or cloud particles (see Usher et al., 2003). On a global scale, bare dust is estimated to cool Earth’s atmosphere. Mineral dust TOA DRF constitutes, as BC aerosols, one of the ma-jor uncertainties in climate studies (−0.6 to 0.4 W m−2) due to the lack of knowledge of both dust spatial distribution and interaction with EMWs. Parametrization of mineral dust optical properties is also a complex problem, as its opti-cal properties are a strong function of (i) the relative abun-dance of various minerals, (ii) how the minerals are mixed together in an aerosol particle, and (iii) the particle shape. Those factors depend on dust origins and, therefore, on the elemental composition of surface soils but also on the dust lifting production mechanism and dust chemical and phys-ical transformations (i.e., compositional separation) during aging and transport in the atmosphere. Many field studies reported changes in composition during dust transport (i.e., Prospero et al., 1981; Chester et al., 1972; Hansell Jr. et al., 2011; Nousiainen, 2009). Observations from the ground and from aircraft over the Sahara show considerable variation and uncertainty in the optical properties of mineral dust (Mc-Connell et al., 2010; Sokolik and Toon, 1999). The large variability is attributed to the mineral dust particles’ vari-ability in size distributions, chemical composition and mor-phology. Furthermore, different modeling studies on light interaction with mineral dust aerosol show (i) the limited range of applicability, over different types of mineral dust aerosols, of commonly used shapes such as spheres (adopted in Mie computations) and spheroids (adopted in T-matrix computations and in AERONET retrieval) (Merikallio et al., 2011), (ii) the inability of Mie simulations to accurately re-produce the magnitude and wavelength peak positions of the mass absorption/extinction coefficients common for angu-larly shaped particles (as shown by Hansell Jr. et al. (2011) in the infrared region), and (iii) the effect of non-spherical dust particles on the total RF (radiative forcing) is 55/5 % (ocean/land) at the TOA and 15 % at the bottom of the atmo-sphere (BOA) for both land and ocean, while local radiative heating within a dust plume causes enhancements of 20 % of RF (Otto et al., 2011).
Internal mixing of mineral dust and BC aggregates has a strong impact on the optical properties of originally exter-nally mixed aerosol, on their radiative forcing (Mishra et al., 2012; Sokolik et al., 2001) and on spatial and temporal distri-bution of precipitations, for example during the monsoon in Asia (Lau and Kim, 2006) or the African jet streams (Reale et al., 2011).
2013; Kahnert, 2010b) but also aerosol–cloud interactions, visibility and precipitation forecasts (Lau and Kim, 2006) and, furthermore, remote sensing of atmosphere and ocean color (Russell and Heintzenburg, 2000; Durkee et al., 2000; Yoshida et al., 2013).
For example, retrievals of aerosol (and ocean) properties require the assumption of (1) the scattering phase function, (2) single scattering albedo (SSA), (3) estimates of ozone absorption and molecular scattering, and (4) for satellite ap-plications, estimates of surface reflectance/albedo. Both or-bital and ground-based remote sensing techniques use a pre-selected library of aerosol types in the analysis of radiometric data. The computations of optical properties for the library often make use of spherical shape assumptions. The assump-tions of the mineral dust particles’ shape may vary in the retrieval algorithms. AERONET retrieval assumes mineral dust particles to be spheroidal (Dubovik et al., 2006), while MISR (Multi-angle Imaging SpectroRadiometer) retrievals (version 16+) use spheroidal, grains, plates and spherical shapes (Kalashnikova et al., 2013). The retrieval algorithms select an aerosol type based on the best fit to radiance mea-surements (i.e., Deuze et al., 2001; Hasekamp et al., 2011).
The capability of the satellite and AERONET aerosol global network to provide spatiotemporal distributions of both dust and BC at different spatial scales relies on how well the aerosol library used in the retrieval “fits” the aerosol mixture in the atmosphere; therefore, it is dependent on the accuracy of the retrieval assumptions on dust and BC optical properties. Therefore, non-sphericity and chemical anisotropy of the particles are sources of potential inaccu-racy and biases of data products. These inaccuracies may af-fect the retrieval of aerosol characteristics, such as refrac-tive index, size, aerosol optical depth, aerosol absorption op-tical depth, etc. (e.g., Scarnato et al., 2013, and references therein).
In this paper we present an “observationally constrained” sensitivity study of the optical properties of BC aggregates internally mixed with mineral dust aerosols in the UV– IR spectral range (computationally intensive). The spectral range used in this study is of interest for applications in cli-mate modeling, remote sensing of aerosol and ocean proper-ties, and visibility forecast. Computations are performed us-ing the discrete dipole approximation (DDA – DDSCAT7.3) (Draine and Flatau, 1994), a technique for modeling particles with complex shape, chains and aggregates with anisotropic mixing. DDSCAT is based on the direct solution of the Maxwell equations without reference to the wave equation, which is usually used in the treatment of light scattering by simple shapes, such as sphere and spheroids. Synthetic particle design for the DDSCAT calculations is based upon single-particle electron microscopy of bare BC, bare dust and BC dust (internally mixed particles of BC on the surface of a dust particle collected in the atmosphere from different loca-tions of the globe).
2 Method
2.1 Description of the synthetic particles 2.1.1 Black carbon aggregates
We generate synthetic BC aggregates by aggregation of monomers in random walk (Richard and Davis, 2008; Richard et al., 2011). The synthetic BC aggregates are char-acterized by a volume equivalent radius (aeffalso defined as
the radius of a sphere containing all the volume of the par-ticle) between 82 and 144 nm, a constant monomer diame-ter of 40 nm and an open-chain-like structure. Such values have been observationally constrained after processing elec-tron microscope images of several aerosol samples collected in field campaigns carried out in different geographical lo-cations – such as California’s Sacramento Valley (CARES); Pico Island, Azores (PICO); Mexico City, Mexico (MILA-GRO); and Detling, England (ClearfLo) – where internal mixture of BC and mineral dust have been observed.
The reader should be aware that the morphological charac-terization of the ambient aerosol is determined by processing 2-D electron microscope images on aerosol particles laying on a substrate and assuming orientational anisotropy over a statistically representative sample. Therefore, as aminor sec-ondary aspect of the paper, we investigated the appropriate-ness of the standard method adopted in literature to estimate a morphological descriptor, such as the monomer number of BC aggregates by performing image processing of 2-D pro-jections ofsyntheticBC fractal aggregates. Image processing of synthetic BC fractal aggregates allowed, as well, assur-ing that the synthetic particles have similar 2-D properties to those collected in the atmosphere.
In this paper, we describe the BC aggregate morphology and chain-like structure in terms of (1) fractal dimension, porosity (Shen et al., 2008; Scarnato et al., 2013) and con-vexity (as descriptors of the chain topology), (2) aspect ratio, and (3) roundness.
BC particles can be represented as fractals, where each particle is described as an aggregate with monomers of the same size, approximately obeying the following scaling law
Ni=k0(Rg/rm)Df, (1)
where N is the number of monomers per aggregate with i=(estimated, true),Rgis the radius of gyration,rmis the
monomer radius,k0is the fractal prefactor, here used a value
ofk0=1.6 (Liu et al., 2008), andDfis the mass fractal
dimen-sion.
Rg is the root-mean-square distance from the center of
each monomer to the aggregate center of mass. As often it is difficult to measureNtruefrom 2-D projections, for particles
withDf<2,Ntrue is typically estimated as the ratio of the
Table 1. Characteristics of the modeled aerosol particles. Dust particles have an aspect ratio for all three axes (AR) of 1.75 in all cases (oblate). The optical properties of dust, BC and mixtures were averaged over 1000 random orientations.
Aerosol Type Legend Target shape in study aeff[nm]
Dust S1, E1 Rectangular prism, Ellipsoid 180 S2, E2 Rectangular prism, Ellipsoid 280 S3, E3 Rectangular prism, Ellipsoid 500 S4, E4 Rectangular prism, Ellipsoid 700 S5, E5 Rectangular prism, Ellipsoid 1000
Black carbon BL1 BC aggregate with 70 monomers 80 BL2 BC aggregate with 100 monomers 100 BL3 BC aggregate with 200 monomers 120 BL4 BC aggregate with 300 monomers 140
Mineral dust and BC BL2S1 Rectangular prism mixed w BC (BL2+S1) 190 BL2S2 Rectangular prism mixed w BC (BL2+S2) 290 BL2S3 Rectangular prism mixed w BC (BL2+S3) 503 BL2S5 Rectangular prism mixed w BC (BL2+S5) 1010
area of a monomer (Ap) in the aggregate (Oh and Sorensen,
1997; Samson et al., 1987).
Ni=Ka(Aa/Ap)α, (2)
whereα is an empirical projected area exponent and has a typical value of 1.09, whilekahas a value of 1.15. The
sen-sitivity of Ni to the values ofαandka has been discussed
previously (China et al., 2014).
The aspect ratio (AR) of the fractal aggregate, is defined as the ratio of the major axis (A) to the minor axis (B). Larger values of the aspect ratio indicate a more elongated particle. AR=A
B (3)
The roundness of a fractal aggregate, is defined as the ratio of the projected area (Aa) of the particle to the area of a circle with a diameter equal to the maximum length (Lmax) of the
particle.
Roundness= 4Aa
π L2max (4)
The chain-like structure has been characterized in terms of convexity, porosity and fractal dimension (see Eq. 1). The convexity (C; also known as solidity) is defined as the ratio of the Aa of the particle to the area of the smallest convex
polygon in which the particle is inscribed (convex hull poly-gon – CHP). The polypoly-gon is calculated based on the bound-ary enclosing the foreground pixels of a binbound-ary image using straight-line segments to each outermost point.
C= Aa
CHP (5)
The porosity (P) of the fractal aggregates is defined by Shen et al. (2008) as
P =1− [(β2+β3−β1)(β3+β1−β2)(β1+β2−β3)]1/2, (6) whereβi=Ii/(0.4ρ1V1aeff2 ) is a dimensionless quantity, Ii withi=(1,2,3)is the moment of inertia tensor,ρ1is the
density andV1the volume of BC aggregates (see Shen et al.,
2008).
Morphological descriptors of synthetic BC aggregates are calculated from projected images of 50 random particle ori-entations.
2.1.2 Mineral dust aerosol
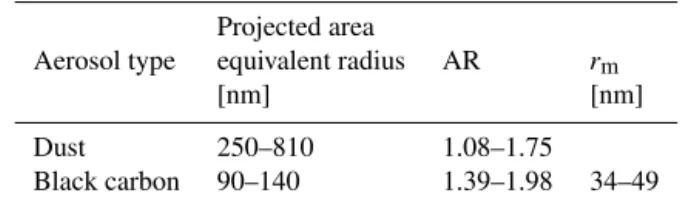
The morphology of suspended mineral dust might take vari-ous forms, as natural dust is an aggregate of internally mixed minerals. Different field studies show AR median values ranging between 1.4 and 1.9 (Chou et al., 2006; Clarke et al., 2004; Reid et al., 2003; Kandler et al., 2006; Dubovik et al., 2006; Mishra et al., 2012). In this study, we modeled dust aerosols as spheroids and rectangular prisms with an inter-mediate aspect ratio (compared to the refereed literature) of 1.75, which has also been found in CARES, PICO, MILA-GRO and the ClearfLo field campaigns (see Table 3).
We summarize the characteristics of the synthetic/modeled aerosol particles in Table 1. Dust particles with a smaller ra-dius are representative of particle size distribution of long-lived distant-transported accumulation-mode airborne dust. The largest radius is representative of the particle’s size near the dust emission sources.
2.2 Computation of optical properties
Table 2. References of the wavelength-dependent refractive indices and density values used for BC and mineral dust. The Chang and Charalampopoulos (1990) values at about 550 nm are 1.77–0.63i, which are lower than the value of 1.95–0.79i suggested by Bond and Bergstrom (2006).
Aerosol compounds Reference refractive indices Density [g cm−3]
Black carbon Chang and Charalampopoulos (1990) 1.8 Mineral dust Wagner et al. (2012) 2.6
Table 1). Optical properties of the binary mixtures are mod-eled using a DDA model (DDSCAT.7.3) (see for model de-tails Draine and Flatau, 1994, 2010). Numerical simulations have been carried out at the specific spectral channels of the AERONET Cimel radiometer (340, 380, 440, 500, 675, 870, 1020 nm) plus at the 550 nm wavelength for comparison with literature values. Optical properties have been averaged over 1000 random orientations, reference refractive indices are listed in Table 2.
The following are the optical properties discussed in this study.
1. The mass absorption, scattering and extinction coeffi-cients (MAC, MSC and MEC):
MAC=Cabs/mass, (7)
MSC=Cscat/mass, (8)
MEC=Cext/mass, (9)
mass=ρ4 3π a
3 eff=
4 3π(ρ1a
3
1,eff+ρ2a23,eff), (10) whereCabs,CscatandCextindicate the absorption, scat-tering and extinction cross sections,ρ1,2is the density (index 1 indicates BC and index 2 mineral dust). MAC and MSC are necessary to calculate the effects of mass concentrations simulated by chemical transport models on radiative transfer. MAC and SSA (defined in Eq. 14) are relevant to determinate the balance between negative and positive forcing.
2. The aerosol absorption, extinction, and scattering Ångström exponent (AAE, EAE, SAE) computed from the slope of the linear fit passing though MAC, MSC and MEC curves (in log–log scale). The AAE and EAE are typically used as indicators of aerosol type and size. AAE=−1log(MAC)
1log(λ) (11)
EAE=−1log(MEC)
1log(λ) (12)
SAE=−1log(MSC)
1log(λ) (13)
3. The SSA is calculated as
SSA=Cscat(λ)/Cext(λ), (14)
Table 3.Synthesis of morphological descriptors for BC and mineral dust aerosol particles sampled in various field campaigns.
Projected area
Aerosol type equivalent radius AR rm
[nm] [nm]
Dust 250–810 1.08–1.75
Black carbon 90–140 1.39–1.98 34–49
whereCabs,CscatandCext(λ)are defined in Eqs. (7), (8) and (9).
4. The asymmetry parameter is defined as
g=1/2 π
Z
0
cos(θ )sin(θ )P (θ )dθ, (15)
whereP (θ )is the scattering-phase function andθis the scattering angle.
SSA andgare the two fundamental parameters neces-sary to perform calculations of aerosol radiative proper-ties (e.g., Chylek and Wong, 1995).
3 Results
3.1 BC internally mixed with dust
We have observed BC internally mixing with suspended min-eral dust (BC particles laying on top of dust particles) in var-ious field campaigns. In Fig. 1, we show a composite of SEM (scanning electron microscope) images from aerosol samples collected: (a) in an urban location 10 km north of downtown Mexico City (MILAGRO, March 2006); (b) 40 km down-wind of the Sacramento urban area in the forested Sierra Nevada foothills, California, USA (Zaveri et al., 2012); (c) in a rural site in Detling, UK (ClearfLo, January–February, 2012); and (d) at Pico Mountain Observatory, Azores Islands (Portugal) in the North Atlantic Ocean (Honrath et al., 2004; Dzepina et al., 2015).
Figure 1.SEM images of internally mixed mineral dust and BC particles observed during various field campaigns:(a)Mexico City, Mexico (Megacity Initiative: Local and Global Research Observations (MILAGRO) 2006);(b)a silicon rich dust particle internally mixed with BC, Sacramento, California, USA (2012);(c)a complex internal mixture of multiple aerosol components, Detling, UK (Clear Air for London (ClearfLo), 2012); and (d)a dust particle with plate-like structure (clay mineral) from Pico Mountain Observatory, Pico island, Azores (Portugal) in the North Atlantic Ocean (2012). Red circles identify BC on the surface of mineral dust particles.
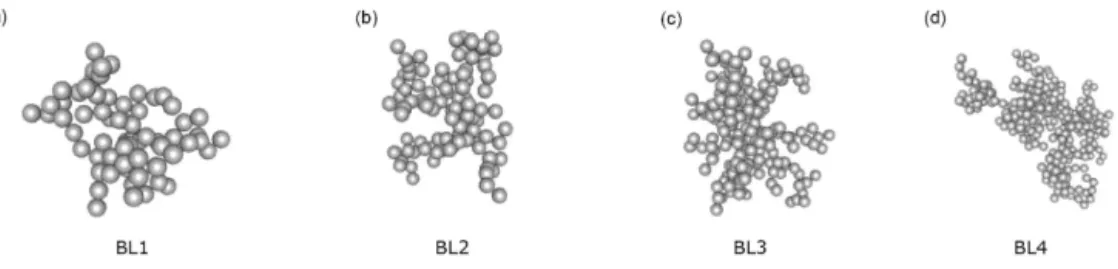
Figure 2.Representation of four BC aggregates (not in scale) with increasing number of monomers (see Table 4). In all cases the monomer radius is 20 nm.
3.2 Morphological characterization of the synthetic aggregates
In order to ensure that the shape of the synthetic BC aggre-gates are representative of ambient air samples, we processed the 2-D binary images of the synthetic particles at 50 random orientations. For synthetic aggregates presented in Fig. 2, we have estimated the averageNestimatedvalues (±standard de-viation) of 63 (±8) for BL1, 119 (±13) for BL2, 179 (±12) for BL3 and 326 (±46) for BL4. Morphological descriptors for the cases BL1–BL4 are summarized in Table 4. Aggre-gates have the same monomer size and similar chain struc-ture but increasing number of monomers.
The accuracy of Nestimated values after image processing
are conditional to two main factors: (1) the number of orien-tations taken for image processing, and (2) the size of the ag-gregate. In Fig. 3, we present a comparison of theNestimated
values from the 2-D projected images with the actualNtrue
values used for the generation of the synthetic aggregates. The Nestimated values approximate well Ntrue values within
the uncertainties.
3.3 Optical properties of bare BC aggregates
The spectral dependence of mass extinction, absorption and scattering coefficients (MEC, MAC, MSC) is presented in Fig. 4 for an ensemble of synthetic open-chain-like aggre-gates, as described in Table 4 (and with a size parameter X=2π aeff/λ <4.5). Large differences are found in
opti-Figure 3.Comparison between the actual monomer (Ntrue) num-ber of the synthetic BC aggregates versus the estimated monomer number (Nestimated) after image processing of 2-D projections of 50 random aggregate orientations, the error bars represent the standard deviation.
cal properties of BC aggregates compared to equivalent vol-ume spherical particles, biases in the nvol-umerical simulations and relevance for radiative forcing estimates are discussed in Scarnato et al. (2013) and China et al. (2015).
It is well known that bare/uncoated fresh BC absorbs more radiation than it scatters (Bond et al., 2013). Therefore, MAC represents the dominant contributor to the MEC. Bond et al. (2013) report BC MAC values larger than 5 m2g−1.
sim-Table 4.Morphological characterization of synthetic BC particles.
Case 2rm Ntrue aeff P Convexity Df AR Roundness [nm] [nm]
BL1 40 70 82 0.86 0.65±0.05 1.98±0.09 1.36±0.17 0.43±0.08 BL2 40 100 100 0.92 0.66±0.05 1.95±0.05 1.46±0.22 0.38±0.04 BL3 40 200 126 0.89 0.63±0.04 2.03±0.05 1.34±0.16 0.44±0.05 BL4 40 300 144 0.90 0.60±0.06 1.95±0.07 1.74±0.36 0.34±0.07
Figure 4. (a) MEC,(b) MAC, and(c)MSC spectral dependency (in log–log scale) for an ensemble of BC aggregates, as described in Tables 1–4. All the computed optical values are averaged over 1000 particle orientations. Dark grey lines underline MAC values at 550 nm. Note that theyscale is different in the three plots.
ilar porosity and monomers size but increasing monomer numbers (see Table 4). MAC values are strongly wavelength dependent (see also Moosmueller et al., 1998, and Lack and Langridge, 2013). At 550 nm MAC predicted values, us-ing a BC density (ρ) of 1.8 g cm−3 (Bond and Bergstrom, 2006), ranging between 5.32 and 5.65 m2g−1 and that are
not strongly sensitive to the aggregate size. The latter finding is in agreement with the fractal theory by Berry and Percival (1986), which maintains that the mass absorption coefficient should not be a strong function of the size, but rather a strong function of the refractive index and physical shape (as well as mixing) (e.g., Fuller et al., 1999; Liu et al., 2008; Scarnato et al., 2013).
The range of predicted MAC values at 550 nm is in agree-ment with field measureagree-ments by Clarke et al. (2004) and modeled values by Kahnert (2010a) and Kahnert and Dev-asthale (2011).
However, several studies (e.g., Bond and Bergstrom, 2006; Adachi et al., 2007; Cross et al., 2010) report larger values. Reasons might be related to different indices of refraction or density values; for instance, the values predicted here are lower than the published values at 550 nm by Scarnato et al. (2013) because of differences in the adopted refractive in-dices. At a wavelength of 550 nm, the refractive index by Chang and Charalampopoulos (1990), adopted in these sim-ulations, has lower real and imaginary indices than the value of 1.95–0.79irecommended by Bond and Bergstrom (2006) (see Table 2), which was adopted in simulations by Scarnato et al. (2013). In this study, as in Scarnato et al. (2013), we used a BC ρ1 value of 1.8 g cm−3. If we use a value ofρ1
equal to 1.4 g cm−3 and the Chang and Charalampopoulos
(1990) refractive index, we find for the cases BL1–BL4 MAC values at 550 nm of about 7 m2g−1. As a reminder, the OPAC
(Optical Properties of Aerosols and Clouds) code uses a den-sity value as low as 1 g cm−3for BC. MSC and SSA values,
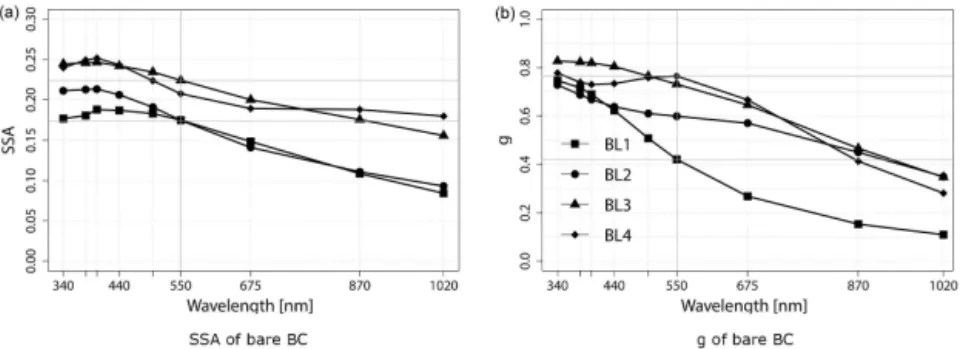
Figure 5. (a)SSA and(b)gspectral dependency for bare BC aggregates (cases BL1–BL4). All the computed optical values are averaged over 1000 particle orientations.
AAE, EAE and SAE values are wavelength dependent (see Table 5 and (Scarnato et al., 2013)). In the spectral range between 340 and 1600 nm, AAE values are consistent with observations and theoretical results with values of approxi-mately 1, while in the spectral range between 400 and 675 nm AAE values approach 1.2 (in agreement with Lack and Lan-gridge, 2013). The range of values of AAE, EAE and SAE is also fairly consistent with Sharma et al. (2013). For exam-ple, we found a SAE average value of 1.79±0.37, which is in the range of values reported by Sharma et al. (2013) of 1.61±0.05 and by Gyawali et al. (2012) of 1.88.
3.4 Optical properties of mineral dust
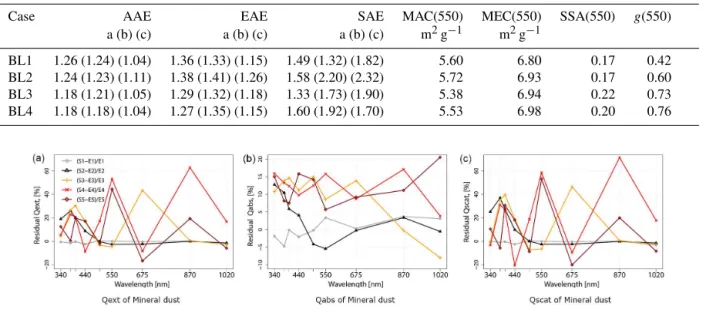
In all the field campaigns presented here, we have found min-eral dust particles with jagged surfaces and irregular shape (see Fig. 1). In particular, in Fig. 1a, c, and d dust particles were found to be silica rich and with a plate-like morphol-ogy. We found that the DDSCAT-predicted optical properties have a large variability depending on the modeled dust shape, despite having the same aspect ratio. In Fig. 6, we present the residual of theQabs,scat,ext=Cabs,scat,ext/π aaeff2 for an ensem-ble of spheroids (E1, E2, E3, E4, E5) and rectangular prisms (S1, S2, S3, S4, S5) with AR=1.75. The difference in the Qabs,scat,extis small for cases E1 and S1, and it is larger (up
to about 50 % in theQext,scat at 550 nm) for larger particle
sizes (cases S4 and S5).
The sensitivity ofQabs,scat,ext to shape confirms the
lim-ited range of applicability of spheroids over different types and sizes of mineral dust aerosols, in agreement with pre-vious modeling studies (Merikallio et al., 2011; Hansell Jr. et al., 2011; Otto et al., 2011). Extended studies on the sen-sitivity to shape of mineral dust particle optical properties in the UV–NIR range can provide useful constrains on the envelope of values to be expected during measurements in ambient air (i.e., Sokolik and Toon, 1999; Hansell Jr. et al., 2011). From Fig. 6, it is also evident that simplifications, in handling mineral dust particle shape, can generate positive (and at times negative) biases in retrieved AOD (aerosol op-tical depth) and opacity, when ellipsoids are adopted in the retrieval and aerosol at the site resemble more the synthetic
rectangular prisms/modeled particles. The magnitude of the biases are strictly dependent on the wavelength and size of the particles. For example, if aerosols at the site resemble more the rectangular prism than the ellipsoidal shape, large positive biases (up to 50 %) in retrieved AOD can be ex-pected at 550 nm for particles with anaeffbetween 700 and
1000 nm, as mineral dust particles (cases S4 and S5) mod-eled as rectangular prisms have a higherQextthan ellipsoids
(cases E4 and E5). No AOD biases should be expected at 550 nm depending on the two shape assumptions for par-ticles smaller than 700 nm. Whereas an average AOD bias of 15±7 % in the shorter wavelength range (340–500 nm) and 10±13 % for longer wavelength range (550–1020 nm) should be expected.
3.5 Optical properties of BC aggregates internally mixed
We have modeled binary internal mixtures of BC aggregates and mineral dust, as visualized in Fig. 7. The BC aggregates are on the surface of the mineral dust particles. Given the plate-like structure of Fig. 1a, c and d, we opted to model mineral dust shape as rectangular prisms. The chosen shape does not cover the whole range of variability encountered in ambient air, but it does for our cases (see Fig. 1, it adds a degree of complexity in the description of mineral dust shape compared to ellipsoids).
In Fig. 8, we present the MAC, MSC, and MEC spectral dependency for three different aerosol types: (1) an ensem-ble of bare mineral dust particles with aspect ratio of 1.75 and increasing size (cases S1–S5), (2) one bare BC aggregate (case BL2), and (3) internal mixtures of the two types (cases BL2S1–BL2S5, where BL2 is mixed, respectively, with S1, S2, S3, and S5).
Table 5.Summary of optical properties predicted by DDSCAT for bare BC aggregates at 550 nm. AAE and EAE have been calculated in different wavelength ranges: (a) 340–1000 nm, (b) 400–675 nm and (c) 340–1600 nm (spectral range not shown in Fig. 4). MAC and MEC values are provided at 550 nm. MSC values have not been included in the table, as they can be calculated by the difference between MEC and MAC values.
Case AAE EAE SAE MAC(550) MEC(550) SSA(550) g(550) a (b) (c) a (b) (c) a (b) (c) m2g−1 m2g−1
BL1 1.26 (1.24) (1.04) 1.36 (1.33) (1.15) 1.49 (1.32) (1.82) 5.60 6.80 0.17 0.42 BL2 1.24 (1.23) (1.11) 1.38 (1.41) (1.26) 1.58 (2.20) (2.32) 5.72 6.93 0.17 0.60 BL3 1.18 (1.21) (1.05) 1.29 (1.32) (1.18) 1.33 (1.73) (1.90) 5.38 6.94 0.22 0.73 BL4 1.18 (1.18) (1.04) 1.27 (1.35) (1.15) 1.60 (1.92) (1.70) 5.53 6.98 0.20 0.76
Figure 6.Differences in percentage between extinction, absorption and scattering efficiency for spheroids vs. rectangular prisms.
Figure 7.Visual representation of polluted dust, as an internal mix-ture of BC and mineral dust. The shape of the particle is repre-sented by an array of coordinates (small dots or spheres) to which is associated a dipole moment. Brown dots represent the dust par-ticle dipoles, while grey, small spheres represent the dipoles of the BC aggregate. The cases BL2S1, BL2S2, BL2S3, and BL2S5 have BL2, respectively, on the surface of S1, S2, S3 and S5. Arrows show that sides of the rectangular prism can vary keeping the aspect ratio constant to a value of 1.75.
dust at 550 nm a MAC average value of 0.13±0.03 m2g−1 (±standard deviation).
The internally mixed particles (cases BL2S1–BL2S5, also referred to as polluted dust) have higher MAC values for smaller particles (BL2 has the highest MAC). As expected, DDSCAT predicts higher MAC values for polluted dust than for unpolluted/bare dust, with an average MAC value of 0.26±0.27 m2g−1at 550 nm.
Furthermore, MSC values of bare mineral dust aerosols have a strong variability with size and wavelength. DDSCAT predicts an average MSC value at 550 nm of 2.1±1.9 m2g−1 for dust particles ranging in size from 0.18 to 1µm. When
considering just the accumulation mode, with dust size rang-ing between 0.5 and 1µm, DDSCAT predicts a smaller MSC average value of 0.8±0.2 m2g−1. Fine-mode parti-cles compared to coarse-mode partiparti-cles have larger MSC val-ues because smaller particles scatter light more efficiently at visible wavelengths. Hand and Malm (2007), after re-viewing 60 studies of ground-based observations, report at 550 nm for the fine-mode dust an average MSC value of 3.3±0.6 m2g−1, while they report in the accumulation mode smaller MSC values of 0.9±0.8 m2g−1, in agreement with our study. The MSC of larger dust particles (cases S3, S4, and S5) does not show a strong spectral dependency, while the opposite is true for small particles (cases S1 and S2); see Fig. 8c. It should be noted that the spectral variability of AOD is used in remote sensing in interpreting aerosol type. For ex-ample, mineral dust aerosol is assumed to have a “spectrally flat” AOD, while biomass burning or polluted aerosol usually exhibit a strong wavelength dependence. The spectral depen-dencies in Fig. 8a demonstrate that small mineral dust aerosol particles and polluted dust have also a strong AOD spectral dependence, those characteristics might be a potential source of classifications of aerosol type, size and amount.
Figure 8. (a)MEC,(b)MAC, and(c)MSC spectral dependency for a BC aggregate (BL2) internally mixed with a mineral dust particle represented as a rectangular prism (BL2S1–BL2S5; see Fig. 7). MEC, MAC, and MSC are normalizedby total massof the internally mixed
particle (see Table 2). All the computed optical values are averaged over 1000 particle orientations.
Figure 9. (a)Cext,(b)Cabsand(c)Cscatratios of an external vs. internal mixture of BC and mineral dust aerosols.
range, with ratios, respectively, of 1.09±0.06, 0.96±0.05 and 1.02±0.07.
The latter might be due to the combination of (1) small electromagnetic interactions between the BC aggregate and the mineral dust particle, due to the small size parameter; and (2) the small difference in size between BC and min-eral dust particles (with a mixture/core size ratio smaller than 2.8). However, we found for larger particles (with larger size parameters) with larger differences in Cext, abs, scat
val-ues, depending on the parametrization of the mixing configu-rations (such as external, cases BL2+S3, BL2+S5, BL2S3, and internal BL2S3 and BL2S5). For those cases, simu-lations using external mixture representations give smaller Cabsvalues compared to internal mixtures (with average ratio
of 0.87±0.30) for wavelengths shorter than 550 nm, while larger values (average ratio of 1.35±0.49) for wavelengths larger than 550 nm. Furthermore, Cscat values for external
mixtures are smaller than internal mixtures in most of the spectral range studied (and similarly forCextvalues) with
av-erage ratios of 0.59±0.30 and 0.49±0.27 for wavelengths shorter and larger than 550 nm. The internal mixture might lead to largerCscat(and similarly forCext) values because of
larger scattering interactions and electromagnetic coupling between mineral dust and BC, which might lead to an in-crease in scattering compared to the external mixtures; simi-lar results were found in Scarnato et al. (2013).
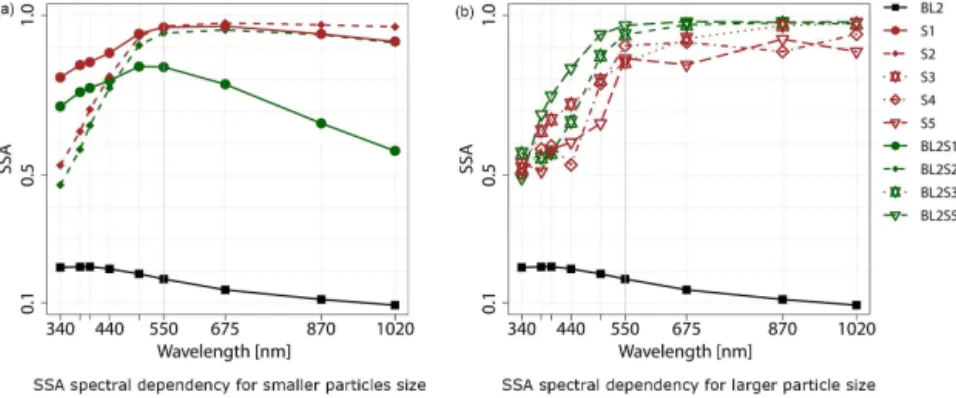
The SSA spectral signatures of bare BC (BL2), an ensem-ble of mineral dust (cases S1–S5), and internal mixtures of
the two aerosol components (BL2S1–BL2S5) are shown in Fig. 10. Bare mineral dusts (cases S1–S5) show a typical de-crease in the SSA magnitude for wavelengths shorter than 500 nm, with SSA values ranging from 0.85 to 0.96 depend-ing on the size of the dust particle, with smaller values at-tributed to larger particles. The range of values predicted by DDSCAT, in this study, is in agreement with values of 0.7– 0.97 for Sahara dust reported by Ryder et al. (2013), where the authors attributed variability in measured values to the presence of a significant number of large particles. Further-more, analyses of the SSA values of Saharan dust from the AERONET reported averages of 0.95 at 0.67µm (Dubovik et al., 2002). SSA values of 0.95–0.99 have been reported during the Saharan Dust Experiment (SHADE) and the Dust Outflow and Deposition to the Ocean (DODO) (Tanre et al., 2003; McConnell et al., 2010; Johnson et al., 2008). Osborne et al. (2008) estimated the SSA for pure dust aerosol during the Dust and Biomass-burning Experiment DABEX, (Hay-wood et al., 2008) to be consistently high (ranging between 0.98 and 0.99).
Figure 10.SSA for different particle sizes in the accumulation mode:(a)finer particles and(b)larger particles.
Figure 11.gfor different particle sizes in the accumulation mode:(a)finer particles and(b)larger particles.
at all wavelengths compared to bare dust particles (S3–S5). Such a “cut off” in SSA values is due to the fact that sim-ulations predict for small internally mixed particles (cases BL2S1 and BL2S2), where dust particles are small in size; a steep increase in the absorption and no significant variation in the scattering properties compared to bare mineral dust (S1 and S2). The latter leads to smaller SSA values of internal mixtures compared to bare mineral dust particles. Further-more, when mineral dust particles are large (cases S3–S5) and therefore the BC mass (case BL2) results comparatively much smaller than the mass of cases S3 and S5) DDSCAT simulations predict a steep increase in the scattering but less in the absorption; therefore, the prevailing scattering vs. ab-sorption for those cases is associated with larger SSA values compared to bare mineral dust.
In an attempt to synthesize the differences between the above-discussed optical properties of bare BC and internal mixtures, we found that with the increase in size of mineral dust, the absorption increases; however, also the scattering of the internal mixture (cases BL2S1–BL2S5) increases, lead-ing to larger SSA values for internal mixtures compared to bare BC (case BL2) (not shown here, as we provide MAC normalized by the total mass of the particle, not just BC mass). The increase in the absorption, despite no embedding
(no “lens effect”; see also Scarnato et al., 2013) is due to ab-sorption properties of mineral dust.
DDSCAT predicts a wavelength-dependent asymmetry pa-rameterg(see Fig. 11), BC has higher spectral dependency than dust, mostly due to the variation in real part of the BC re-fractive index with wavelength. DDSCAT predicts at 550 nm highergvalues for internally mixed polluted dust than bare mineral dust; largergvalues are predicted when modeling an external mixture compared to an internal mixture, differences can amount up to about 37 % (see Table 6).
4 Conclusions
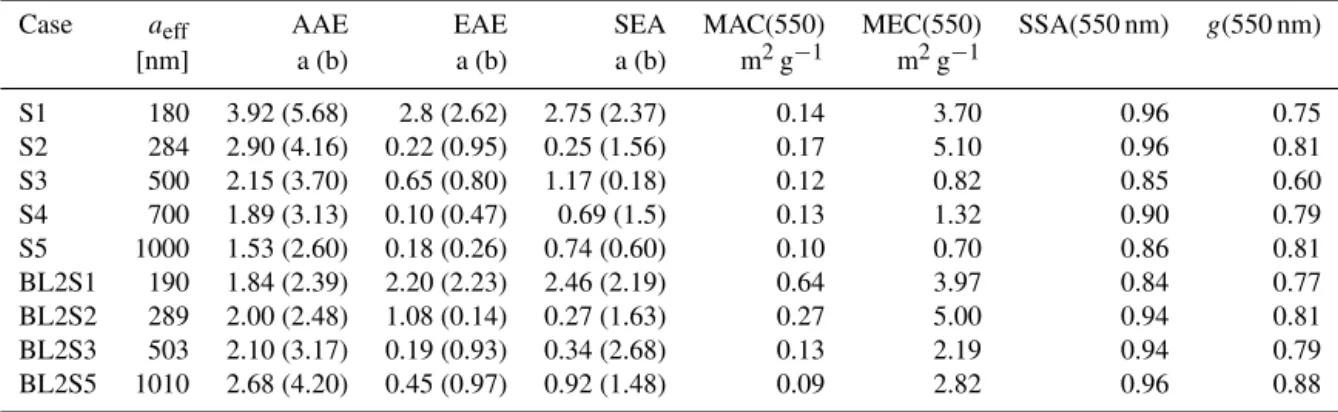
Table 6.Summary of simulated optical properties for mineral dust and internal mixtures with BC aggregates. AAE and EAE have been calculated in two different wavelength ranges: (a) 340–1020 nm and (b) 400–675 nm.
Case aeff AAE EAE SEA MAC(550) MEC(550) SSA(550 nm) g(550 nm) [nm] a (b) a (b) a (b) m2g−1 m2g−1
S1 180 3.92 (5.68) 2.8 (2.62) 2.75 (2.37) 0.14 3.70 0.96 0.75 S2 284 2.90 (4.16) 0.22 (0.95) 0.25 (1.56) 0.17 5.10 0.96 0.81 S3 500 2.15 (3.70) 0.65 (0.80) 1.17 (0.18) 0.12 0.82 0.85 0.60 S4 700 1.89 (3.13) 0.10 (0.47) 0.69 (1.5) 0.13 1.32 0.90 0.79 S5 1000 1.53 (2.60) 0.18 (0.26) 0.74 (0.60) 0.10 0.70 0.86 0.81 BL2S1 190 1.84 (2.39) 2.20 (2.23) 2.46 (2.19) 0.64 3.97 0.84 0.77 BL2S2 289 2.00 (2.48) 1.08 (0.14) 0.27 (1.63) 0.27 5.00 0.94 0.81 BL2S3 503 2.10 (3.17) 0.19 (0.93) 0.34 (2.68) 0.13 2.19 0.94 0.79 BL2S5 1010 2.68 (4.20) 0.45 (0.97) 0.92 (1.48) 0.09 2.82 0.96 0.88
In this study, we carried out numerical simulations to in-vestigate the sensitivity of climate-relevant aerosol optical properties to various approximations on aerosol size, shape and state of mixing and draw benchmark considerations for climate studies and remote sensing applications. Based on aerosol samples collected in Mexico, England, USA (Cal-ifornia) and Portugal, we have observationally constrained morphology and mixing and modeled optical properties ac-cordingly, of three different types of aerosols: (1) bare BC aggregates, (2) bare mineral dust, and (3) an internal mixture of BC and dust particles, also referred to as polluted dust.
Optical properties including MAC, MEC, MSC, AAE, EAE, SSA andgwere predicted over the spectral range be-tween 340 and 1020 nm using DDSCAT, which applies the discrete dipole approximation (DDA). Specific wavelengths have been selected to match the AERONET nominal chan-nels.
Key results for bare BC aggregates include (i) a weak MAC dependency on the aggregate size, but stronger MAC dependency on the refractive index, in agreement with Berry and Percival (1986), Liu et al. (2008) and Scarnato et al. (2013); (ii) a strongg dependency on aggregate size; (iii) consistency between DDSCAT-predicted and observed values of AAE, EAE, SAE (e.g., Lack and Langridge, 2013) and SSA (and its spectral variability) (Sharma et al., 2013).
Key results for bare mineral dust aerosol include (i) a strong sensitivity of dust optical properties to shape (DDSCAT predicts at 550 nm an average difference between spheroids and prisms of about 20 % for MEC and MSC, while of about 5 % for MAC); (ii) a consistency between DDSCAT-predicted and observed values of MAC, MSC and SSA reported by Hand and Malm (2007); and (iii) a typical decrease in the SSA magnitude for wavelengths shorter than 500 nm (also found to be characteristic of organics and the aerosol mixtures of sodium chloride and BC; see also Scar-nato et al., 2013; Russell et al., 2010).
Key results for polluted mineral dust, an internal mix-ture of BC and mineral dust, include (i) a strong decrease in MAC values with the increase in dust particle size (case
BL2S1 presents largest values), while the opposite for SSA values. (ii) A decrease in the SSA magnitude compared to bare dust for smaller dust particle sizes (cases BL2S1 and BL2S2) in agreement with Clarke et al. (2004). Furthermore, (iii) the strong differences in predicted magnitude and spec-tral dependence ofCabs,scat,ext when mixing a BC aggregate
(case BL2) externally or internally with large mineral dust particles (cases S3, S5, BL2S3, and BL2S5).
With this study, we demonstrated the importance of (i) characterizing and defining microphysical properties, such as morphology/shape and mixing of different aerosol types collected in ambient air, (ii) estimating optical proper-ties accordingly to observations, and (iii) defining eventual benchmark errors due to use of approximations in shape and mixing. More studies are needed to assess the abundance of polluted dust particles in the atmosphere. In fact, the occur-rence of such configuration is currently highly uncertain and might strongly depend on source and transport regions. Ac-counting for changes in optical properties, induced by mixing as well as by the abundance of mixed particles, might be crit-ical not only for calculating the relevance of such particles on regional radiative forcing but also to understand biases in re-mote sensing techniques and to explore the potential of such techniques in remotely detected mixed particle cases.
Acknowledgements. The work in this paper has been funded
by the Research Initiation Program at the Naval Postgraduate school. Some of the work discussed in this paper was funded through the following grants: NASA (grant NNX13AN68H), NSF (grant AGS-1110059), DOE (grants DE-SC0006941 and DE-SC0010019). S. China and C. Mazzoleni would also like to acknowledge the contribution of several collaborators while collecting aerosol samples in several field campaigns and utilized here. Scarnato would like to acknowledge Denis Richard for providing the aggregation code, and Sanaz Vahidinia for building a first version of the internal mixing code.
References
Adachi, K. and Buseck, P. R.: Changes of ns-soot mixing states and shapes in an urban area during CalNex, J. Geophys. Res.-Atmos., 118, 3723–3730, doi:10.1002/jgrd.50321, 2013.
Adachi, K., Chung, S. H., Friedrich, H., and Buseck, P. R.: Frac-tal parameters of individual soot particles determined using elec-tron tomography: Implications for optical properties, J. Geophys. Res.-Atmos., 112, D14202, doi:10.1029/2006JD008296, 2007. Adachi, K., Chung, S., and Buseck, P.: Shapes of soot aerosol
par-ticles and implications for their effects on climate, J. Geophys. Res., 115, D15206, doi:10.1029/2009JD012868, 2010.
Berry, M. and Percival, I.: Optics of fractal clusters such as smoke, Opt. Acta, 33, 577–591, 1986.
Bond, T. C. and Bergstrom, R.: Light Absorption by Carbonaceous Particles: An Investigative Review, Aerosol Sci. Technol., 40, 27–67, 2006.
Bond, T. C., Doherty, S. J., Fahey, D. W., Forster, P. M., Berntsen, T., DeAngelo, B. J., Flanner, M. G., Ghan, S., Kärcher, B., Koch, D., Kinne, S., Kondo, Y., Quinn, P. K., Sarofim, M. C., Schultz, M. G., Schulz, M., Venkataraman, C., Zhang, H., Zhang, S., Bellouin, N., Guttikunda, S. K., Hopke, P. K., Jacobson, M. Z., Kaiser, J. W., Klimont, Z., Lohmann, U., Schwarz, J. P., Shindell, D., Storelvmo, T., Warren, S. G., and Zender, C. S.: Bounding the role of black carbon in the climate system: A sci-entific assessment, J. Geophys. Res.-Atmos., 118, 5380–5552, doi:10.1002/jgrd.50171, 2013.
Bueno, P. A., Havey, D., Mulholland, G., Hodges, J., Gillis, K., Dickerson, R., and Zachariah, M.: Photoacoustic Measure-ments of Amplification of the Absorption Cross Section for Coated Soot Aerosols, Aerosol Sci. Technol., 45, 1217–1230, doi:10.1080/02786826.2011.587477, 2011.
Cappa, C. D., Onasch, T., Massoli, P., Worsnop, D. R., Bates, T. S., Cross, E. S., Davidovits, P., Hakala, J., Hayden, K. L., Jobson, B. T., Kolesar, K. R., Lack, D. A., Lerner, B. M., Li, S., Mellon, D., Nuaaman, I., Olfert, J. S., Petaejae, T., Quinn, P. K., Song, C., Subramanian, R., Williams, E., and Zaveri, R. A.: Radiative Absorption Enhancements Due to the Mixing State of Atmospheric Black Carbon, Science, 337, 1078–1081, doi:10.1126/science.1223447, 2012a.
Cappa, C. D., Onasch, T. B., Massoli, P., Worsnop, D. R., Bates, T. S., Cross, E. S., Davidovits, P., Hakala, J., Hayden, K. L., Job-son, B. T., Kolesar, K. R., Lack, D. A., Lerner, B. M., Li, S.-M., Mellon, D., Nuaaman, I., Olfert, J. S., Petäjä, T., Quinn, P. K., Song, C., Subramanian, R., Williams, E. J., and Zaveri, R. A.: Radiative Absorption Enhancements Due to the Mixing State of Atmospheric Black Carbon, Science, 337, 1078–1081, 2012b. Chang, H. and Charalampopoulos, T. T.: Determination of the
wavelength dependence of refractive indices of flame soot, Proc. R. Soc. London, 1, 577–591, 1990.
Chester, R., Elderfield, H., Griffin, J. J., Johnson, L. R., and Padgham, R. C.: Eolian dust along the easter margins, Mar. Geol., 13, 91–106, 1972.
China, S., Mazzoleni, C., Gorkowski, K., Aiken, A. C., and Dubey, M. K.: Morphology and mixing state of individual freshly emit-ted wildfire carbonaceous particles, Nat. Commun., 4, 2122, doi:10.1038/ncomms3122, 2013.
China, S., Salvadori, N., and Mazzoleni, C.: Effect of Traffic and Driving Characteristics on Morphology of Atmospheric Soot
Particles at Freeway On-Ramps, Environ. Sci. Technol., 48, 3128–3135, doi:10.1021/es405178n, 2014.
China, S., Scarnato, B., Owen, R. C., Zhang, B., Ampadu, M. T., Kumar, S., Dzepina, K., Dziobak, M. P., Fialho, P., Perlinger, J. A., Hueber, J., Helmig, D., Mazzoleni, L. R., and Mazzoleni, C.: Morphology and mixing state of aged soot particles at a remote marine free troposphere site: Implications for optical properties, Geophys. Res. Lett., 42, 1243–1250, 2015.
Chou, C., Formenti, P., Maille, M., Ausset, P., and Helas, G.: Size distribution, shape, and composition of mineral dust aerosols col-lected during the African Monsoon Multidisciplinary Analysis Special Observation Period 0: dust and biomass-burning exper-iment field campaign in Niger, J. Geophys. Res., 113, D00C10, doi:10.1029/2008JD009897, 2006.
Chylek, P. and Wong, J.: Effect of absorbing aerosols on global radiation budget, Geophys. Res. Lett., 22, 929–931, doi:10.1029/95GL00800, 1995.
Clarke, A. D., Shinozuka, Y., Kapustin, V. N., Howell, S., Huebert, B., Doherty, S., Anderson, T., Covert, D., Anderson, J., Hua, X., Moore, K. G., McNaughton, C., Carmichael, G., and Weber, R.: Size distributions and mixtures of dust and black carbon aerosol in Asian outflow: Physiochemistry and optical properties, J. Geo-phys. Res.-Atmos., 109, D15S09, doi:10.1029/2003JD004378, 2004.
Cross, E. S., Onasch, T. B., Ahern, A., Wrobel, W., Slowik, J. G., Olfert, J., Lack, D. A., Massoli, P., Cappa, C. D., Schwarz, J. P., Spackman, J. R., Fahey, D. W., Sedlacek, A., Trimborn, A., Jayne, J. T., Freedman, A., Williams, L. R., Ng, N. L., Maz-zoleni, C., Dubey, M., Brem, B., Kok, G. S. R., Freitag, S., Clarke, A., Thornhill, D., Marr, L. C., Kolb, C. E., Worsnop, D. R., and Davidovits, P.: Soot Particle Studies – Instrument Inter-Comparison – Project Overview, Aerosol Sci. Technol., 44, 592–611, doi:10.1080/02786826.2010.482113, 2010.
Deuze, J., Breon, F., Devaux, C., Goloub, P., Herman, H., Lafrance, B., Maignan, F., Marchand, A., Nadal, F., Perry, G., and Tanre, D.: Remote sensing of aerosols over land surfaces from POLDER-ADEOS-1 polarized measurements, J. Geophys. Res., 106, 4913–4926, doi:10.1029/2000JD900364, 2001.
Draine, B. and Flatau: Discrete dipole approximation for scattering calculations, J. Opt. Soc. Am. A, 11, 1491–1499, 1994. Draine, B. and Flatau, P. J.: User Guide to the Discrete Dipole
Approximation Code DDSCAT 7.1, Cornell University Library, 2010.
Dubovik, O., Holben, B. N., Lapyonok, T., Sinyuk, A., Mishchenko, M. I., Yang, P., and Slutsker, I.: Non-spherical aerosol retrieval method employing light scattering by spheroids, Geophys. Res. Lett., 29, 541–544, doi:10.1029/2001GL014506, 2002. Dubovik, O., Sinyuk, A., Lapyonok, T., and Holben, B. N., and
Dzepina, K., Mazzoleni, C., Fialho, P., China, S., Zhang, B., Owen, R. C., Helmig, D., Hueber, J., Kumar, S., Perlinger, J. A., Kramer, L. J., Dziobak, M. P., Ampadu, M. T., Olsen, S., Wuebbles, D. J., and Mazzoleni, L. R.: Molecular characterization of free tro-pospheric aerosol collected at the Pico Mountain Observatory: a case study with a long-range transported biomass burning plume, Atmos. Chem. Phys., 15, 5047–5068, doi:10.5194/acp-15-5047-2015, 2015.
Fuller, K. A., Malm, W. C., and Kreidenweis, S. M.: Effects of mix-ing on extinction by carbonaceous particles, J. Geophys. Res., 104, 15941–15954, 1999.
Gyawali, M., Arnott, W. P., Zaveri, R. A., Song, C., Moosmüller, H., Liu, L., Mishchenko, M. I., Chen, L.-W. A., Green, M. C., Watson, J. G., and Chow, J. C.: Photoacoustic optical properties at UV, VIS, and near IR wavelengths for laboratory generated and winter time ambient urban aerosols, Atmos. Chem. Phys., 12, 2587–2601, doi:10.5194/acp-12-2587-2012, 2012.
Hand, J. L. and Malm, W. C.: Review of aerosol mass scattering ef-ficiencies from ground-based measurements since 1990, J. Geo-phys. Res.-Atmos., 112, D16203, doi:10.1029/2007JD008484, 2007.
Hansell Jr., R. A., Reid, J. S., Tsay, S. C., Roush, T. L., and Kalash-nikova, O. V.: A sensitivity study on the effects of particle chem-istry, asphericity and size on the mass extinction efficiency of mineral dust in the earth’s atmosphere: from the near to thermal IR, Atmos. Chem. Phys., 11, 1527–1547, doi:10.5194/acp-11-1527-2011, 2011.
Hasekamp, O., Litvinov, P., and Butz, A.: Aerosol proper-ties over the ocean from PARASOL multiangle photopo-larimetric measurements, J. Geophys. Res., 116, D14204, doi:10.1029/2010JD015469, 2011.
Haywood, J. M., Pelon, J., Formenti, P., Bharmal, N., Brooks, M., Capes, G., Chazette, P., Chou, C., Christopher, S., Coe, H., Cuesta, J., Derimian, Y., Desboeufs, K., Greed, G., Harrison, M., Heese, B., Highwood, E. J., Johnson, B., Mallet, M., Mar-ticorena, B., Marsham, J., Milton, S., Myhre, G., Osborne, S. R., Parker, D. J., Rajot, J.-L., Schulz, M., Slingo, A., Tanré, D., and Tulet, P.: Overview of the Dust and Biomass-burning Ex-periment and African Monsoon Multidisciplinary Analysis Spe-cial Observing Period-0, J. Geophys. Res.-Atmos., 113, D00C17, doi:10.1029/2008JD010077, 2008.
Honrath, R., Owen, R. C., Val Martin, M., Reid, J., Lapina, K., Fi-alho, P., Dziobak, M. P., Kleissl, J., and Westphal, D.: Regional and hemispheric impacts of anthropogenic and biomass burn-ing emissions on summertime CO andO3in the North Atlantic lower free troposphere, J. Geophys. Res.-Atmos., 109, D24310, doi:10.1029/2004JD005147, 2004.
Jacobson, M.: Strong radiative heating due to mixing state of black carbon in atmospheric aerosol, Letters to Nature, 409, 695–697, doi:10.1038/35055518, 2001.
Jacobson, M. Z.: Effects of biomass burning on climate, account-ing for heat and moisture fluxes, black and brown carbon, and cloud absorption effects, J. Geophys. Res.-Atmos., 119, 8980– 9002, doi:10.1002/2014JD021861, 2014.
Johnson, B. T., Osborne, S. R., Haywood, J. M., and Harrison, M. A. J.: Aircraft measurements of biomass burning aerosol over West Africa during DABEX, J. Geophys. Res.-Atmos., 113, D00C06, doi:10.1029/2007JD009451, 2008.
Kahnert, M.: On the Discrepancy between Modeled and Mea-sured Mass Absorption Cross Sections of Light Absorb-ing Carbon Aerosols, Aerosol Sci. Technol., 44, 453–460, doi:10.1080/02786821003733834, 2010a.
Kahnert, M.: Numerically exact computation of the optical prop-erties of light absorbing carbon aggregates for wavelength of 200 nm–12.2 µm, Atmos. Chem. Phys., 10, 8319–8329, doi:10.5194/acp-10-8319-2010, 2010b.
Kahnert, M. and Devasthale, A.: Black carbon fractal morphol-ogy and short-wave radiative impact: a modelling study, Atmos. Chem. Phys., 11, 11745–11759, doi:10.5194/acp-11-11745-2011, 2011.
Kahnert, M., Nousiainen, T., Lindqvist, H., and Ebert, M.: Op-tical properties of light absorbing carbon aggregates mixed with sulfate: assessment of different model geometries for climate forcing calculations, Opt. Express, 20, 10042–10058, doi:10.1364/OE.20.010042, 2012.
Kalashnikova, O. V., Garay, M. J., Martonchik, J. V., and Diner, D. J.: MISR Dark Water aerosol retrievals: operational algo-rithm sensitivity to particle non-sphericity, Atmos. Meas. Tech., 6, 2131–2154, doi:10.5194/amt-6-2131-2013, 2013.
Kandler, K., Schutz, L., Deutscher, C., Ebert, M., and Hofmann, H.: Size distribution, mass concentration, chemical and mineralogi-cal composition, and derived optimineralogi-cal parameters of the boundary layer aerosol at Tinfou, Morocco, during SAMUM, Tellus B, 61, 32–50, 2006.
Kim, D., Wang, C., Ekman, A. M. L., Barth, M. C., and Rasch, P. J.: Distribution and direct radiative forcing of car-bonaceous and sulfate aerosols in an interactive size-resolving aerosol–climate model, J. Geophys. Res.-Atmos., 113, D16309, doi:10.1029/2007JD009756, 2008.
Klingmüller, K., Steil, B., Brühl, C., Tost, H., and Lelieveld, J.: Sen-sitivity of aerosol radiative effects to different mixing assump-tions in the AEROPT 1.0 submodel of the EMAC atmospheric– chemistry–climate model, Geosci. Model Dev., 7, 2503–2516, doi:10.5194/gmd-7-2503-2014, 2014.
Koch, D., Schulz, M., Kinne, S., McNaughton, C., Spackman, J. R., Balkanski, Y., Bauer, S., Berntsen, T., Bond, T. C., Boucher, O., Chin, M., Clarke, A., De Luca, N., Dentener, F., Diehl, T., Dubovik, O., Easter, R., Fahey, D. W., Feichter, J., Fillmore, D., Freitag, S., Ghan, S., Ginoux, P., Gong, S., Horowitz, L., Iversen, T., Kirkevåg, A., Klimont, Z., Kondo, Y., Krol, M., Liu, X., Miller, R., Montanaro, V., Moteki, N., Myhre, G., Penner, J. E., Perlwitz, J., Pitari, G., Reddy, S., Sahu, L., Sakamoto, H., Schuster, G., Schwarz, J. P., Seland, Ø., Stier, P., Takegawa, N., Takemura, T., Textor, C., van Aardenne, J. A., and Zhao, Y.: Eval-uation of black carbon estimations in global aerosol models, At-mos. Chem. Phys., 9, 9001–9026, doi:10.5194/acp-9-9001-2009, 2009.
Lack, D. A. and Langridge, J. M.: On the attribution of black and brown carbon light absorption using the Ångström ex-ponent, Atmos. Chem. Phys. Discuss., 13, 15493–15515, doi:10.5194/acpd-13-15493-2013, 2013.
Lau, K. and Kim, K.: Observational relationships between aerosol and Asian monsoon rainfall, and circulation, Geophys. Res. Lett., 33, L21810, doi:10.1029/2006GL027546, 2006.
McConnell, C. L., Formenti, P., Highwood, E. J., and Harrison, M. A. J.: Using aircraft measurements to determine the refrac-tive index of Saharan dust during the DODO Experiments, At-mos. Chem. Phys., 10, 3081–3098, doi:10.5194/acp-10-3081-2010, 2010.
Merikallio, S., Lindqvist, H., Nousiainen, T., and Kahnert, M.: Modelling light scattering by mineral dust using spheroids: as-sessment of applicability, Atmos. Chem. Phys., 11, 5347–5363, doi:10.5194/acp-11-5347-2011, 2011.
Mishra, S. K., Tripathi, S. N., Aggarwal, S., and Arola, A.: Optical properties of accumulation mode, polluted mineral dust: effects of particle shape, hematite content and semi-external mixing with carbonaceous species, Tellus B, 64, 18536, doi:10.3402/tellusb.v64i0.18536, 2012.
Moosmueller, H., Arnott, W. P., Rogers, C. F., Chow, J. C., Fra-zier, C. A., Sherman, L. E., and Dietrich, D. L.: Photoacous-tic and filter measurements related to aerosol light absorp-tion during the Northern Front Range Air Quality Study (Col-orado 1996/1997), J. Geophys. Res.-Atmos., 103, 28149–28157, doi:10.1029/98JD02618, 1998.
Nousiainen, T.: Optical modeling of mineral dust particles: A re-view, J. Quant. Spectrosc. Ra., 110, 1261–1279, 2009.
Oh, C. and Sorensen, C.: The Effect of Overlap between Monomers on the Determination of Fractal Cluster Morphology, J. Colloid Interf. Sci., 193, 17–25, doi:10.1006/jcis.1997.5046, 1997. Osborne, S. R., Johnson, B. T., Haywood, J. M., Baran, A. J.,
Harrison, M. A. J., and McConnell, C. L.: Physical and optical properties of mineral dust aerosol during the Dust and Biomass-burning Experiment, J. Geophys. Res.-Atmos., 113, D00C03, doi:10.1029/2007JD009551, 2008.
Otto, S., Trautmann, T., and Wendisch, M.: On realistic size equiv-alence and shape of spheroidal Saharan mineral dust particles applied in solar and thermal radiative transfer calculations, At-mos. Chem. Phys., 11, 4469–4490, doi:10.5194/acp-11-4469-2011, 2011.
Prospero, J. M., Glaccum, R. A., and Nees, R. T.: Atmospheric transport of soil dust from Africa to South America, Nature, 289, 570–572, 1981.
Reale, O., Lau, K. M., and da Silva, A.: Impact of interactive aerosol on the african easterly jet in the nasa geos-5 global forecasting system, Weather Forecast., 26, 504–519, doi:10.1175/WAF-D-10-05025.1, 2011.
Reid, E. A., Reid, J. S., Meier, M. M., Dunlap, M. R., and Cliff, S. S.: Characterization of African dust transported to Puerto Rico by individual particle and size segregated bulk analysis, J. Geo-phys. Res., 108, 8591, doi:10.1029/2002JD002935, 2003. Richard, D., Glenar, D., Stubbs, T., Davis, S., and Colaprete, A.:
Light scattering by complex particles in the Moon’s exosphere: Toward a taxonomy of models for the realistic simulation of the scattering behavior of lunar dust, Planet. Space Sci., 59, 1804– 1814, doi:10.1016/j.pss.2011.01.003, 2011.
Richard, D. T. and Davis, S. S.: Lunar dust characterization by polarimetric signature, Astron. Astrophys., 483, 643–649, doi:10.1051/0004-6361:20079108, 2008.
Russell, P. and Heintzenburg, J.: An overview of the ACE-2 clear sky column closure experiment, Tellus, 52, 463–483, 2000. Russell, P. B., Bergstrom, R. W., Shinozuka, Y., Clarke, A. D.,
De-Carlo, P. F., Jimenez, J. L., Livingston, J. M., Redemann, J., Dubovik, O., and Strawa, A.: Absorption Angstrom Exponent in
AERONET and related data as an indicator of aerosol composi-tion, Atmos. Chem. Phys., 10, 1155–1169, doi:10.5194/acp-10-1155-2010, 2010.
Ryder, C. L., Highwood, E. J., Rosenberg, P. D., Trembath, J., Brooke, J. K., Bart, M., Dean, A., Crosier, J., Dorsey, J., Brind-ley, H., Banks, J., Marsham, J. H., McQuaid, J. B., Sodemann, H., and Washington, R.: Optical properties of Saharan dust aerosol and contribution from the coarse mode as measured during the Fennec 2011 aircraft campaign, Atmos. Chem. Phys., 13, 303– 325, doi:10.5194/acp-13-303-2013, 2013.
Samset, B. H., Myhre, G., Schulz, M., Balkanski, Y., Bauer, S., Berntsen, T. K., Bian, H., Bellouin, N., Diehl, T., Easter, R. C., Ghan, S. J., Iversen, T., Kinne, S., Kirkevåg, A., Lamarque, J.-F., Lin, G., Liu, X., Penner, J. E., Seland, Ø., Skeie, R. B., Stier, P., Takemura, T., Tsigaridis, K., and Zhang, K.: Black carbon vertical profiles strongly affect its radiative forcing uncertainty, Atmos. Chem. Phys., 13, 2423–2434, doi:10.5194/acp-13-2423-2013, 2013.
Samson, R. J., Mulholland, G. W., and Gentry, J. W.: Struc-tural analysis of soot agglomerates, Langmuir, 3, 272–281, doi:10.1021/la00074a022, 1987.
Scarnato, B. V., Vahidinia, S., Richard, D. T., and Kirchstetter, T. W.: Effects of internal mixing and aggregate morphology on optical properties of black carbon using a discrete dipole approximation model, Atmos. Chem. Phys., 13, 5089–5101, doi:10.5194/acp-13-5089-2013, 2013.
Sharma, N., Arnold, I. J., Moosmüller, H., Arnott, W. P., and Maz-zoleni, C.: Photoacoustic and nephelometric spectroscopy of aerosol optical properties with a supercontinuum light source, Atmos. Meas. Tech., 6, 3501–3513, doi:10.5194/amt-6-3501-2013, 2013.
Shen, Y., Draine, B. T., and Eric, T. J.: Modeling Porous Dust Grains with Ballistic Aggregates. I. Geometry and Optical Properties, Astrophys. J., 689, 260, doi:10.1086/592765, 2008.
Sokolik, I. N. and Toon, O. B.: Incorporation of mineralogical composition into models of the radiative properties of mineral aerosol from UV to IR wavelengths, J. Geophys. Res.-Atmos., 104, 9423–9444, doi:10.1029/1998JD200048, 1999.
Sokolik, I. N., Winker, D. M., Bergametti, G., Gillette, D. A., Carmichael, G., Kaufman, Y. J., Gomes, L., Schuetz, L., and Pen-ner, J. E.: Introduction to special section: Outstanding problems in quantifying the radiative impacts of mineral dust, J. Geophys. Res.-Atmos., 106, 18015–18027, doi:10.1029/2000JD900498, 2001.
Tanre, D., Haywood, J., Pelon, J., Leon, J. F., Chatenet, B., For-menti, P., Francis, P., Goloub, P., Highwood, E. J., and Myhre, G.: Measurement and modeling of the Saharan dust radiative im-pact: Overview of the Saharan Dust Experiment (SHADE), J. Geophys. Res.-Atmos., 108, 8574, doi:10.1029/2002JD003273, 2003.
Usher, C. R., Michel, A. E., and Grassian, V. H.: Reactions on Min-eral Dust, Chem. Rev., 103, 4883–4940, doi:10.1021/cr020657y, 2003.
Xue, H., Khalizov, A. F., Wang, L., Zheng, J., and Zhang, R.: Effects of dicarboxylic acid coating on the optical properties of soot, Chem. Chem. Phys., 11, 7869–7875, doi:10.1039/B904129J, 2009.
Yoshida, M., Haywood, J. M., Yokohata, T., Murakami, H., and Nakajima, T.: Spatial distribution of dust’s optical properties over the Sahara and Asia inferred from Moderate Resolution Imag-ing Spectroradiometer, Atmos. Chem. Phys., 13, 10827–10845, doi:10.5194/acp-13-10827-2013, 2013.
Zaveri, R. A., Shaw, W. J., Cziczo, D. J., Schmid, B., Ferrare, R. A., Alexander, M. L., Alexandrov, M., Alvarez, R. J., Arnott, W. P., Atkinson, D. B., Baidar, S., Banta, R. M., Barnard, J. C., Be-ranek, J., Berg, L. K., Brechtel, F., Brewer, W. A., Cahill, J. F., Cairns, B., Cappa, C. D., Chand, D., China, S., Comstock, J. M., Dubey, M. K., Easter, R. C., Erickson, M. H., Fast, J. D., Flo-erchinger, C., Flowers, B. A., Fortner, E., Gaffney, J. S., Gilles, M. K., Gorkowski, K., Gustafson, W. I., Gyawali, M., Hair, J., Hardesty, R. M., Harworth, J. W., Herndon, S., Hiranuma, N., Hostetler, C., Hubbe, J. M., Jayne, J. T., Jeong, H., Jobson, B. T., Kassianov, E. I., Kleinman, L. I., Kluzek, C., Knighton, B., Kole-sar, K. R., Kuang, C., Kubátová, A., Langford, A. O., Laskin, A., Laulainen, N., Marchbanks, R. D., Mazzoleni, C., Mei, F., Moffet, R. C., Nelson, D., Obland, M. D., Oetjen, H., Onasch, T. B., Ortega, I., Ottaviani, M., Pekour, M., Prather, K. A., Rad-ney, J. G., Rogers, R. R., Sandberg, S. P., Sedlacek, A., Senff, C. J., Senum, G., Setyan, A., Shilling, J. E., Shrivastava, M., Song, C., Springston, S. R., Subramanian, R., Suski, K., Tom-linson, J., Volkamer, R., Wallace, H. W., Wang, J., Weickmann, A. M., Worsnop, D. R., Yu, X.-Y., Zelenyuk, A., and Zhang, Q.: Overview of the 2010 Carbonaceous Aerosols and Radiative Effects Study (CARES), Atmos. Chem. Phys., 12, 7647–7687, doi:10.5194/acp-12-7647-2012, 2012.