ABSTRACT: Airport noise presents a major environmental impact arising from aircrafts airport activities, being one of the most complex and dificult mitigation problems. From the environmental point of view, airports cause serious problems to the population. Annoyance caused by noise was evaluated from the Day-Night Level (DNL) metrics proposed by Schultz. However, acoustic comfort is assessed separately during the day and at night, because the noise adverse effects are different. In this context, this paper presents a study on sound impact assessment related to noise annoyance caused by aircraft and aims to establish a method to analyze the sound impact on inhabited communities that are in the vicinity of airports. Besides, it proposes reviews available in literature and discusses noise annoyance exposure caused by transportation systems in an evolutive context. The study was based on criteria of evaluation levels panned for comfort of the community according to the Brazilian Standard ABNT/ NBR 10151. Therefore, a fuzzy logic system was developed in order to establish a relationship between the percentage of people highly annoyed by adverse noise effects around the airport, Day Equivalent Sound Level (LAeq
D
) and Night Equivalent Sound Level (LAeq
N
) metric descriptors.
KEYWORDS: Fuzzy logic systems, Annoyance, Metrics, Aircraft noise.
Fuzzy Modeling of Annoyance Caused by
Aircraft Noise Using
L
aeq
d
and
L
aeq
nMetrics
Tarcilene Heleno1, Jules Ghislain Slama1
INTRODUCTION
Noise exposure arising from air traic has been the main cause of conlicts between airports and nearby communities in most major cities around the world.
A paper entitled “Synthesis of social surveys on noise annoyance” has been seminal in a series of social research papers that summarize the annoyance data associated between the Day-Night Level metrics (DNL) and the number of highly annoyed people (Schultz, 1978).
he DNL metrics is associated to the average sound energy produced by the summation of aeronautical events over a 24-hour period, whence a 10 dB(A) penalty weighting is applied during the night. Until recently, the methodology used to assess the percentage of people who were highly annoyed by noise was inspired by Schultz’s proposal.
On the other hand, a new methodology based on fuzzy logic evaluation of criteria levels that take into account the community comfort according to the Brazilian Standard ABNT/NBR 10151 was proposed, establishing a relationship between the percentage of highly annoyed people by adverse noise efects around the airport, and LAeq
D and LAeqN metrics.
EVOLUTION OF STUDIES ON NOISE ANNOYANCE CAUSED BY AIR TRANSPORTATION
Research about exposure to aircrat noise began in the United States with the introduction of the jet aircrat in military bases in the 1950’s. his led to the publication of original scientiic papers which examined the exposure of the population to aircrat noise, which, in turn, paved the way to community response around airports. In the 1970’s,
1. Universidade Federal do Rio de Janeiro – Rio de Janeiro/RJ – Brazil
Author for correspondence: Jules Ghislain Slama | Departamento de Engenharia Mecânica/COPPE/UFRJ/C.P. 68.503 | CEP 21945-970 Rio de Janeiro/RJ – Brazil |
E-mail: [email protected]
the increased transportation noise coaxed extensive studies on the relationship between traic low, noise emission and community reaction (Fidell et al., 1988).
he Environmental Protection Agency (EPA) later related the complaint and annoyance data with the noise exposure level through of a dose-efect relationship, presenting an interpretation of the annoyance caused by sound levels with the DNL metrics, with terms widely used to evaluate the environmental noise in the community.
Nevertheless, it is worth noting that EPA did not relate the noise efects to people’s health, stress and hearing loss, restricting instead its recommendations to interference and annoyance activities while using the term community reaction
when referring to complaints (EPA, 1974).
Finally, by using a linear regression of social surveys in the neighborhood of airports, EPA developed a function correlating population response and noise levels, thus yielding from the following equation (Eq. 1) the percentage of highly annoyed (HA) people.
%HA = 1.8(DNL - 4.6) (1) But before this study, the approach to characterize adverse reactions to aircrat noise was centered on complaint prediction, complaints alone, and behavioral consequences.
SCHULTZ CURVE: RELATION BETWEEN DNL AND HIGHLY ANNOYED PEOPLE (HAP)
In 1978, Schultz proved that aircrat noise in diferent cities may be interpreted in a dose-efect relationship. Such original research procedures were based on various noise transportation studies (air, rail and roadways), as well as on the fragmentation between neighborhoods evenly exposed to noise in diferent degrees, and signiicantly impacted by noise in adjacent areas.
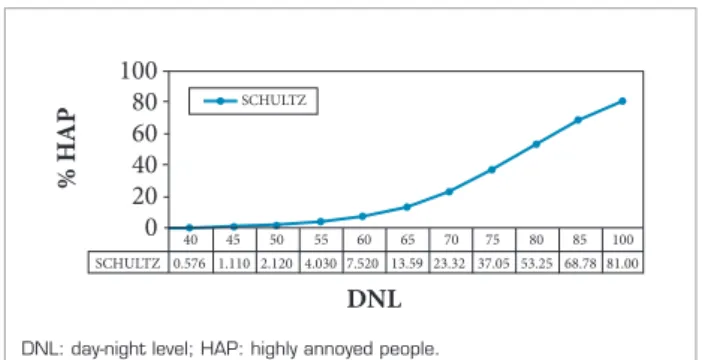
he curve shown in Fig. 1 yields a reasonable expression for the relationship between noise level and community response, and such graphic enables the quantiication of the highly annoyed people percentage according to the level of exposure to noise in the community.
Based on data from social surveys, Schultz proposed an equation (Eq.2), relating the percentage of HAP with DNL
metrics. He describes his research group by using a third degree polynomial function in an informal approach rather than a relation derived from linear regression analysis, and
this equation now allows to estimate %HAP, the percentage of HAP exposed to certain noise levels.
%HAP = 0.8533DNL - 0.0401DNL2 + 0.00047DNL3 (2)
THE INFLUENCE OF SCHULTZ’S ANALYSIS
Aterwards, the publication of Schultz’s results was followed by an update of its original curve whence a wider database was used to predict the annoyance caused by the exposure to transportation noise. In this update, a quadratic function was chosen instead of Schultz’s cubic curve, as shown in Eq. 3 (Fidell et al., 1988).
%HA = 78.9181 - 3.2645DNL + 0.0360DNL2 (3)
By reanalyzing the data from Fidell et al. (1988), Finegold et al. (1994) eventually published the results of a new meta-analysis that recommended the following equation to predict annoyance based on the inal 400 data points and dose-response relationship, as shown in Eq. 4. %HA =
1
1+e
(11.13-0.14DNL)(4)
THE CONTROVERSY OF SCHULTZ’S ANALYSIS
Although Schultz’s results may be regarded as conventional scientiic knowledge, his study remained controversial for years. While widely accepted in literature circles, it was strongly based on his personal prediction curves for community annoyance caused by transportation noise (Kryter, 1982).
Initially, Schultz’ surveys to assess annoyance were conducted in various manners, with the conversion of metrics to DNL noise levels, thus leading to much objection — especially
% H
AP
DNL SCHULTZ
SCHULTZ
0.576 1.110 2.120 4.030 7.520 13.59 23.32 37.05 53.25 68.78 81.00
100 80 60 40
40 45 50 55 60 65 70 75 80 85 100
20 0
Figure 1. Relation between day-night level metrics and % highly
annoyed people.
concerning the adoption of a personal deinition of annoyance as a variable depending on its dose-efect relationship.
Beside his procedures, Schultz’s subjective judgment to determine values that best corresponded to the term highly annoyed encountered strict criticism from sociologists, who accused him of manipulating results and questioned his lack of scientiic deinition in coining the term ‘highly annoyed’, which eventually resulted in repeating procedures for the researcher in order to obtain the same results.
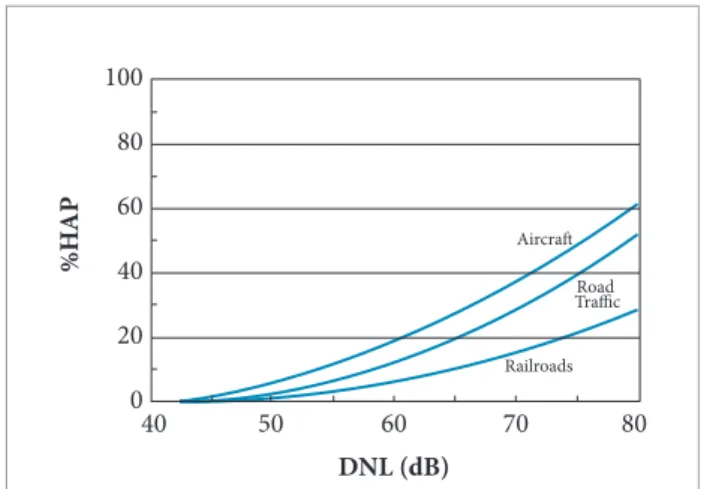
Other researchers inally contested the choice of a single relationship synthesizing sources in transportation noise: Schultz’ curve represents the average community response to three sources of transportation noise (air, rail & roadways). Is it possible for the same curve to represent the same noise annoyance caused by diferent transportation sources?
Miedema and Vos (1998) analyzed the level of noise annoyance caused by each source of transportation noise separately, listing the percentage of highly annoyed and DNL for each of them, as shown in Fig. 2. Such curves display a systematic diference between the three sources of transportation noise and show that, in general, aircrat noise causes more annoyance than that of roads or railways.
hese problems with Schultz’s analysis have been widely discussed in specialized circles. In this paper, we will emphasize the choice of DNL metrics; its capacity to estimate the percentage of HAP due to noise transportation; and its association with a weighted average sound energy produced
by all aircrat events that occurred in the last 24-hour period. his metric is given by Eq. 5.
A
DNL = 10log10 1010 dt + 22 L (t)
7
A
1010 dt 7 L (t)+10
22
1
3600 . 24 (5)
However, such metrics is not appropriate to represent annoyance in airports in which, despite the 10dB(A) correction, night time use restrictions exist, and because it is not the same as to separately consider the contribution of noise exposure between day and night-time.
METHODS AND DATA
FUZZY MODELING TO ASSESS NOISE ANNOYANCE
In the Brazilian legislation, acoustic comfort is assessed separately during day and night-time because adverse efects are diferent depending on the nature of the noise (ABNT/NBR 10151). Annoyance begins when comfort is lost, and noise exposure should be evaluated separately during daytime and night-time.
Hence, if one is to consider the use of LAeq
D
and LAeq
N to represent annoyance during day and
night-times, this metrics will define a new airport zone and provide a clear set of application curves to urban authorities, which will find their use to produce a compatible urban zone. Such metrics will also be more appropriate to assess the adverse effects of noise.
LAeq
D is deined as the average sound energy of events that
took place between 7h and 22h, as demonstrated in Eq. 6.
LAeqD= 10log10 dt P2
P2 (t) 22
7
1
3600 . 15 0 a
(6)
LAeq
N is deined as the sound energy of events that took
place between 22h and 7h, as demonstrated in Eq. 7.
LAeqN= 10log10 dt P2
P2 (t) 7
22
1
3600 . 9 0
a (7)
%H
AP
DNL (dB)
Aircraft
Road Traffic
Railroads
100
80
60
40
20
0
50
40 60 70 80
Figure 2. Value of highly annoyed people versus day-night
level for each source of transportation noise.
his paper presents an alternative approach based on fuzzy logic to estimate the percentage of HAP due to aircrat noise that uses LAeq
D and LAeqN metrics as input variables,
whence annoyance is the output.
Revoredo and Slama (2008) have shown results on the use of the DNL metrics according to LAeq
D and LAeqN metrics, as
shown in Eq. 8.
DNL = 10log10 15 . 1010 LAeqD
+ 90 . 1010 LAeqN
1
24 (8)
Basic fuzzy logic concepts are presented in the next section.
PRINCIPLES AND ELEMENTS OF FUZZY LOGIC
Fuzzy logic was developed by Zadeh (1965). A fuzzy set F
deined over a universe of discourse X is characterized by a membership function mF(x) which assumes values in the interval [0, 1].
A fuzzy set is a generalization of a classical set (crisp set) whose membership function assumes only two values, zero or one. hus, if X is the universe of discourse and its elements are denoted by x, then a fuzzy set A in X is deined as a set of ordered pairs:
A = {x, mA(x) / x ∈ X}
Where mA(x) is the membership function of x in A, that assigns a membership degree between 0 and 1 to each element of X.
Fuzzy conditional states the form IF A THEN B, where
A and B are terms with a fuzzy meaning, e.g., “IF day night sound level is high, THEN people are highly annoyed”. hese rules can be presented below:
Antecedent: x is to A’ as y is to B’
Rule (Ri): If x is Ai and y is Bi then z is Ci
Consequently: z is C’i
Where x and y are linguistic variables related to the fuzzy model and z is the output linguistic variable. A’, Ai, B’, Bi, Ci, C’i are fuzzy sets of the x, y and z.
Fuzzy algorithm is an ordered sequence of instructions in which some of the instructions may contain labels of fuzzy sets (Zadeh, 1973).
So, each rule is a fuzzy conditional statement and diferent fuzzy relations can derive from this.
he implementation of each rule is made by deining operators to process the input variables. he involvement function will set the output variable.
Fuzzy logic system is the nonlinear mapping of an input data vector into a scalar output (Mendel, 1995). he fuzzy system is deined by the aggregation of rules that make up the fuzzy algorithm through the use of connectives such as “IF”, “THEN”.
LINGUISTIC MODIFIERS OR HEDGES
From a fuzzy subset, through the linguistic modiiers, it’s possible to generate other subset of values for a linguistic variable from a small collection of primary terms. For the assessment of environmental impact, hedges or linguistic modiiers are a beneit that allows the adjustment to local values (Shepard, 2005).
A hedge h can be considered as an operator that modiies the fuzzy set M(u), representing the meaning of u, into the fuzzy set M(hu) (Zadeh, 1973b). Applied to fuzzy sets, hedges are modiiers that concentrate or dilute the support range of the fuzzy set. In other words, the hedge changes the shape of the membership curve so that support set values have a diferent range for the inclusion in the fuzzy set.
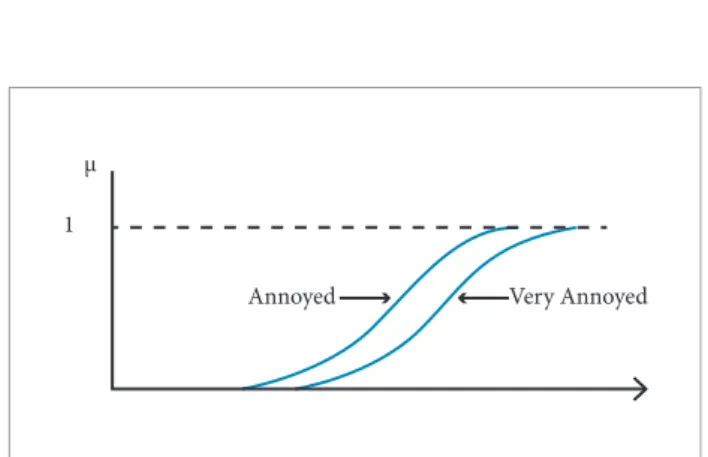
hus, according to Zadeh (1973), the “very” operator acting in a fuzzy set labeled x, this efect is shown in Fig. 3.
So, using the modiier “very” together with “not”, and the primary term annoyed, we obtain the fuzzy sets: very annoyed,
not very annoyed. he modiier very is deined by:
very x ≜ x2
1
Annoyed µ
Very Annoyed
he symbol ≜ stands for “equal by deinition”.
he modiiers “plus” and “minus” were used with the intention to decrease the degree related to concentration and dilation. hus, operators acting in a fuzzy set labeled x, “plus” and “minus” are deined by:
Plus x ≜ x1.25
Minus x ≜ x0.75
hen:
Plus Plus x = minus very x
hus modiier “highly” has been deined as:
highly = minus very very = x0.75 x2 x2 = x3
FUZZY LOGIC AND NOISE ANNOYANCE
he fuzzy logic is characterized by its ability to infer conclusions and generate responses from vague information, which is ambiguous, qualitatively incomplete and inaccurate. Its use is very simple and natural, leading to the construction of understandable systems that are easy to maintain.
he noise annoyance can be associated with objective variables, but mostly to subjective variables.
So, noise annoyance can be modeled by a fuzzy system. In this paper, the fuzzy system will assign a crisp value to a particular annoyance situation. In other words, a real number that represents the percentage of people disturbed by aircrat noise.
he fuzzy model developed here aims to assess annoyance caused by aircrat noise with LAeq
D and LAeqNmetrics.
ABNT/NBR 10151/1987 Standard uses LAeq
N to deine the
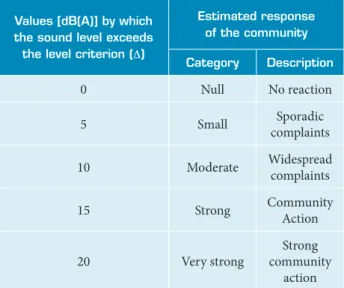
sound levels during daytime and night-time. It introduces a classiication that relates the estimated response of the community to noise as shown in Table 1. In essence, it is presented as a fuzzy system because each addition to level criterion corresponds to a response category.
According to the table, some fuzzy linguistic terms were chosen. hus, we will use these sound levels as a reference to estimate the annoyance through fuzzy logic, since the standard establishes a comfort level for diferent areas, such as: residential, mixed and industrial areas.
FUZZY MODEL DESCRIPTION
he fuzzy model was developed from a computational tool provided by the Fuzzy Logic toolbox, MATLAB version 7.0. Fuzzy model is described below.
Fuzziication
he fuzzy system consists of choosing input and output variables and determining for each of them which fuzzy subsets are associated with linguistic variables.
Linguistic variables are ideally suited to express the concepts found in environmental impact assessments (Shepard, 2005).
Linguistic variables can be deined by linguistic terms. In others words, these variables contain descriptive fuzzy terms, which represent a range within the variable.
In this work, LAeq
D and LAeqN were deined as input variables,
and annoyance is the output variable. he fuzzy linguistic terms were estimated according to the sound levels adopted by the ABNT/NBR 10151/1987.
he linguistic terms used to represent the fuzzy subsets of LAeq
D and LAeqN were “very low”, “low”, “medium”, “high”,
“very high”. And the linguistic terms used to characterize output variables were “null”, “small,” “moderate,” “strong” and “verystrong”.
Linguistic terms were deined according to the Brazilian standard ABNT/NBR 10151/1987. When sound level exceeds the level criterion, there is an estimated response of the community to noise.
MEMBERSHIP FUNCTION
A triangular fuzzy set might be used to create a fuzzy number from a measured, crisp value, but otherwise it would not represent the underlying semantics of the variable.
Table 1. Community’s response to noise.
Values [dB(A)] by which the sound level exceeds
the level criterion (Δ)
Estimated response of the community
Category Description
0 Null No reaction
5 Small Sporadic
complaints
10 Moderate Widespread
complaints
15 Strong Community
Action
20 Very strong
Strong community
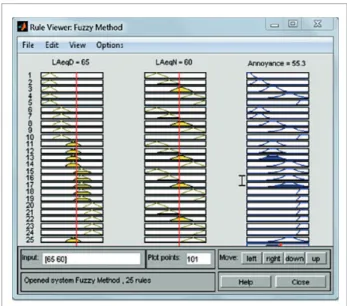
Figure 4. Window of the toolbox Fuzzy with input and output values.
Sigmoid and bell-shaped membership curves are extensively used in the environmental impact assessment to represent the meaning of measured components in the existing environment and predicted changes for alternatives (Shepard, 2005; Eller, 2009).
In the model proposed, triangular membership curves were used for input variables and bell-shaped membership curves for output ones.
Implication and Aggregation Rules
Fuzzy sets are created by the application of the rule base and aggregation methods. hese fuzzy sets relect the degree of truth contained in the model and how well the model’s rules respond to the model’s input data.
According to the input and output variables, 25 rules were developed. To illustrate, we have:
Rule 1: IF L
AeqD is very low and LAeqN is very low, THEN the
annoyance is null.
Rule 2: IF L
AeqD is very high and LAeqN is low, THEN the
annoyance is very strong.
By using this fuzzy system, the annoyance has been related to the response estimated population for different combinations of LAeq
D and LAeqN in accordance with
acceptable sound levels for each kind of residential areas of ABNT/NBR 10151.
Defuzziication
Latest, we have to choose the defuzziication method to convert fuzzy statements into a crisp value in order to obtain the percentage of annoyed people. he defuzziication process was performed by the centroid method.
We consider the sound levels of ABNT/NBR 10151 as a condition of acoustic comfort, particularly in the case of residential use.
In this work the ABNT/NBR 10151 received more emphasis for residential use: “Strictly Urban, Residential, School or Hospital Areas” – with LAeq
D=50 and LAeqN=45 and
“Predominantly Residential Mixed Areas” – with LAeq
D=55
and LAeq
N=50.
In the irst condition, Strictly Urban, Residential, School or Hospital Areas with LAeq
D=50 and LAeqN=45, sound levels are
compatible to a condition of acoustic comfort.
While sound levels increase, they are no longer compatible with residential use and, gradually, annoyance appears.
he same was done to the second condition, Predominantly Residential Mixed Areas with LAeq
D=55 and LAeqN=50.
Figure 4 presents an example of the windows that open in the toolbox, in which where we insert the LAeq
D and LAeqNvalues
and obtain the annoyance percentage. In this work, various combinations of LAeq
D and LAeqN were simulated. On the other
hand, we need the percentage of the HAP, so we applied the modiier “highly” in the annoyed function.
Hedge
he hedge has been used to generate the subset “highly annoyed” from the subset “annoyed”. So, according to Zadeh’s proposal, the “highly annoyed” function corresponds to a cubic function applied to “annoyed people”.
RESULTS
ANALYSIS OF RESULTS ACCORDING TO THE BRAZILIAN STANDARD ABNT/NBR 10151
Table 2. Residential condition: Strictly Urban, Residential, School or Hospital Areas with LAeq
D
=50 and LAeqN=45.
Δ LAeq
D
LAeq
N
HAP (%) Fuzzy
0 50 45 0.03
5 55 50 0.98
10 60 55 3.22
15 65 60 15.92
20 70 65 44.42
Table 3. Residential condition: Predominantly Residential
Mixed Areas with LAeq
D
=55 and LAeq
N
=50.
Δ LAeq
D
LAeq
N
HAP (%) Fuzzy
0 55 50 0.03
5 60 55 0.98
10 65 60 3.22
15 70 65 15.92
20 75 70 44.42
%H
AP
80 70 60 50 40 30 20 10 0
Sound Level - dB(A)
Schultz (DNL) LAeqD=50 and LAeqN=45
LAeqD=55 and LAeqN=50
45 50 55 60 65 70 75 80 85
Figure 5. Curves obtained from fuzzy model to %HAP in
each condition.
Schultz’s results were obtained from Eq. 3, which related the percentage of HAP to DNL metric. he results are presented in Tables 2 and 3.
he curves have the same behavior, with a single horizontal shit of 5 dB (A) between them, as shown in Fig. 5. From a certain noise level, the percentage of HAP obtained from the fuzzy modeling grows at a rate higher than the Schultz’s curve, depending on the type of area.
he percentage of HAP (slowly increasing) is low for low levels, because noise levels are appropriate for this use. However, for higher levels the percentage of HAP grows signiicantly.
Residents in Strictly Urban, Residential, School or Hospital Areas with LAeq
D=50 and LAeqN=45 are used to very low
noise levels. herefore, this condition (blue curve) is more appropriate to assess the annoyance.
Both curves show an abrupt increase of the curve inclination, which is coherent with the shape of noise perception by humans according to WHO for high levels. Usually, annoyance comes earlier, and the perception depends on environmental noise level and type of area. LAeq
D and LAeqN
levels are used to charactere a region in accordance with the assessment criterion level.
he fuzzy model developed to evaluate the noise annoyance takes into account the daytime and night-time noise levels for each area. As a consequence, %HAP was obtained for various situations.
CONCLUSION
he fuzzy system assessing aircrat noise annoyance is based on a set of logical conditions that follow noise level recommendations in residential areas deined by ABNT/NBR 10151. he estimated community response to noise considered in the previous version of this Standard was important to deine the variables of the fuzzy model.
he fuzzy model relates the LAeq
D and LAeqN noise metrics
and the percentage of HAP to evaluate the annoyance using fuzzy logic.
For low values of noise levels, the predicted annoyance will be less than that proposed by Schultz, while for higher levels, the annoyance predicted will present a much greater value than that in Schultz’s model.
he term “highly annoyed” has been used according to the deinition proposed by Zadeh, and this tool is appropriate to adjust the values.
he choice of triangular membership functions is valid to
LAeq
D and LAeqN variables due to the fact that such functions can
be easily adjusted through an optimization process based on genetic algorithms.
represent the noise annoyance in cases of the assessment of environmental impact.
From the methodology presented herein, it is possible to develop fuzzy systems for environmental impact assessment from other sources of noise.
ACKNOWLEDGMENTS
he authors would like to thank Fundação de Amparo à Pesquisa do Estado do Rio de Janeiro (FAPERJ), CNPq, and CAPES for the inancial support for the development of this work.
REFERENCES
ABNT, NBR 10151, 1987, “Acoustics - Assessment of noise in populated areas to ensure the comfort of the community”. Procedure, Rio de Janeiro.
ABNT, NBR 10151, 2000, “Acoustics - Assessment of noise in populated areas to ensure the comfort of the community”. Procedure, Rio de Janeiro.
Eller, R.A.G., 2009, “Modelo de geração de tarifa de ruído aeronáutico utilizando Lógica Fuzzy”, Tese (Doutorado), Instituto Tecnológico de Aeronáutica, São José dos Campos.
EPA, 1974, “Information on Levels of Environmental Noise Requisite to Protect Public Health and Welfare with an Adequate Margin of Safety’’ U.S. Environmental Protection Agency, EPA/ ONAC, Washington DC.
Fidell, S., Schultz, T.J. and Green, D., 1988, “A theoretical interpretation of the prevalence rate of noise-induced annoyance in residential populations”. Journal of the Acoustical Society of America. Vol. 84, pp. 2109-2113.
Finegold, L., Harris, C.S. and von Gierke, H.E., 1994, “Community annoyance and sleep disturbance: Updated criteria for assessing the impacts of general transportation noise on people”. Noise Control Engineering Journal, Vol. 42, pp. 25-30.
Kryter, K.D., 1982, “Community annoyance from aircraft and ground vehicle noise”. Journal of the Acoustical Society of America, Vol. 72, pp. 1222-1242.
Mendel, M.J., 1995, “Fuzzy Logic Systems for Engineering: A Tutorial”, IEEE.
Miedema, H.M.E. and Vos, H., 1998, “Exposure-response relationships for transportation noise”. Journal of the Acoustical Society of America, Vol. 104, pp. 3432-3445.
Schultz, T.J., 1978, “Synthesis of social surveys on noise annoyance”. Journal of Acoustical Society of America, Vol. 64, pp. 377-405.
Shepard, R.B., 2005, “Quantifying Environmental Impact Assessments Using Fuzzy Logic”. Springer Science + Business Media, Inc.
Slama, J., Revoredo, T. and Mora-Camino, F.A.C., 2008, “Is DNL appropriate for airport noise zoning”, Acoustics Paris, pp. 1967-1971.
WHO, 1999, “Guidelines for Community Noise”. Geneva, Switzerland. Edited by B., Lindvall, T., Schwela. Retrieved in May 15, 2012, from http://www.who.int/docstore/peh/noise/guidelines2.html
Zadeh, L.A., 1965, “Fuzzy Sets”. Information and Control, Vol. 8, pp. 338-353.