Abstract
A relatively complete procedure for high cycle fatigue life assess-ment of the engine components is outlined in the present paper. The piston is examined as a typical component of the engine. In this regard, combustion process and transient heat transfer simu-lations, determination of the instantaneous variations of the pres-sure and temperature in the combustion chamber, kinematic and dynamic analyses of the moving parts of the engine, thermoelastic stress analyses, and fatigue life analyses are accomplished. Results of the simulation are compared with the test data to verify the results. The heat transfer results are validated by the experi-mental results measured by the Templugs. The nonlinear mul-tipoint contact constraints are modeled accurately. Results of the more accurate available fatigue criteria are compared with those of a fatigue criterion recently proposed by the first author. These results are also evaluated by comparing them with the experi-mental durability tests. The presented procedure may be used, e.g., to decide whether it is suitable to convert a gasoline-based engine to a bi-fuel one. Results of the various thermomechanical fatigue analyses performed reveal that the piston life decreases considerably when natural gas is used instead of gasoline.
Keywords
Heat transfer and combustion simulation; Engine; Piston; Fatigue failure; Experimental results.
Experimentally Validated Combustion and Piston Fatigue
Life Evaluation Procedures for the Bi-Fuel Engines, Using
an Integral-Type Fatigue Criterion
1 INTRODUCTION
Accuracy of the employed design procedure may affect the size, cost, and durability of the resulting mechanical assemblies. Due to various aspects of the internal combustion engines, the combustion, heat transfer, mechanism, stress, and fatigue failure analyses have often been treated in separate
M. Shariyat a * J. Fathi Sola b S.A. Jazayeri c
a* Professor, Faculty of Mechanical En-gineering, K.N. Toosi University of Technology, Tehran, Iran. Email: [email protected] (Corresponding author)
b Ph.D. Candidate, Faculty of Mechani-cal Engineering, K.N. Toosi University of Technology, Tehran, Iran.
Email: [email protected] c Associate Professor, Faculty of Mechanical Engineering, K.N. Toosi University of Technology, Tehran, Iran. Email: [email protected]
http://dx.doi.org/10.1590/1679-78251937
packages. However, a complete knowledge about these analyses may lead to an integrated and op-timized design. On the other hand, due to some fuel resources management programs, some re-searchers have proposed using the natural gas, e.g. in the form of compressed natural gas (CNG), as an alternative fuel. Due to different combustion characteristics, employing different fuels in the gasoline-based engines leads to some side effects such as performance degradation, increase in the thermal losses, emission, and lower fatigue lives for the components. Piston as a key component of the engine that is vulnerable to severe cyclic and transient thermal and mechanical loads can direct-ly be affected by the mentioned conversion (Shariyat and Djamshidi 2009).
While some researchers modeled the combustion process (Kajiwara 2002), some researchers have investigated the thermoelastic stresses caused by the combustion process. Ivaschenko et al. (1980) studied the stresses in a piston of a diesel engine. They employed an analytical method on the basis of solving Laplace’s equation to determine the von Mises stresses in specific regions of the piston, assum-ing a quasi-static condition. Valdes et al. (2001) performed velocity, acceleration, and finite element transient thermal and stress analyses for the piston. Some researches were devoted to fatigue life as-sessment under thermomechanical loads. Su et al. (2002) performed a thermoelastic high cycle fatigue and creep analysis in ABAQUS for the engine cylinder head and validated their stress analysis results by means of some installed strain gauges. Silva (2006) analyzed the thermomechanical damage fa-tigues in the pistons. He stated that the wear, temperature gradient, and fatigue-related phenomena are the main origins of the pistons damages and reported that the regions located at the pin holes, piston crown, grooves and skirt, are more critical. A finite element linear static analysis, using COS-MOS was used for stress and temperature determination during the combustion.
2 SIMULATION OF THE COMBUSTION PROCESS
Accurate modeling of the combustion process is a key issue for comparing performances of the gaso-line and bi-fuel engines and consequently, estimation of the fatigue lives. In this regard, the com-bustion is modeled for an inline four-cylinder spark-ignited (SI) gasoline-based engine. The relevant engine information is listed in Table 1. Among the traditional models, the more accurate open sys-tem model which covers all the stages is employed to model the combustion process.
Information of the gasoline and the natural gas is given in Table 2. The combustion equations of the gasoline (
C H
8.26 15.5) and the compact natural gas (CNG) in the stoichiometric condition are as follows:2 2 2 2 2
molar mass
CNG+x(O +3.76N ) 1.0453CO +3.9616/2 H O+x*3.76N
x=1.0453+3.9616/4+.02=2.0157
[AF] =2.0157(1+3.76)=9.595
[AF] =15.27
(1)
8.26 15.5 2 2 2 2 2
molar mass
C H +12.135(O +3.76N ) 8.26CO +15.5/2 H O+45.6276N
[AF] =12.135(1+3.76)=57.76
[AF] =14.1
(2)
where
[AF]
molar and[AF]
mass represent the molar and mass air-fuel ratios, respectively.Quantity value
Cylinder diameter 78.6 mm
Stroke 85 mm
Connecting rod length 134.5 mm
Piston eccentricity 0.8 mm
Compression ratio 11
Cylinder volume 1650 cc
Maximum RPM 6000 RPM
Distance between the piston pin and the C.G. of the connecting rod 40.9 mm
Engine cylinder head heat transfer area 6800 mm2
Piston mass 0.317 kg
Connecting rod mass 0.5 kg
Inertia moment of the connecting rod 0.001738 kg.m2
Height of the piston 51.7 mm
Location of the piston hole relative to the top surface 29.7 mm
A two zone Wiebe function is used to simulate the combustion. Crank angles corresponding to the combustion initiation and the maximum pressure are measured experimentally and given in Table 3. Since a full fatigue analysis requires an accurate full time history of the applied thermome-chanical loads, the combustion process is simulated for different RPMs. The real to stoichiometric fuel ratios measured through experiments using results of the combustion analysis (Eqs. 1 and 2) are given in Table 4 for different RPMs. It is known that the stoichiometric or theoretical combus-tion is an ideal combuscombus-tion process wherein the fuel is burned completely. Results of Table 4 reveal that results of the stoichiometric calculations of the CNG (Eq. 1) are almost coincident with the real ones and to some extent, independent of the RPM of the engine whereas results of the gasoline (Eq. 2), are dependent on the RPM so that in high RPMs, amount of the unburned fuel, soot, smoke, and carbon monoxide increase.
Fuel type Chemical formula Molecular weight QLHVMj/kg
Gasoline C8.26H15.5 114.82kg 44
Natural gas C1.0453 H3.9616 O N0.02 0.09 18.13 kg 44.98
Table 2: Information of the gasoline and the natural gas. QLHV is the low heating value of the reference fuels.
Engine RPM Ignition advance (BTDC) Maximum pressure angle (ATDC) Gasoline Natural gas Gasoline Natural gas
2000 5 23 32 14
3500 15 26 19.5 11
6000 14 31 21 8
Table 3: The measured crank angles corresponding to the combustion initiation and the maximum pressure at the full load condition (Heywood 1988).
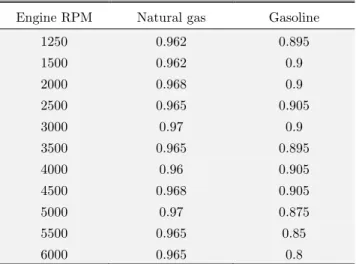
Engine RPM Natural gas Gasoline
1250 0.962 0.895
1500 0.962 0.9
2000 0.968 0.9
2500 0.965 0.905
3000 0.97 0.9
3500 0.965 0.895
4000 0.96 0.905
4500 0.968 0.905
5000 0.97 0.875
5500 0.965 0.85
6000 0.965 0.8
Combustion is modeled using quasi dimensional models. In this regard, a two zone model is adopted and analyzed in our computer code. The heat release is evaluated using the same code con-sidering a two zone Wiebe model (Ferguson and Kirkpatrick 2000).
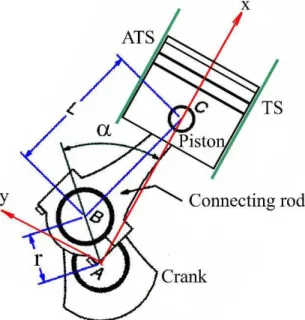
The delay in the combustion initiation is predicted based on Benson-Whitehouse model (Ramos 1992). Heat transfer of the combustion chamber is investigated based on the modified Woschni’s model (Ferguson and Kirkpatrick 2000). The governing equations of the mean temperature, the mean convection heat transfer coefficient, and the rates of pressure and energy release per crank angle may be found using the first law of thermodynamics. The employed geometric parameters are shown in Fig. 1.
Figure 1: Geometric parameters of the crank-piston mechanism.
It can be shown that variations of the pressure in the combustion chamber can be determined based on the following differential equation (Abu-Nada et al. 2008):
1 b w
in
dx dQ
dP P dV
Q
d V d d V d
(3)
where:
2 2 2 2
( ) sin cos / 2 ( ( ) ) /
w
g g w
dQ
h b r l l r r b T T N
d (4)
1 2
2 2 2
1 ( sin ) cos sin 8
dV b S
r d
(5)
w
Q
, hg, Tg, andT
w are respectively, the instantaneous pressure, Wiebe function, total amount ofheat input due to combustion of the fuel in one cycle f, the heat energy transferred to the ambient through the cylinder wall, Woschni’s convective heat transfer coefficient (Woschni 1967; Karaman-gil et al. 2006), temperature of the combustion products, and temperature of the cylinder wall. Sub-scripts w and g stand for the cylinder wall and gasses, respectively. The derivation procedure (per-formed by the authors) is not included here due to space restrictions. The resulted partial differen-tial equations are solved by the Runge-Kutta numerical time integration method.
These data are employed to perform the required heat transfer analyses. The theoretically de-termined temperature distributions are validated by the experimental results measured by the high temperature plugs (templugs).
3 DYNAMIC FORCES, THERMAL, AND THERMOELASTIC STRESS ANALYSES
In the present research, the forces are determined based on the written Matlab code according to a textbook by Erdman et al. (2001), and the ABAQUS CAE software, through exactly modeling the contact and large displacements non-linearities. Denoting the distance between center of gravity of the connecting rod to center of the gudgeon pin by b and angle between the connecting rod and the sliding direction by
, one may write the acceleration of the center of gravity of the connecting rod as (Erdman et al. 2001):
2
2
sin cos cos sin
p
G b b apiston b b
a i j (6)
where i and j are respectively, the base vectors in the x and y directions of Fig. 1. Therefore, denot-ing the inertial forces transferred between the piston and the connectdenot-ing rod and between the con-necting rod and the crank shaft by
F
1 andF
2 respectively, one may write the following equation based on Newton’s second law:
1 1 2in ( ) in cos
cos sin
( ) cos cos
in ( ) in cos
c s s s s sin s os ( )
in sin cos
cos sin
( )
G g c Gx Gy
g
G g c Gx Gy
g
G g c Gx Gy
g c Gx
a
n
a
I F l b m a a
F
l b b
I F l b m a a
F
l b cos b cos
I F bm a a
F m a
l b cos b
l F l c F os F l
2in in cos
co
s s
sin s
( )
G g c Gx
n
Gy g
I F bm a a
F
l b cos b c
F o l s (7)
The frictional forces including the mixed and hydrodynamic ones and the distributed inertia forces are taken into account. Following detailed studies by Thring (1992) and Dowson et al. (1996), the mean effective friction traction may be determined from:
2
6.89 i 0.088 0.182 1.33 2.38 10
mep c c p
a
P
f r r S
P
(8)
where
P
i,P
a,r
c, and Sp are the intake pressure, atmospheric pressure, compression ratio of theengine, and the mean speed of the piston, respectively. In the considered engine, SAE10w-40 lubri-cant oil whose dynamic viscosity varies with temperature as follows, is used:
1.14 10exp 1033.34120.8
T e
T
(9)
Based on the convection heat transfer between the piston’s top surface and the combustion mixture, heat transfer between the rings and the skirt and the cylinder and consequently, the cool-ant water, the heat transfer between the gudgeon pin and the coolcool-ant oil film, the thermal loads of the piston are determined. Finally, a thermoelastic stress analysis is performed. Details of the type of the employed constitutive model and the temperature-dependent material properties are men-tioned in the results section.
4 THE FATIGUE LIFE ASSESSMENT ALGORITHM
As may be expected, the resulting thermoelastic stress components vary in a non-proportional man-ner. Furthermore, they fluctuate with non-zero mean stresses. A number of evaluations available in the literature (Socie, 1987; Li et al., 2011; Papuga, 2011; Fatemi and Shamsaei, 2011; Castro et al., 2014) demonstrate that satisfactory correlations can be obtained using the critical plane approach, both in the low and high cycle fatigue regimes. These satisfactory correlations were observed for a number of engineering materials, notch geometries, and loading conditions (including non-proportional histories with or without superimposed mean stresses).
Based on some observations (Papuga, 2011; Castro et al., 2014) and the comprehensive discus-sions already published by Shariyat (2008; 2009a,b; 2010), the accuracy of the traditional fatigue life assessment criteria as well as the available critical plane high cycle fatigue (HCF) criteria de-pends on a number of factors, e.g., accuracy of the material constants, experience of the user in modeling the loading events, and accuracy of the computed stresses and strains used as input in the fatigue criterion. Although the traditional von Mises criterion that is the base for many well-known fatigue analysis softwares, such as MSC Fatigue and FEMFAT, may lead to erroneous results in the mentioned circumstances, its results may be enhanced by employing Sine’s idea of the mean stress (Socie and Marquis 2000; Schijve 2009) and incorporating the mean stress effect, using Goodman, Gerber, or Soderberg fatigue failure relations:
Goodman’s linear relation: a m 1
N u
Gerber’s parabolic relation:
2 1
a m
N u
(11)
Soderberg’s linear relation: a m 1
N y
(12)where
a,
m,
N,
y, and
u are the amplitude, mean stress, equivalent reversible (fatiguestrength), yield, and ultimate stresses, respectively.
Among the critical plane high cycle fatigue (HCF) criteria, Findley’s criterion has been proven to be the most accurate one (Bernasconi et al. 2008). Findley’s criterion may be expressed as (Find-ley 1959):
max( , , )
(akn) f (13)
where:
2
1 1 1
1 1
1 1
2 / ( )
,
4( / 1)
2 / 1
R R R
R R
R R
k
f
(14)
According to this criterion, the critical plane is a plane where max , , ,t(
ak
n) occurs.
, ,and
are the Eulerian angles (Fig. 2) and t denotes the time.
a and
n are the shear stress amplitude and the normal stress component, respectively. Denoting the fatigue strength amplitudes corresponding to the specified
R
min /
max
and
R
min/
max
ratios, respectively, by
R andR
, Shariyat (2009a) has proposed a modified Findley’s criterion as:
, , ,
2 1
max t( ) / 1 /
eq a k n k R R
(15)Figure 2: Resultant shear and normal stresses acting on a representative material plane.
Modified Goodman’s line equation: 1 1 1 0 0 m R m R u R m (16) Gerber’s equation: 2 1 1 m
R R u
(17)
Similar equations may be written for
R. Since the minus and plus mean stresses appear with similar effects in Gerber’s equation, Goodman’s equation is used in the present research to account for the mean stress effect.It is known that Liu-Zener criterion is the most accurate criterion among all the available high cycle fatigue criteria. Recently, Shariyat (2009b) has modified this criterion and through verifying results of the criterion by many experimental results (including one-, two-, and three-dimensional load conditions), proved that the proposed criterion leads to more accurate results. However, the criterion has not been examined for situations where thermoelastic stresses are induced. In the present work results of the mentioned criterion are examined for the thermoelastic stress fields. In contrast to the available HCF criteria, Shariyat’s criterion has been proposed based on tracing the microscopic instantaneous fatigue failures and is suitable for non-proportional three-dimensional stress fields with stress components that vary with random frequencies and random amplitudes. This integral-type criterion has the following form:
2
2 2
0 0
15 ( )sin
8 d d H eq
(18)where the normal and resultant shear components acting on the material sections are (Shariyat, 2009b):
2
1/2 2
sin sin 2 cos2 cos ( sin cos )
2
sin cos cos2 sin 2 cos2 cos sin
2 2
x y
xy xz yz
x y x y
xy z xz yz
2 2sin cos2 sin 2 sin 2 cos sin cos
2 2
x y x y
xy xz yz z
(19)
and
H is the spherical stress component and:
2 2 2 2 1 2 2 21 (189 108 9 12 21 81 126 54) ,
45 1 3
1 2 1
2
1 1
1
1 1 1
1 (6 3 9 ) , 1 (3 9 ) ,
2 1 3 30 1 3
1 / 1 /
1 /
, ,
1 / 1 / 1 /
H H H H H H
R m u R m u
R m u
R m u R m u R m u
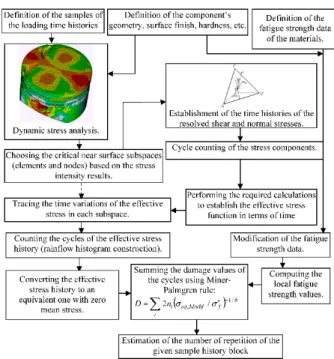
The related fatigue life assessment flow chart is illustrated in Fig. 3.
Figure 3: Flow chart of the employed fatigue life assessment algorithm.
5 RESULTS
Properties of the gasoline vary with temperature. Since temperature of the fuel varies during the 720 degrees rotation of the crank (one combustion cycle), the following equation is used to predict the properties values at any specified temperature:
2 3 2
1 2. 3. 4. 5/
p fuel f f f f f
C A A TA T A T A T (21)
The coefficients Af1 to Af5 are given in Table 5.
Fuel Afs Af1 Af2 Af3 Af4 Af5
15.5 8.26 H
C 14.64 -24.078 256.63 -201.68 64.75 0.5808
13.1 7.26H
C 14.37 -22.501 277.99 -177.26 56.048 0.4845
While properties of the air may be determined based on the available references, variations of the combustion products may be determined based on the following equation (
= T/100) (Borgnakke and Sonntag 2009):2
2
2
2
-1.5 -2 -3
0.5 2
0.25 0.5
0.1.5 -1.5 -2
39.06 - 512.79 1072.72 -820.4
-37.57 30.529 - 4.1034 .024198
143.05 -183.54 82.751 - 3.6989
37.432 .020102 -178.57 236.88
O
p N
p H
p CO
p O
C
C
C
C
(22)
Property of the exhaust gases may be determined from (Borgnakke and Sonntag 2009):
2 2 2 2
tan 8.26 15.5 / 2 45.6276
p N p H O p CO p O
p Pollu t
C C C C
C
(23)
Fig. 4 compares the pressure of the combustion mixture versus the crank angle curves predicted by the theoretical results (results of our computer code) with those measured experimentally for the gasoline and CNG fuels, for the 6000 RPM situation (corresponds to the maximum power), as a typical case. The theoretical results are in a good agreement with the experimental results. Fur-thermore, results of Figs. 4 reveal that replacing the gasoline with the natural gas may lead to sig-nificant changes in the resulting pressure profile in 6000 RPM.
Figure 4: In-cylinder pressure variations versus crank angle for a set of theoretical and experimental results using gasoline and natural gas, at 6000 RPM.
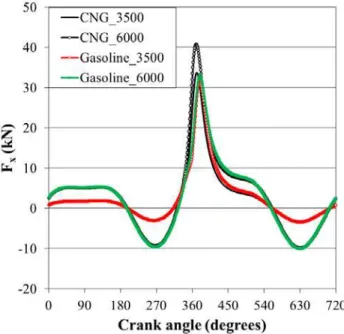
6000 RPM, respectively. Since the temperature distributions are somewhat identical, due to higher coefficient of the convection heat transfer, it seems that the thermal losses may be higher for the CNG engine. Figs. 7 and 8 illustrate the vertical and horizontal components of the resultant forces exerted on the piston, respectively for the gasoline and CNG engines at 3500 (corresponding to the maximum torque) and 6000 RPMs. As may be noted from Figs. 7 and 8, the maximum forces are exerted slightly after the combustion initiation. Furthermore, the vertical component is the domi-nant one.
Figure 5: Comparison of the mixture temperature for the gasoline and CNG engines at 6000 RPM.
Figure 7: A comparison among the vertical components of the resultant forces acting on the piston at 3500 and 6000 RPMs, for the gasoline and CNG engines.
Figure 8: A comparison among the horizontal components of the resultant forces acting on the piston at 3500 and 6000 RPMs, for the gasoline and CNG engines.
and McMillan 2004) and consequently, high whereas at the midway point, the friction is of a hy-drodynamic nature and leads to small frictional forces.
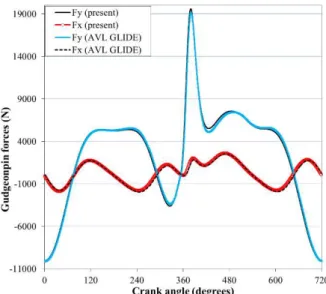
Figure 10 illustrates the force components exerted by the gudgeon pin on the piston and vice versa based on our results and results of the AVL-GLIDE software.
Figure 9: Variations of the frictional forces for the thrust side of the piston’s skirt at 3500 and 6000 RPMs for gasoline and CNG engines.
Figure 10: A comparison between present and AVL-Glide software predictions for force components exerted by the gudgeon pin on the piston (CNG engine at 6000RPM).
mean temperature of the lubricant film and the proper coefficients of the convection heat transfer are used.
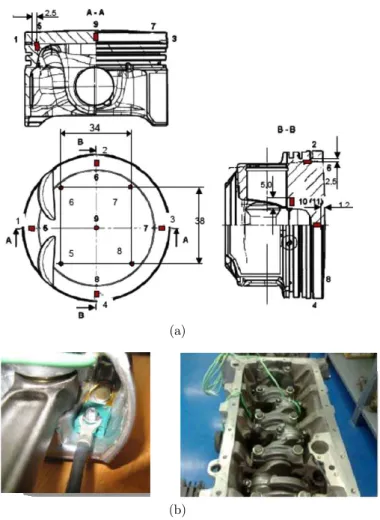
Figure 11 illustrates the temperature rise distributions of the piston in the 6000 RPM for both gasoline and CNG engines, as typical results. The temperature rise distributions have been validat-ed experimentally by means of the TEMPLUGs shown in Fig. 12. Comparison of the experimental and theoretical results reported in Table 6 for the gasoline fuel, generally verifies the present analyt-ical approach.
(a) (b)
Figure 11: Temperature rise (°C) distributions in 6000 RPM for the (a) gasoline, and (b) CNG engines.
Templug location Experimental results Theoretical results
1 222 220
2 235 229
3 207 205
4 228 225
5 244 242
6 249 245
7 238 235
8 230 226
9 237 247
10 226 220
11 230 225
(a)
(b)
Figure 12: The temperature plugs used to validate the computed temperatures: (a) locations and (b) installation.
MAHLE GmbH (2012) for the general M124 piston alloy. A typical trend of variations of the coeffi-cients of the convection heat transfer was shown in Fig. 6, for the gasoline and CNG engines.
Material property Temperature (°C) Value
Young’s Modulus (GPa) 20 79
150 76
250 72
350 64
Thermal conductivity (W/mK) 20 141
350 152
Poisson ratio - 0.33
Density (kg/m3) 20 2680
Thermal expansion (10-6m/mK) 20-100 19.6
20-200 20.6
20-300 21.4
20-400 22.1
Specific heat (kj/kgK) - 864
Tensile strength (MPa) -200 328
-100 296
20 241
150 207
250 117
350 53
Melting point (°C) - 571
Fatigue strength (MPa) 20 108
150 84
250 53
350 26
Table 7: Temperature-dependent mechanical and thermal material properties of the pistons fabricated from M124 alloy with T5 and T7 heat treatments, as well as the monotonic (static) and fatigue strengths.
Since the material properties reported in Table 7 cover a wide range of the temperatures, they may be used for thermoelastic and fatigue analyses of all points of the piston. The material proper-ties may be interpolated for temperatures that are not appeared in Table 7. However, the most critical region has a specific temperature that fluctuates slightly with time.
ring and skirt regions. The heat transfer coefficients are calibrated further based on the experi-mental information gathered from the Templug sensors.
The relevant mechanical von Mises stresses are shown in Fig. 13, for the most critical situation (370 degrees of the crank angle) at 6000 RPM for the CNG engine, as representative results. The maximum calculated temperature is 252 (°C) which shows a good agreement with the result meas-ured by the templugs (249 °C).
Regions with greatest von Mises equivalent stresses may not be generally considered as regions with worst fatigue lives. Fig. 14 shows the most critical element in the thermomechanical loading. This element is detected by fatigue results obtained by the MSC Fatigue software (as explained later) and present results. Time variations of the von Mises equivalent mechanical stress of the crit-ical region are depicted in Fig. 15 for a complete combustion cycle of the gasoline as well as CNG engines, for 3500 and 6000 RPMs. From these figures, it may be deduced that the maximum and minimum stresses occur at crank angles of 370 and 1 degrees, respectively.
Figure 13: The resulting mechanical von Mises stresses at 6000 RPM, for the CNG engine.
As has been mentioned in Sec. 4, in the present research, the fatigue life results are extracted based on the modified von Mises, modified version of Findley and Liu-Zener theories proposed by Shariyat, and the experimental methods. The employed fatigue life assessment algorithm has not been proposed by any other authors before. The equivalent Findley stresses (Eq. 11) are computed at the critical points of the piston and the relevant fatigue lives have been calculated based on com-puter codes written by the authors, for the 720 degrees rotation of the crank. Some fatigue damages predicted by different approaches, various engine RPMs and fuel types are shown in Table 8 for the critical region, as typical results.
Figure 15: Variations of the von Mises stress of the critical node for the complete combustion cycle of the gasoline as well as CNG engines, at 3500 and 6000 RPMs.
CNG (6000RPM) Gasoline
(6000RPM) CNG
(3500 RPM) Gasoline
(3500RPM) Fatigue life assessment approach
3.5025e-9 1.6211e-11
5.8102e-10 2.1316e-10
von Mises (Goodman mean stress correction)
1.9938e-9 5.6012e-12
1.6768e-10 6.3924e-11
von Mises (Gerber mean stress correction)
9.3645e-9 4.1897e-11
2.1891e-9 7.2651e-10
von Mises (Soderberg mean stress correction)
8.1219e-11 9.0612e-13
7.9051e-12 17.4480e-12
Modified Findley
1.9069e-10 6.9281e-13
6.6004e-11 5.6381e-12
Shariyat’s criterion
1.1e-10 9.31e-13
7.22e-11 6.9e-12
FEMFAT software
Table 8: Fatigue damages predicted by different approaches for the critical region, for various RPMs.
mechanical loads whereas the second one is associated with the so-called 400 hr durability test un-der thermal loads. The corresponding fatigue test conditions are also specified in the mentioned tables. These tests have been adopted based on a compromise between Peugeot and FEV automo-tive companies durability test procedures.
As mentioned before, the most critical regions of the piston are the pin hole, piston’s crown, and piston’s skirt (at the thrust side) (precisely, the region indicated in Fig. 14). The fatigue damage contours obtained by FEMFAT and FESAFE softwares (Fig. 16), confirm this conclusion.
Event order Duration [minutes] Engine speed [RPM] Load specifications
1 5 6000 rated power
2 4 2000 BMEP= 2 bar
3 5 3500 max torque
4 1 750 low idle
Table 9: Block program of the 800 hr mechanical engine durability test [outlet coolant water temperature= 90 +3 (°C) and Max. oil temperature= 140 (°C)].
Event order Duration [minutes]
Engine speed
[RPM] Load specifications
Outlet coolant water temperature [°C]
1 9.5 6000 rated power 90 +3
2 4.5 750 low idle 30 +10
Table 10: Block program of the 400 hr thermal engine durability test.
Figure 16: Fatigue damage contours of the piston derived by the FEMFAT software, for the CNG engine (at 6000 RPM).
ex-perimental data, and the fatigue lives predicted by various fatigue theories for the 800 hr durability tests of both the gasoline and CNG engines. Fatigue failures have been detected based on visual NDT techniques, e.g. spot check for micro-crack detection. Some of the defects occurred for the piston through the fatigue tests are shown in Fig. 18. It is known that in non-proportional loadings, von Mises criterion usually leads to results that are extremely conservative (Socie and Marquis 2000). In the present analysis, von Mises criterion is modified using Goodman, Gerber, and Soder-berg mean stress corrections (Eqs. 10-12). Although modified von Mises criterion has been employed in the present research, the relevant results show significant errors. Fig. 17 reveals that employing Gerber and Soderberg mean stress corrections leads to most and least accurate results for the von Mises-type criteria. Furthermore, Fig. 17 reveals that modified Findley and Shariyat’s criteria lead to more accurate results with the modified Shariyat’s criterion regenerates the experimental results more accurately. Moreover, the relative discrepancies between the theoretical results are different, to some extent, for the gasoline and CNG engines. Results of various theories are compared in Fig. 19 with the experimental results of the 400hr durability test. As before, it was intended to use at least four fatigue failure test results to present a stronger discussion. As it may be readily seen, results of Shariyat’s criterion are closer to the experimental results. Results presented in Figs. 17 and 19 reveal that in contrast to other criteria, the modified Findley criterion has slightly underes-timated the fatigue lives, especially for the CNG engine.
Figure 18: Some of the observed piston’s defects during the fatigue tests.
Figure 19: Comparison of the observed (experimental) and estimated fatigue lives based on various theories, for the so-called 400 hr durability tests of both the gasoline and CNG engines.
6 CONCLUSIONS
theories and the recently proposed theories have been compared with the experimental results for the piston as a typical part with complicated geometry, boundary conditions, and loading conditions. The available HCF criteria have been mainly validated based on simple specimens, and simple boundary and loading conditions. The obtained results for the combustion temperatures and pressures, the tem-perature distributions, and the fatigue life assessment results obtained by the recently proposed inte-gral-type criterion of the first author, show a good concordance with the experimental results.
References
Abu-Nada, E., Al-Hinti, I., Al-Sarkhi, A., Akash, B., (2008). Effect of piston friction on the performance of SI en-gine: A new thermodynamic approach, Journal of Engineering for Gas Turbines and Power 130, Article No. 022802. Bernasconi, A., Foletti, S., Padopoulos, I.V., (2008). A study on combined torsion and axial load fatigue limit tests with stresses of different frequencies, International Journal of Fatigue 30: 1430–1440.
Borgnakke, C., Sonntag, R.E., (2009). Fundamentals of thermodynamics, 7th Edition, John Wiely & Sons Inc, Hobo-ken, USA.
Castro, F.C., Araujo, J.A., Mamiya, E.N., Pinheiro, P.A., (2014). Combined resolved shear stresses as an alternative to enclosing geometrical objects as a measure of shear stress amplitude in critical plane approaches. International Journal of Fatigue 66: 161–167.
Dowson, D., Taylor, C.M., Yang, L., (1996). Friction modelling for internal combustion engines, Tribology Se-ries 31: 301-318.
Erdman, A., Sandor, G.N., Kota, S., (2001). Mechanism design: Analysis and synthesis, 4th edition, Prentice Hall, New Jersey.
Fatemi, A., Shamsaei, N., (2011). Multiaxial fatigue: An overview and some approximation models for life estima-tion. International Journal of Fatigue 33 948–958.
Fatemi, A., Socie, D. (1988). A critical plane approach to multiaxial fatigue damage including out-of-phase loading, Fatigue and Fracture of Engineering Materials and Structures 11: 149-166.
Ferguson, P.S., Kirkpatrick, A.T., (2000). Internal combustion engines applied thermosciences, Wiley, New York. Findley, W.N., (1959). A theory for effect of mean stress on fatigue of metals under combined torsion and axial load or bending, Trans ASME, Journal of Engineering for Industry 1959; 81: 301-306.
Ghazi Mir Saied, S.A., Jazayeri, S.A., Shamekhi, A.H., (2006). Modeling of variable intake valve timing in SI engine, ASME Technical Conference, Internal Combustion Engine Division, Paper No. ICES2006-1411, 789-803.
Heywood, J.B., (1988). Internal combustion engine fundamentals, McGraw-Hill, New York.
Ivashchenko, N.A., Nasyrov, R.A., Timokhin, A.V., (1980). Evaluation of the thermal and stress-strain state of an internal combustion engine piston by the finite element. Problemy Prochnosti 2: 62-67.
Jahanian, O., Jazayeri, S.A., (2009). A comprehensive study on natural gas HCCI engine response to different initial conditions via a thermo-kinetic engine model, ASME Technical Conference, Internal Combustion Engine Division, Paper No. ICEF2009-14084.
Kajiwara, H., Fujioka, Y., Suzuki, T., Negishi, H., (2002). An analytical approach for prediction of piston tempera-ture distribution in diesel engines. JSAE Review 23: 429–34.
Karamangil, M., Kaynakli, O., Surmen, A., (2006). Parametric Investigation of cylinder and jacket side convective heat transfer coefficients of gasoline engines, Energy Conversion Management 47: 800–816.
Konecna, R., Nicoletto, G., Kunz, L., Riva, E., (2015). The role of elevated temperature exposure on structural evo-lution and fatigue strength of eutectic AlSi12 alloys. doi:10.1016/j.ijfatigue.2015.05.007.
Lipski, A., Mroziński, S., (2012). The Effects of Temperature on the Strength Properties of Aluminium Alloy 2024-T3. Acta Mechanica et Automatica, 6: 62-66.
MAHLE GmbH, Pistons and engine testing, Chapter 4: Piston materials, Vieweg+Teubner Verlag, Springer, Stuttgart, 2012.
Mohammadi, A., Jazayeri, S.A., Ziabasharhagh, M., (2008). Numerical simulation of convective heat transfer in a spark ignition engine, ASME Technical Conference, Internal Combustion Engine Division, Paper No. ICES2008-1687.
Papuga, J., (2011). A survey on evaluating the fatigue limit under multiaxial loading. International Journal of Fa-tigue 33: 153–165.
Ramos, J., (1989). Internal Combustion Engine Modelling, Taylor & Francis, New York. Schijve, J., (2009). Fatigue of Structures and Materials, Second Edition, Springer, Germany.
Scholz, B., Bargende, M., (2000). Three-dimensional simulation of the piston group, SAE technical paper No. 2000-01-1239.
Shahangian, S.N., Jazayeri, S.A., Bagheri, N., (2007). Study on characteristics of HCCI engine operation for EGR, equivalence ratio and intake charge temperature and pressure while using dimethyl ether, ASME Technical Confer-ence, Internal Combustion Engine Division, Paper No. ICEF2007-1644, 127-137.
Shariyat, M., (2008). A fatigue model developed by modification of Gough's theory, for random non-proportional loading conditions and three-dimensional stress fields, International Journal of Fatigue 30: 1248-1258.
Shariyat, M., (2009a). Two new multiaxial HCF criteria based on virtual stress amplitude and virtual mean stress concepts, for complicated geometries and random non-proportional loading conditions, Transactions of ASME, Jour-nal of Engineering Materials and Technology 131: 031014 (1-13).
Shariyat, M., (2009b). Three energy-based multiaxial HCF criteria for fatigue life determination in components un-der random non-proportional stress fields, Fatigue and Fracture of Engineering Materials and Structures 32: 785-808. Shariyat, M., (2010). New multiaxial HCF criteria based on instantaneous fatigue damage tracing in components with complicated geometries and random non-proportional loading conditions, International Journal of Damage Mechanics 19: 659-690.
Shariyat, M., Djamshidi, P., (2009). Minimizing the engine-induced harshness based on the DOE method and sensi-tivity analysis of the full vehicle NVH model, International Journal of Automotive Technology 10: 687-696.
Silva, F.S., (2006). Fatigue on engine pistons, A compendium of case studies, Engineering Failure Analysis 13: 480– 492.
Smith, K., Topper, T. H., Watson, P., (1970). A stress-strain function for the fatigue of metals. Journal of materi-als 5: 767-778.
Socie, D., (1987). Multiaxial fatigue damage models. Journal of Engineering Materials and Technology 109: 293-298. Socie, D.F., Marquis, G.B., (2000). Multiaxial fatigue, SAE International.
Su, X., Zubeck, M., Lasecki, J., Engler-Pinto Jr, C., Tang, C., Sehitoglu, H., Allison, J., (2002). Thermal fatigue analysis of cast aluminum cylinder heads, SAE technical paper No. 2002-01-0657.
Thring, R.H., (1992). Engine friction modeling, SAE Technical paper No. 920482.
Tung, S.C., McMillan, M.L., (2004). Automotive tribology overview of current advances and challenges for the fu-ture, Tribology International 37: 517–536.
Valdés, M., Casanova, J., Rovira, A., Trinidad, M., (2001). Design of carbon pistons using transient heat transfer and stress analyses, SAE technical paper No. 2001-01-3217.