Abstract
Temperature and external load are two important factors affecting the mechanical properties of rock material. The test on heat- treated granite specimen was carried out by using an improved split Hopkinson pressure bar (SHPB). Based on the test data, the dynamic behavior and failure characteristics of the granite under the coupling action of temperature and impact loading are studied. The results show that the amplitude of incident wave increases with the impact velocity of striker, and the shapes of the trans-mitted and reflected waves are closely related to the failure state of the specimen. The stress-strain curves for the heat-treated spec-imens above 700oC are obviously different to those below 500oC in terms of the slopes for the ascending segment and the peak stress, indicating that there is a temperature threshold between 500oC and 700oC. Under the same velocity, the strain rate decreases slightly and then increases as the temperature increases. At a constant temperature, strain rate increases linearly with the im-pact velocity. The relationship between elastic modulus and strain rate for the heat-treated specimen obviously tends to have no regularity. In addition, both peak stress and peak strain exhibit strain rate sensitivity, but different increasing rates for different temperatures are detected. Below 500oC, the influence of tempera-ture on peak stress and peak strain is not evident, however, the influence becomes remarkable at 700oC and 900oC.
Keywords
Granite; Temperature; SHPB test; Mechanical property; Failure mode; Strain rate
Study on Dynamic Compressive Mechanical Properties
and Failure Modes of Heat-Treated Granite
1 INTRODUCTION
Rock dynamics, an important branch of rock mechanics, is a new discipline that deals with mechan-ics and vibration effect problems such as stress, strain, acceleration, fracturing, damage, etc., under
Zhiliang Wang * Shiyun Hao
School of Civil & Hydraulic Engineering, Hefei University of Technology, Hefei, 230009 Anhui Province, China
* Corresponding author: [email protected]
http://dx.doi.org/10.1590/1679-78253342
the action of earthquake, explosion and other dynamic factors. In practice, the circumstances sur-rounding rock are very complex, with the combined effect of temperature field and dynamic load, such as the exploitation of deep ore deposit, the utilization of geothermal resource, the disposal of high radioactive nuclear waste, the reconstruction of tunnel damaged by fire and so on. Therefore, it is of importance to carry out the study on the dynamic properties of heat-treated rock, and it has great significance to engineering applications.
So far, great achievements have been made in the strain rate effect of rocks: Jackson et al. (2008) conducted the uniaxial compression test on rock with a wide range of strain rate, and concluded that the influence of strain rate on the fracture characteristics of rock was remarkable. Chong et al. (1980) performed dynamic compression tests for oil shale with the strain rate varied between 10-4/s and 10/s, and indicated that the compressive strength increased with the increase of logarithmic strain rate. Qi et al. (2009) pointed out that the deformation and fracture of rock were dominated by the heat-activated mechanism at low strain rate. However, the macroscopic viscosity was found to emerge and gradually prevail with increasing strain rate. The study on mechanical parameters (liang et al., 2015) showed that the elastic modulus increased with the ratio of specimen height to diameter and strain rate, whereas the Poisson’s ratio was independent of these two factors. Jeong et al. (2007) stated that the compressive strength exhibited a positive correlation with strain rate, while the stress damage index hardly depended on strain rate. Lu & Wang (2016) explored the dy-namic characteristics of granite under medium-high strain rate, and found that the compressive strength increased logarithmically with strain rate, but the elastic modulus was not sensitive to the confining pressure and strain rate. Zhai et al. (2007) used a sliding-type microcrack model to explain the rate-relevance of compressive strength and the dynamic fracturing of rock.
Although numerous studies were carried out on mechanical properties of rock, these works were limited primarily to test at room temperature or consideration of thermal effect under static load. It is well-known that the mechanical properties of rock show strong dependence on both temperature and strain rate in many engineering constructions. Therefore, the improved split Hopkinson pres-sure bar (SHPB) tests on granite specimens are performed in this study, varying the values of treatment temperature and impact velocity (loading rate). Based on the test results, the shape of stress-strain curve, the failure mode of heat-treated specimen, the strain rate effect on elastic modu-lus along with the variation laws of peak stress and peak strain (strain at the peak stress) are inves-tigated. Some useful conclusions are then given and helpful for the design of rockmass engineering exposed to high temperature.
2 EXPERIMENT CONFIGURE
2.1 Experimental Material
The granite was taken from the quarry in the Huashan area (Shanxi Province, northwest China). Generally, Huashan granite has a gray and lumpy structure, classified as medium-fine-grained bio-tite granite. The main mineral compositions include microcline (41%), plagioclase (27%), quartz (22%) and biotite (7%) and others. The average density of granite is 2620kg/m3. The rock speci-mens were first core-drilled from a large granite block. The specispeci-mens were then cut from the high-quality cores with an electric cut-off machine. The specimens for the impact compression test have a diameter of 50mm and a length of 25mm to meet the assumption of stress uniformity (Christensen, 1972; Dai et al., 2010). The specimens were carefully ground by a grinding machine to ensure that the parallelism between the top and bottom surface of the specimen is within 0.05mm. The working accuracy of the granite specimens conforms to the standard suggested by the International Society for Rock Mechanics (ISRM).
2.2 Specimen Preparation and Testing Principle
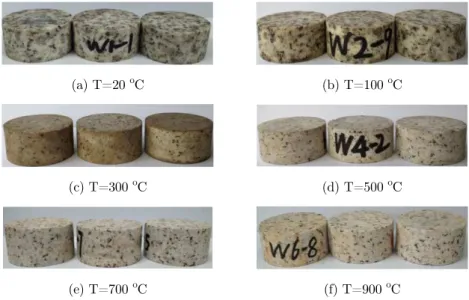
In this study, six groups of specimens were prepared including one obtained at room temperature and the other five treated at 100oC, 300oC, 500oC, 700oC, and 900oC, respectively. Each group had 9-15 specimens and was tested with three different impact velocities to ensure at least three effec-tive data for each case. The thermal treatment was conducted in a servo-controlled electrical fur-nace at a rate of 10oC/min. As soon as the temperature reached a specified value in the furnace, the temperature was maintained for 4h. Then, the furnace was cooled down to room temperature in a natural state. Figure.1 shows the granite specimens subjected to different temperatures. As an im-portant physical property of rock, the ultrasonic P-wave velocity was measured with the ultrasonic tester before and after the thermal treatment.
bar. Those three basic waves are recorded by the gauges mounted on the incident and transmitted bars.
(a) T=20 oC (b) T=100 oC
(c) T=300 oC (d) T=500 oC
(e) T=700 oC (f) T=900 oC
Figure 1: Granite specimens after different treatment temperatures.
(a) Global view (b) Local view
Figure 2: Photos of split Hopkinson pressure bar.
According to the wave propagation theory and two basic assumptions (Wu, et al., 2010), the average stress, strain and strain rate of the specimen can be calculated by the following equations (Zhou, et al., 2012):
( ) ( ) ( )
2 )
( A E t r t t
A
t i t
s
(1)
0( (t) (t) (t))dt
l c
t i r t
s
(t) (t) (t)
l c
t i r t
s
(3)where A and As are the cross-sectional areas of bars and specimen, respectively; E is the elastic modulus of the bars; c and ls are the wave velocity in bars and the original length of specimen, re-spectively.
For the SHPB system used in this study, the lengths of the striker bar, incident bar, and transmitted bar are 400, 1400, and 1000 mm, respectively. The wave velocity of the bars is 5172m/s and the elastic modulus is 210GPa. In SHPB tests, the impact velocity is mainly controlled by changing the pressure of compressed gas, so the amplitude of strain-rate is changed. Under each temperature level, three loading gas pressures (0.22MPa, 0.32MPa and 0.48MPa) were selected, thus the SHPB tests on the granite specimens have been conducted under 3 kinds of average veloci-ties (11.0m/s, 14.5m/s and 19.0m/s). To reduce the end friction effect, vaseline was smeared on the interfaces between specimen ends and incident bar or transmission bar.
-0.2 0.0 0.2 0.4 0.6
-0.6 -0.3 0.0 0.3 0.6 0.9 1.2 1.5
Reflected signal
Transmitted signal Incident signal
t (ms)
U (V
)
0.0 0.2 0.4 0.6 0.8
-3.0 -1.5 0.0 1.5 3.0
t (ms)
U (
V
)
Incident signal
Reflected signal
Transmitted signal
(a) Intact specimen (b) Damaged specimen
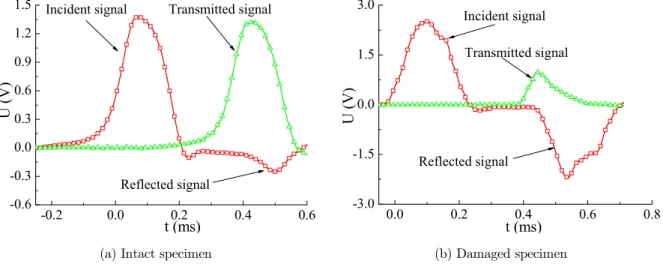
Figure 3: Comparison of incident and transmitted wave signals.
To ensure that uniform stress state in the loading direction can be achieved early in specimens and that the amplitude of pulse oscillation can be reduced, soft rubber with the diameter of 10.0 mm and the thickness of 3.0 mm was employed as pulse shaper through multiple trial tests (Frew, Forrestal & Chen., 2002). The original stress wave curves are shown in Figure.3. It can be seen that the incident wave has a shape similar to a bell-like waveform with a smoother and longer ramp, especially suitable for dynamic loading of brittle material. Additionally, the transmitted wave is very weak while the reflected wave accordingly becomes strong for a damage specimen.
3 EXPERIMENT RESULTS AND DISCUSSION
the complete stress-strain curves of rock. Therefore, the coupling effect of temperature and dynamic load on mechanical properties and failure modes of heat-treated granite will be discussed below by taking these indexes as a starting point.
3.1 Waveform Curve and Failure Mode of Specimen
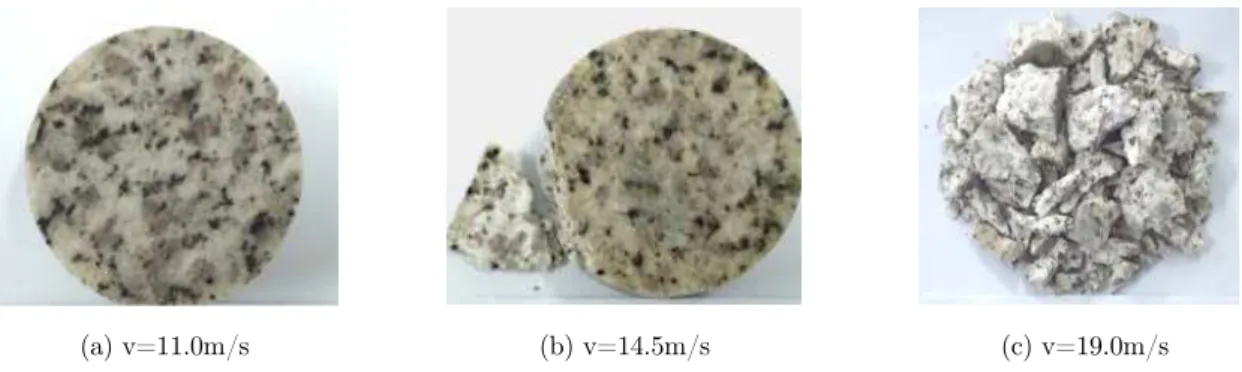
Figure.4 presents the recorded waveform at room temperature. It is clear that under different im-pact velocities, the shapes of the incident waves are similar, and the amplitude of incident wave increases as the impact velocity increases. However, the damage status of specimens has a great influence on transmitted waves. For impact velocities of 11.0m/s and 14.5m/s, the specimen dam-age is relatively mild (Figure.5). The amplitude of transmitted wave is about 90% of the incident wave, while the reflected wave is obviously lower. As the impact velocity rises to 19.0m/s, serious failure of the specimen occurs (Figure.5c) and thus the effective contact area between the specimen and the bars decreases rapidly, resulting in the attenuation of transmitted wave. Accordingly, a relative increase in reflected wave was detected. As shown in Figure.5, the specimens are almost intact at lower impact velocity and room temperature. With the increase of velocity, cracking starts from the outer edge of the specimens, followed by the fracturing. After high-velocity impact, the specimens are broken into small pieces.
0.00 0.23 0.46 0.69
-1.8 -0.9 0.0 0.9 1.8 2.7
U (V)
t (ms)
v11.0m/s
v14.5m/s
v19.0m/s
1 2
3 1.Incident wave 2.Transmitted wave 3.Reflected wave
Figure 4: Waveform curves under different velocities at room temperature.
(a) v=11.0m/s (b) v=14.5m/s (c) v=19.0m/s
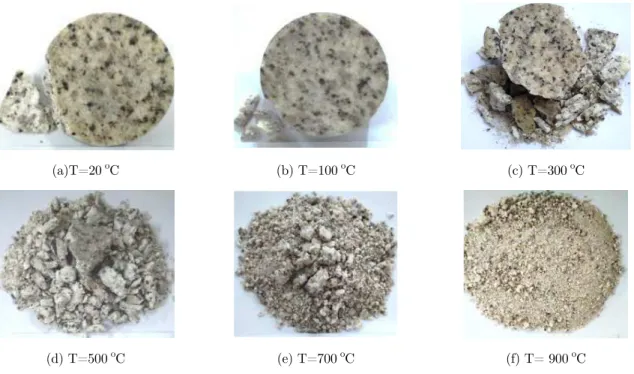
Figure.6 shows the typical incident, reflected and transmitted waves shaped by the pulse shaper with an impact velocity of 14.5m/s. The incident waves under different temperatures are almost identical, indicating that the impact velocity and the shaping effect were well regulated. For speci-mens that are not crushed, a stable transmitted wave was recorded. Otherwise, a significant de-crease in the transmitted wave was detected. For example, at the 700oC and 900oC, the amplitudes of transmitted waves decrease rapidly, while those of reflected waves rise correspondingly. It may be inferred that there exists a temperature threshold between 500oC and 700oC. When the temperature is below 500oC, the damage of specimen at the impact velocity of 14.5m/s is relatively mild (Fig-ure.7). The damage of specimen generally becomes more serious as the temperature increases, with the specimen pulverizing at 900oC.
0.00 0.23 0.46 0.69
-4 -3 -2 -1 0 1 2
1.Incident wave 2.Transmitted wave 3.Reflected wave
t (ms)
U
(V) T=20C T=100C T=300C T=500C T=700C T=900C 1
2
3
Figure 6: Waveform curves under different treatment temperatures at v=14.5m/s.
(a)T=20 oC (b) T=100 oC (c) T=300 oC
(d) T=500 oC (e) T=700 oC (f) T= 900 oC
3.2 Shape of Stress-Strain Curve
The SHPB tests on the granite specimens were conducted at three impact velocities and six tem-peratures. The stress-strain curves obtained from the SHPB tests are plotted in Figures.8 and 9. These curves were calculated from the strain signals recorded in the bars using Eqs.(1)-(3). The dynamic strength is defined as the peak stress herein.
0 5 10 15 20
0 80 160 240 St ress (MPa ) St ress (MPa )
strain (10-3)
v=11.0m/s v=14.5m/s v=19.0m/s
0 5 10 15 20
0 50 100 150 200
250 v=11.0m/s
v=14.5m/s v=19.0m/s
strain (10-3)
Stress (MP
a)
(a)T=20oC (b) T=100 oC
0 5 10 15
0 60 120 180
240 v=11.0m/s
v=14.5m/s v=19.0m/s
strain (10-3)
St re ss (M Pa )
0 5 10 15 20
0 60 120 180
240 v=11.0m/s
v=14.5m/s v=19.0m/s
strain (10-3)
Stress
(MPa)
(c) T=300 oC (d) T=500 oC
0 12 24 36 48
0 40 80 120 v=11.0m/s v=14.5m/s v=19.0m/s
strain (10-3)
Stress (MPa
)
0 11 22 33 44 55
0 30 60
90 v=11.0m/s
v=14.5m/s v=19.0m/s
strain (10-3)
Stress (MP
a)
(e) T=700 oC (f) T=900 oC
According to Figure.8, the stress increases linearly initially and then decreases after the stress achieves the peak value. The rebound phenomenon can be noticed for the impact velocities of 11.0m/s and 14.5m/s. As the velocity rises up to 19.0m/s, the specimen breaks into pieces and the stress-strain curve manifests the strain-softening behavior. In addition, Figure.8 indicates when the temperature falls below 500oC, the shapes of stress-strain curves are very similar, i.e, the slopes of the ascending segment of stress-strain curves are very close to each other, whereas the descending segment of the curves is considerably affected by the impact velocity. At higher temperatures of 700oC and 900oC, the specimen strength significantly deteriorates due to thermal damage, and there is no rebound phenomenon in stress-strain curves even under low impact velocity. Figure.9 shows the stress-strain curves of specimens subjected to different temperatures. It can be seen that for the temperatures at 500oC and below, the shapes of stress-strain curves are alike. Besides, the slopes of the ascending segment and the peak stress are hardly changed, indicating that the effect of temper-ature on the compressive strength and elastic modulus is little. As the treatment tempertemper-ature rises to 700oC or above, the peak stress and elastic modulus decrease significantly, whereas peak strain is mobilized and dramatically increases, which further confirms that there exists a temperature threshold between 500oC-700oC for Huashan granite.
0 5 10 15 20 25
0 50 100 150
Strain(10-3)
20°C 100°C 300°C 500°C 700°C 900°C Stress (MPa )
0 10 20 30
0 50 100 150 200
Strain(10-3)
St re ss (M Pa )
20C 100C 300C 500C 700C 900C
(a) v=11.0m/s (b) v=14.5m/s
0 10 20 30 40 50
0 60 120 180 240
Strain(10-3)
Stre
ss
(MPa
)
20C 100C 300C 500C 700C 900C
(c) v=19.0m/s
3.3 Influencing Factors of Strain Rate
The effect of treatment temperature and impact velocity on the strain rate is discussed in this sec-tion. For convenience, the average strain-rate is adopted in this study, which is defined as the ratio of strain increment to time increment at the peak stress. The variation of average strain rate as a function of temperature for impact velocities of 11.0, 14.5 and 19.0 m/s is shown in Figure.10. It can be seen that under the same impact velocity, the strain rate decreases slightly as the tempera-ture increases from 200oC to 400oC and then increases significantly with increasing temperature above 400oC. The decrease is caused by the volume expansion of mineral grains due to the vapori-zation of strong bound water, which may make the rock specimen denser.
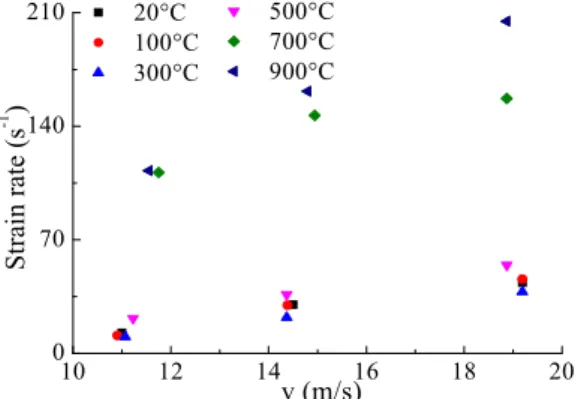
Figure.11 shows the relationship between strain rate and impact velocity for different tempera-tures (20oC-900oC). Overall, the strain rate increases linearly with the impact velocity under differ-ent temperatures. A good correlation between the impact velocity and strain rate is exhibited. In addition, for a similar impact velocity, the higher the temperature is, the greater the corresponding strain rate is. Especially for the 700oC and 900oC cases, the increasing trend of strain rate is ex-traordinarily clear, which shows the rate effect still remains at higher temperature.
0 200 400 600 800 1000
0 70 140
210 v=11.0m/s
v=14.5m/s v=19.0m/s
Stra
in
rate
(
s
-1 )
T (0C)
Figure 10: Variation of strain rate and treatment temperature.
10 12 14 16 18 20
0 70 140
210 20°C
100°C 300°C
Str
ain r
ate
(s
-1 )
v(m/s) 500°C 700°C 900°C
Figure 11: Variation of strain rate and impact velocity.
3.4 Characteristics of Elastic Modulus
1 2
1 2
c
E (4)
where σ1 and ε1 are, respectively, the stress and strain at the point of which the stress is 40% of the peak stress; and σ2 and ε2 are, respectively, the stress and strain at the point of which the stress is 60% of the peak stress.
The relationship between strain rate and elastic modulus is plotted in Figure.12 for different temperatures between 20oC and 900oC. No obvious trend can be observed. For temperatures below 500oC , the dynamic elastic modulus ranges from 40GPa to 60GPa. The value is significantly lower at the temperatures of 700oC and 900oC , and it nearly remains constant with the increase of strain rate. Figure.13 shows the variation of elastic modulus with treatment temperature under impact velocities of 11.0, 14.5 and 19m/s. For the velocity of 14.5m/s, the elastic modulus decreases from 47GPa to 11GPa as the temperature increases from 500oC to 700oC. A further reduction by 45% as the temperature increases from 700oC to 900oC. To further investigate the effect of temperature treatment on the elastic modulus of granite, the relative elastic modulus (ratio of the elastic modu-lus at a certain temperature to that at room temperature of 20oC ) is shown in Figure.14 (Du, 2004). It is seen that after the thermal treatment with a temperature of 700oC , the elastic modulus of specimen decreases by about 80% compared to the room temperature, suggesting that the specimen has severe thermal damage at that moment.
0 70 140 210
0 20 40 60 80
Strain rate (s-1)
Elastic mo
dulus (
GPa)
20°C 100°C 300°C 500°C 700°C 900°C
Figure 12: Variation of elastic modulus and strain rate.
0 200 400 600 800 1000
0 30 60 90
Elas
tic m
odulus (
G
Pa
)
T (0C)
v11.0m/s v14.5m/s v19.0m/s
0 200 400 600 800 1000 0.00
0.31 0.62 0.93 1.24
Relative
elas
tic modulus
T (0C)
v=11.0m/s v=14.5m/s v=19.0m/s
Figure 14: Plot of relative elastic modulus and treatment temperature.
3.5 Variation Law of Peak Stress
The magnitude of peak stress is shown in Figure.15 in terms of strain rate. Under different temper-atures, the peak stress of specimen increases with increasing strain rate, but the increasing rates (or gradients) are not consistent. For temperatures at and below 500oC, the peak stress increases with the strain rate in a similar way, and the gradient is much steeper compared to those for tempera-tures of 700oC and 900oC. For example, at 900oC, the gradient of increase is only 0.36, reduced by 87% compared to that at room temperature.
0 70 140 210
80 160
240 20°C
100°C 300°C 500°C 700°C 900°C
Peak
stress (MPa)
Strain rate (s-1)
Figure 15: Variation of peak stress and strain rate.
0 200 400 600 800 1000 50
100 150 200 250
Peak
st
ress
(MPa)
T (0C)
vm/s
vm/s
vm/s
Figure 16: Plot of peak stress and treatment temperature.
The relative peak stress, one of the major indexes, which is taken as the ratio of peak stress of heat-treated specimen to the peak stress at room temperature(Du, 2004), is plotted in Figure.17. For a temperature at or below 500oC, the range of peak stress fluctuates within ±6.0%. Once the temperature reaches 500oC or above, the relative peak stress reduces significantly. For the tempera-ture of 900oC, the average peak stresses of all specimens under different impact velocities reduce by about 60% compared to those at the room temperature. These results imply that the influence of temperature on the granite property is slight under 500oC. When the temperature exceeds 500oC, the loss of mineral combined water and the phase-transition of quartz happen (Branlund, et al., 2007; Yin, et al., 2012), which lead to deterioration of the macroscopic mechanical properties and the significant decrease of granite strength.
0 200 400 600 800 1000
0.48 0.64 0.80 0.96 1.12
Relative pea
k stre
ss
T (0C) v=11.0m/s v=14.5m/s v=19.0m/s
Figure 17: Plot of relative peak stress and treatment temperature.
3.6 Variation Law of Peak Strain
300oC, the gradient are close to each other, with an average value of about 4.310-2 ms. At 500oC, the gradient drops to 5.210-3 ms. For temperatures over 500oC, the gradient continuously increases, and the value reaches 0.14ms at 900oC. The effect of treatment temperature on peak strain is plot-ted in Figure.19 for impact velocities of 11.0, 14.5 and 19m/s. For a temperature lower than 500oC, the peak strain is hardly affected by the temperature, whereas it increases significantly once the temperature goes beyond 500oC. For example, at an impact velocity of 11.0m/s, the peak strain increases by 2.8110-3 and 1.8110-2 as the temperature increases from 300oC to 500oC and from 500oC to 900oC, respectively. The gradient of the latter is about three times greater than the former.
0 70 140 210
7 14 21 28
Peak strain (
10
-3 )
Strain rate (s-1) 20°C
100°C 300°C 500°C 700°C 900°C
Figure 18: Variation of peak strain and strain rate.
0 200 400 600 800 1000
0 10 20 30
vm/s
vm/s
vm/s
Peak
stra
in (10
-3 )
T (0C)
Figure 19: Plot of peak strain and treatment temperature.
0 200 400 600 800 1000 0
1 2 3 4 5 6
7 vm/s
vm/s
vm/s
Re
lat
ive peak
stra
in
T (0C)
Figure 20: Plot of relative peak strain and treatment temperature.
4 CONCLUSIONS
In this work, the impact compression behavior of heat-treated granite was studied. Based on the experimental results and observations, the following main conclusions can be drawn:
(1) The amplitude of incident wave increases in direct proportion to the impact velocity of the striker, and the shapes of the transmitted and reflected waves are related to the failure state of specimen tested. As the damage of the specimen intensifies, the amplitude of transmitted wave re-duces while that of reflected wave increases accordingly.
(2) Impact velocity and thermal treatment exert significant influences on the shape of stress-strain curve. For the temperatures at and below 500oC, the ascending segments of the stress-strain curves are almost coincident. Once the temperature reaches 700oC, the peak stress and elastic mod-ulus decreases significantly, implying that there exists a temperature threshold between 500oC and 700oC.
(3) Strain rate falls slightly in the temperature range of 200oC-400oC, and then increases with the treatment temperature for a fixed impact velocity. At a specific temperature, strain rate in-creases linearly with the impact velocity of striker. No obvious relationship is observed between the elastic modulus and strain rate.
(4) The peak stress and peak strain have significant rate effect before and after thermal treat-ment. Both of them increase with strain rate, but the gradients of increase are quite different under different temperatures. Below 500oC, the influence of temperature is slight, while it becomes signifi-cant for temperatures above 500oC.
Acknowledgments
This work was supported by the National Natural Science Foundation of China (51379147, 51579062).
References
Branlund, J. M., & Hofmeister, A. M. (2007). Thermal diffusivity of quartz to 1000°C: effects of impurities and the
Chong, K.P., Hoyt, P.M., Smith, J.W., et al., (1980). Effects of strain rate on oil shale fracturing. International Journal of Rock Mechanics and Mining Science 17(1): 35-43.
Christensen, R.J., Swanson, S.R., Brown, W.S., (1972). Split Hopkinson-bar tests on rock under confining pressure. Experimental Mechanics 12(11): 508-513.
Dai, F., Huang, S., Xia, K., et al., (2010). Some fundamental issues in dynamic compression and tension tests of rocks using split Hopkinson pressure bar. Rock Mechanics & Rock Engineering 43(6): 657-666.
Du, S.J., Liu, H., Zhi, H.T., (2004). Testing study on mechanical properties of post-high-temperature granite. Chi-nese Journal of Rock Mechanics and Engineering 23(14):2359-2364. (in ChiChi-nese)
Frew, D.J., Forrestal, M.J., Chen W (2002). Pulse shaping techniques for testing brittle materials with a split Hop-kinson pressure bar. Experimental Mechanics 42(42): 93-106.
Funatsu, T., Seto, M., Shimada, H., et al., (2004). Combined effects of increasing temperature and confining pressure on the fracture toughness of clay bearing rocks. International Journal of Rock Mechanics & Mining Sciences 41(6): 927-938.
Jackson, K., Kingman, S.W., Whittles, D.N., et al., (2008). The effect of strain rate on the breakage behavior of rock. Archives of Mining Sciences 53(1): 3-22.
Jeong, H.S., Kang, S.S., Obara, Y., (2007). Influence of surrounding environments and strain rates on the strength of rocks subjected to uniaxial compression. International Journal of Rock Mechanics & Mining Sciences 44(3): 321–331. Kolsky. H., (2002). An Investigation of the Mechanical Properties of Materials at very High Rates of Loading. Pro-ceedings of the Physical Society 62(11):676.
Liang, C.Y., Zhang, Q.B., Li, X., et al., (2015). The effect of specimen shape and strain rate on uniaxial compressive behavior of rock material. Bulletin of Engineering Geology & the Environment: 1-13.
Liu, S., Xu, J.Y., (2015). An experimental study on the physic-mechanical properties of two post-high-temperature rocks. Engineering Geology 185(2): 63-70.
Liu, S., Xu, J.Y., (2015). Effect of strain rate on the dynamic compressive mechanical behaviors of rock material subjected to high temperatures. Mechanics of Materials 82: 28-38.
Lu, Z.T., Wang, Z.L., (2016). Triaxial tests on dynamic properties of granite under intermediate and high strain rates. Chinese Journal of Geotechnical Engineering 38(6): 1087-1094. (in Chinese)
Nasseri, M.H.B., Tatone, B.S.A., Grasselli, G., et al., (2009). Fracture Toughness and Fracture Roughness Interrela-tionship in Thermally treated Westerly Granite. Pure & Applied Geophysics 166(5): 801-822.
Ozguven, A., Ozcelik, Y., (2014). Effects of high temperature on physico-mechanical properties of Turkish natural building stones. Engineering Geology 183: 127-136.
Qi, C.Z., Wang, M.Y., Qian, Q.H., (2009). Strain-rate effects on the strength and fragmentation size of rocks. Inter-national Journal of Impact Engineering 36(12): 1355-1364.
Rocchi, V., Sammonds, P.R., Kilburn, C.R.J., (2002). Flow and fracture maps for basaltic rock deformation at high temperatures. Journal of Volcanology and Geothermal Research 120: 25-42.
Sheinin, V.I., Blokhin, D.I., (2012). Features of thermomechanical effects in rock salt samples under uniaxial com-pression. Journal of Mining Science 48(1): 39-45.
Wu, W., Zhang, W.D and Ma, G.W., (2010). Mechanical properties of copper slag reinforced concrete under dynamic compression. Construction and Building Materials 24(6): 910-917.
Yin, T., Li, X., Xia, K., et al., (2012). Effect of thermal treatment on the dynamic fracture toughness of Laurentian granite. Rock Mechanics & Rock Engineering 45(6):1087-1094.
Zhai, Y., Ma, G.W., Zhao, J.H., et al., (2007). Dynamic failure analysis on granite under uniaxial impact compressive. Chinese Journal of Geotechnical Engineering 29(3): 385-390. (in Chinese)
Zhang, J., Ma, W., Zhang, F., et al., (1996). On rock structure character under high temperature. Journal of North-eastern Univer-sity 17(1): 5-9. (in Chinese)