THERMAL ANALYSIS OF HEAT PIPE
USING TAGUCHI METHOD
SENTHILKUMAR R1, VAIDYANATHAN S2, SIVARAMAN B2
1
Lecturer (Senior Scale) in Mechanical Engineering, Annamalai University,
2
Reader in Mechanical Engineering, Annamalai University, Annamalai Nagar – 608 002, Tamil Nadu, India.
Abstract
The heat pipe is a novel heat transfer device to transfer large amount of heat through a small cross sectional area with very small temperature differences and it also posses high thermal conductance and low thermal impedance. In this paper, the heat pipe working parameters are analyzed using Taguchi methodology. The Taguchi method is used to formulate the experimental work, analyze the effect of working parameters of the heat pipe and predict the optimal parameter of heat pipe such as heat input, inclination angle and flow rate. It is found that these parameters have a significant influence on heat pipe performance. The analysis of the Taguchi method reveals that, all the parameters mentioned above have equal contributions in the performance of heat pipe efficiency, thermal resistance and overall heat transfer coefficient. Experimental results are provided to validate the suitability of the proposed approach.
Keywords: heat pipe, taguchi method, heat input, inclination, flow rate, thermal resistance
1. Introduction
The heat pipe is a thermal device which affords efficient transport of thermal energy by using an intermediate heat transfer fluid. Heat pipes consist of a sealed container with a small amount of a working fluid. The heat is transferred as latent heat energy by evaporating the working fluid in the evaporator zone and condensing the vapour in a cooling zone, the circulation is completed by the return flow of the condensate to the evaporator zone through the wrapped screen capillary structure which lines the inner wall of the container [2,5]. By suitable design, heat pipes are being constructed to serve diverse functions such as precise temperature control, one-way transmission of heat (thermal diode) and heat flux amplification and diminution. [The heat pipes are more advantageous in heat recovery systems [4, 7], solar energy [3], Electronics cooling [8, 9], Ocean thermal energy conversion, air craft cooling [9],Geothermal conversion and light water nuclear reactors [6]. The common sections of the vapour space are circular, rectangular and annular [1] and are chosen based on the application of heat pipe.
Taguchi techniques are experimental design optimization techniques [10, 11] which use standard ‘Orthogonal Arrays’ for forming a matrix of experiments in such a way to extract the maximum important information with minimum number of experiments. Using Taguchi techniques, the number of parameters can be tested at a time with probably least number of experiments as compared to any of the other experimental optimization techniques. Moreover, the technique provides all the necessary information required for optimizing the problem. The main advantage of Taguchi Techniques is not only the smallest number of experiments required but also the best level of each parameter can be found and each parameter can be shared towards the problem separately. The main steps of Taguchi Method are determining the quality characteristics and design parameters necessary for the product/process, designing and conducting the experiments, analyzing the results to determine the optimum conditions and carrying out a confirmatory test using the optimum conditions.
2. Experimental Set up
to remove the heat from the pipe. The heat pipe has the ability to transfer the heat through the internal structure. As a result, sudden rise in wall temperature occurs which could damage the heat pipe if the heat was not released at the condenser properly. Therefore, before heat was supplied to the evaporator, the cooling water was first circulated through the condenser jacket. The power input was gradually raised to the desired power level. The surface temperatures at seven different locations along the heat pipe were measured using thermocouple at a regular time interval of ten minutes until heat pipe reaches steady state condition. Simultaneously the evaporator wall temperature, wick temperature, water inlet and outlet temperatures were measured using thermocouple. Once steady state was reached, the input power was turned off and cooling water was allowed to flow through the condenser to cool the heat pipe in order to make it ready for further experimental purpose. Then the power was increased to the next level and the heat pipe was tested for its performance. Experimental procedures were repeated for different flow rates and different inclinations of the heat pipe with respect to the horizontal and observations were recorded.
Fig.1. Schematic diagram of experimental set up
Table 1. Specifications of heat pipe
Specifications Dimensions Outside diameter, m 0.022
Inside diameter, m 0.0196 Evaporator length, m 0.15 Condenser length, m 0.15 Adiabatic length, m 0.70
Total length, m 1.00
Working Fluid Water
Wick mesh size, m 1600
Wick porosity 0.769
No. of layers of wick 2
Wick permeability, m2 2.213 x 10⁻⁹ Capillary Limit, W 108.8
Sonic Limit, W 83852.5
3. Design of Experiments and Data Analysis
3.1 Design of Experiments
For the experimental purpose, the three parameters and three levels are used for Taguchi method with very careful understanding of the levels taken for the factors. The factors to be studied are mentioned in table 2. Before selecting an orthogonal array, the minimum number of experiments to be conducted can be fixed by using the following relation,
where N Taguchi is the number of experiments to be conducted, NV is the number of variables and L is the number of
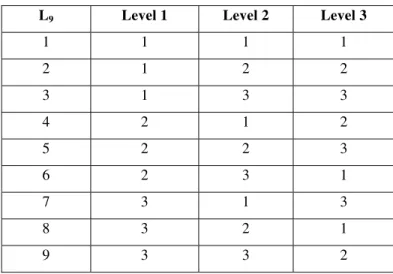
levels. In this analysis, NV = 3 and L = 3. Hence a minimum of seven experiments are to be conducted. The standard orthogonal arrays available are L4, L8, L9, L12, L16, L18 etc,. According to the Taguchi design concept L9
orthogonal array is chosen for the experiments as shown in table 3. In this study, the observed values of heat input, inclination angle and flow rate are set at maximum level. Each experimental trail is performed as per L9 table and
the optimization of the observed values is determined by comparing the standard method and analysis of variance (ANOVA) which is based on the Taguchi method. Table 4 shows the experimental design for L9 orthogonal array.
In the Taguchi method, all the observed values are calculated based on the concept higher the better and smaller the better. In this analysis, the observed values of efficiency, thermal resistance and overall heat transfer coefficient are set to the maximum, minimum and maximum respectively.
Table 2. Control parameters and levels
Control Parameters Level 1 Level 2 Level 3
Heat Input (W) 40 60 80
Inclination Angle (Deg) 0 45 90 Flow rate (kg/min) 0.06 0.08 0.1
Table 3. Orthogonal array for L9 design
L9 Level 1 Level 2 Level 3
1 1 1 1 2 1 2 2 3 1 3 3 4 2 1 2 5 2 2 3 6 2 3 1 7 3 1 3 8 3 2 1 9 3 3 2
3.2 Analysis of Variance (ANOVA)
Correction factor (C.F) =
Sum of Squares (SS) is given by the equation,
SS = ½ {(sum of S/N ratio I level)2 +(sum of S/N ratio II level)2 + (sum of S/N ratio III level)2 – C.F} Percentage of Contribution = SS / total sum of squares
where yi is the output or performance characteristic
N is the total number of experiments
3.3 Data Analysis
In this study, the objective is to determine the main effects of the working parameters of heat pipe, to perform the analysis of variance (ANOVA) and to establish the optimum conditions based on the Taguchi method. The main effects of heat pipe analysis are used to study the effects of each of the factors, as shown in figures 2, 3 and 4. The performances of the heat pipe (ANOVA-significant factor) can be calculated for each experiment of the L9 by using the observed values of the efficiency, thermal resistance and overall heat transfer coefficient from table
4. Table 5, 6 and 7 lists the ANOVA test results for efficiency, thermal resistance and overall heat transfer coefficient respectively. The optimum operating conditions of heat pipe (ANOVA-optimum condition) for each of the observed values are illustrated in tables 8, 9 and 10.
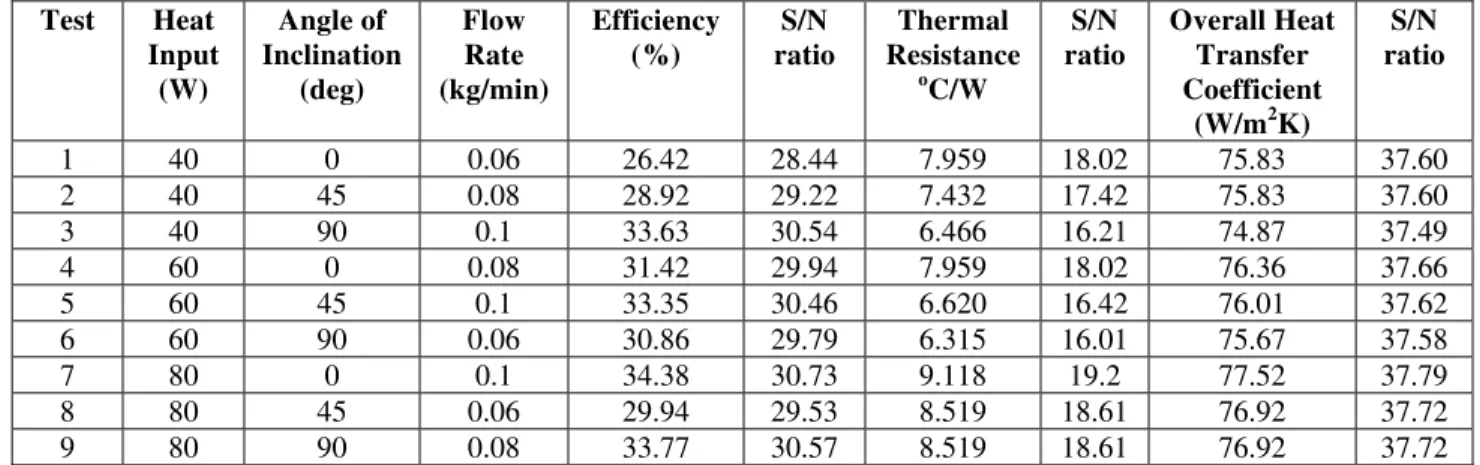
Table 4. Experimental design for L9 orthogonal array
Test Heat Input
(W)
Angle of Inclination
(deg)
Flow Rate (kg/min)
Efficiency (%)
S/N ratio
Thermal Resistance
oC/W
S/N ratio
Overall Heat Transfer Coefficient
(W/m2K)
S/N ratio
1 40 0 0.06 26.42 28.44 7.959 18.02 75.83 37.60
2 40 45 0.08 28.92 29.22 7.432 17.42 75.83 37.60
3 40 90 0.1 33.63 30.54 6.466 16.21 74.87 37.49
4 60 0 0.08 31.42 29.94 7.959 18.02 76.36 37.66
5 60 45 0.1 33.35 30.46 6.620 16.42 76.01 37.62
6 60 90 0.06 30.86 29.79 6.315 16.01 75.67 37.58
7 80 0 0.1 34.38 30.73 9.118 19.2 77.52 37.79
8 80 45 0.06 29.94 29.53 8.519 18.61 76.92 37.72
9 80 90 0.08 33.77 30.57 8.519 18.61 76.92 37.72
Table 5. Analysis of variance for Efficiency
Parameter I mean II mean III mean SS % of contribution Heat Input 29.40 30.06 30.28 80.55.15 33.33 Angle of Inclination 29.70 29.74 30.30 8054.28 33.34 Flow Rate 29.25 29.91 30.58 8057.21 33.34
Table 6. Analysis of variance for Thermal resistance
Table 7. Analysis of variance for Overall Heat Transfer Coefficient
Parameter I mean II mean III mean SS % of contribution Heat Input 37.56 37.62 37.74 12752.51 33.33 Angle of Inclination 37.68 37.65 37.60 12752.45 33.33 Flow Rate 37.63 37.66 37.63 12752.44 33.33
4. Results and Discussion
Figure 2 shows the effects of efficiency of each factor for various level conditions. From the figure, it is clear that, the efficiency of heat pipe increases with all the three parameters i.e. the heat input, angle of inclination and flow rate. The rate of increase for the efficiency is higher for flow rate when compared with the heat input and angle of inclination. As the flow rate increases, the amount of heat absorbed in the condenser section is higher due to high heat transfer coefficient of water which is used as a cooling medium in the condenser.
Figure 3 depicts the variations of thermal resistance of heat pipe with all the three working parameters. The thermal resistance of heat pipe decreases for increasing values of heat input and angle of inclination. But in the case of flow rate, thermal resistance decreases upto the level II and afterwards its value increases from level II to level III. The flow is disturbed inside the heat pipe between the evaporator and condensate which is coming from the condenser. This may be the reason for an increase in the thermal resistance of the heat pipe. The variations of thermal resistance in all the levels are less than 10%.
Figure 4 displays the variations of overall heat transfer coefficient for all the parameters. But the variations are very less or almost same for all the conditions. These variations are within the range of 1%. It indicates that the overall heat transfer coefficient plays an important role in heat transfer characteristics of heat pipe and its value is almost constant.
The percentage contributions of all the working parameters of heat pipe are almost same in all the levels as seen in Figure 5. The variations are quite less than 0.2% only. The optimum working conditions of heat pipe by adopting Taguchi method is tabulated in table 8.
Fig 2 Effect of each factor on Efficiency
Fig 4 Effect of each factor on Overall Heat Transfer Coefficient
Fig 3 Effect of each factor on Thermal Resistance
Table 8. Optimum working parameters
Working parameter Level I Level II Level III
Efficiency 80 W 90o 0.1 kg/min
Thermal Resistance 60 W 90o 0.1 kg/min
Over Heat transfer coefficient 80 W 0o 0.8 kg/min
After determining the optimum working parameters of heat pipe using Taguchi methodology, the experiments are conducted and their values are displayed in the table 9. The experimental results give the optimum performance of heat pipe and these values are found to be better than the previous observations.
Table 9. Optimum solution of heat pipe
Parameter Result
Percentage Efficiency 35.03
Thermal resistance (oC/W) 6.1
Overall heat transfer coefficient (W/m2K) 78.51 5. Conclusion
The results obtained for investigating the performance of the heat pipe after conducting the experiments are summarized as follows.
The contributions of all the working parameters (heat input, angle of inclination and flow rate) in heat pipe performance have equal importance.
The overall heat transfer coefficient of heat pipe is almost same for all levels.
Taguchi optimal solutions give the better results for heat pipe operations and it also reduces the number of experiments that are required for finding its performance metrics.
The experimental results show that the heat input, angle of inclination and flow rate play an important role in the operations of heat pipe and these contributions are almost equal.
6. References
[1] Amir Faghri, Performance characteristics of a concentric annular heat pipe – Part –II Vapour flow analysis, ASME J Heat Transfer 111 (A),pp 847 – 851, (1989)
[2] Amir Faghri, Heat pipe Science and Technology, Taylor & Francis, Washington, 1995.
[3] Bloem H, De-Grijis J.C, Devaan R.L.C, An evacuated tubular solar collector incorporating a heat pipe, Philips Technical Rev – 40, pp 181-191, (1982).
[4] Chandourene S, Gruss A, Theoretical and experimental study of high temperature heat pipe heat exchanger application to 1300kW respirator”, Sixth International heat pipe Conference Grenoffle France, (1987).
[5] Chi S.W, Heat pipe theory and practice, McGraw-Hill, Washington, 1976.
[6] Kaminaga F, Hashimoto H, Feroz C, Goto K, Masumura K, Heat transfer characteristics of evaporation and condensation in a two-phase closed thermosyphon, Proc. 10th Int. Heat pipe Conf., Germany.
[7] Littwin D.A, Willis D.B, The use of heat pipes to conserve energy in petroleum refineries, Energy Process, pp 198-202, (1985). [8] Mariya Ivanova, Yvan Avenas, Christian Schaeffer, Jean-Bernard Dezord, and Juergen Schulz-Harder, Heat Pipe Integrated in Direct
Bonded Copper (DBC) Technology for Cooling of Power Electronics Packaging, IEEE Transactions on Power Electronics, 21, (6), pp 1541, (2006)
[9] Sonan R, Harmand S, Pellé J, Leger D, Fakès M, Transient thermal and hydrodynamic model of flat heat pipe for the cooling of electronics components, International Journal of Heat and Mass Transfer 51, pp 6006–6017, (2008).