www.clim-past.net/10/1735/2014/ doi:10.5194/cp-10-1735-2014
© Author(s) 2014. CC Attribution 3.0 License.
Multiproxy reconstruction for Kuroshio responses to northern
hemispheric oceanic climate and the Asian Monsoon since Marine
Isotope Stage 5.1 (
∼
88 ka)
X. Shi1, Y. Wu1, J. Zou1, Y. Liu1, S. Ge1, M. Zhao2, J. Liu1, A. Zhu1, X. Meng1, Z. Yao1, and Y. Han1
1Key Laboratory of Marine Sedimentology and Environmental Geology, First Institute of Oceanography, State Oceanic Administration, Qingdao 266061, China
2Key Laboratory of Marine Chemistry Theory and Technology (Ocean University of China), Ministry of Education/Qingdao Collaborative Innovation Center of Marine Science and Technology, Qingdao 266100, China
Correspondence to:X. Shi ([email protected])
Received: 26 February 2014 – Published in Clim. Past Discuss.: 4 April 2014
Revised: 7 August 2014 – Accepted: 19 August 2014 – Published: 18 September 2014
Abstract. The Kuroshio, a western boundary current in the northwestern Pacific, plays a key role in regulating ocean and climate in East Asia. The evolution of the Kuroshio and its branches has been the focus of paleoceanographic studies. In this study, we applied a multiproxy (grain size, planktonic foraminiferal species,δ18O, alkenone sea surface temperature (SST) and salinity) reconstruction from sedi-ment core CSH1, which is located at the main axis of the Tsushima Warm Current, a branch of the Kuroshio, in the northern Okinawa Trough (OT). This study, extended the pa-leoceanographic record of the Kuroshio to Marine Isotope Stage (MIS) 5.1 (∼88 ka) from the far northern site in the
OT. Planktonic foraminiferal species identified from this core contain warm-water species related to the Kuroshio and cold-water species related to subarctic cold-water mass. The relative abundances of the warm-water species are high during MIS 1 and MIS 5.1, while cold-water species are high during MIS 2. An organic biomarker proxy, alkenone SST measured from core CSH1 ranges between 21 and 25◦C, with higher values during interglacials (MIS 1, 3.3, 5.1) and interstadials and lower values during glacials and Heinrich (H)/stadial events. Sea surface salinity (SSS) and the depth of the thermocline (DOT), reconstructed based on foraminifera isotopes and faunas, indicate dominant Kuroshio responses to an abrupt climate change event recorded in Greenland ice cores and in stalagmites in East China since∼88 ka. The CSH1 SSS
ap-pears to be mainly controlled by the local river runoff and the Kuroshio, while the DOT change seems to be closely
re-lated to the strength of the Kuroshio and the latitudinal shift of the subarctic frontal zone. Our records suggest that, dur-ing MIS 1 and MIS 5.1, while global sea level was high, the Kuroshio was dominant; while during MIS 2, MIS 3 and MIS 4, with a low sea level, stronger winter Asian Monsoon (AM) and a more southerly subarctic front played impor-tant roles in governing the hydrographic characteristics in the OT. Spectral analysis of our multiproxy hydrographic records shows a dominant precessional period at∼24 ka. Our hy-drographic records, such as SST, SSS and DOT, from a site near the modern Tsushima Warm Current show regional re-sponses corresponding mainly to the global sea level, the Kuroshio, AM and subarctic front, factors which are consis-tently invoked in the interpretations of other regional records from the OT.
1 Introduction
Asia (Hsueh, 2000; Hsueh et al., 1992). In the northern OT, two branches of the Kuroshio, the Tsushima Warm Current (TWC) and the Yellow Sea Warm Current, enter into the Sea of Japan through the shallow Tsushima Strait, with a sill depth of 130 m, and into the Yellow Sea, respectively, while the main stream of the Kuroshio continues to flow north-wardly along the east coast of Japan and turns across the northwestern Pacific at ∼38◦N. Besides the Kuroshio, the
climate of the western Pacific is also regulated by the Asian Monsoon (AM). The freshwater discharged by the Yangtze and Yellow Rivers directly influences the surface water salin-ity and the primary productivsalin-ity and, therefore, the organic carbon export and burial in the adjoining continental mar-gins. Since OT is located adjacent to the wide shelf of the East China Sea (ECS), abundant high-resolution informa-tion on past climate and oceanographic changes could be ex-tracted from marine sediment cores from the OT because of the very high sedimentation rate in the OT.
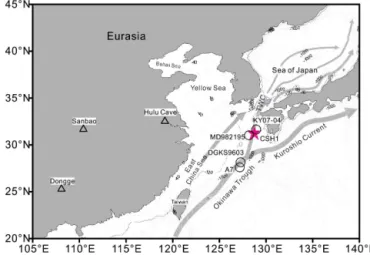
Previous studies on past climate changes using sediment cores from the OT show orbital-scale (Ijiri et al., 2005; Kao et al., 2006a; Kawahata et al., 2006; Zhou et al., 2007), millen-nial and abrupt climatic responses, such as the 8.2 ka event, the Younger Dryas, Heinrich (H) events and the Dansgaard– Oeschger cycles of the Kuroshio (Chang et al., 2008, 2009; Ijiri et al., 2005; Li et al., 2001; Liu et al., 2001; Yu et al., 2009). However, most of these studies were limited by ei-ther shorter cores or single-proxy reconstruction (Jian et al., 1998; Kao et al., 2006b; Lee et al., 2013; Ujiié and Ujiié, 1999) that covered only a small spatial scale of the OT which the Kuroshio has entered. In this study, we present a mul-tiproxy reconstruction of the Kuroshio responses from core CSH1, located at the northernmost site of the OT (Fig. 1). Our records of Kuroshio responses reconstructed here date back to Marine Isotope Stage (MIS) 5.1 (∼88 ka); this is
the longest record to date, with a resolution high enough to infer orbital- to millennial-scale climate and oceanographic changes in the northern OT.
2 Oceanographic background
The OT is a back-arc basin of the Ryukyu trench–arc–basin system (Lee et al., 1980). It is bounded by the Ryukyu Ridge and Trench to the east and the wide shelf of the East China Sea (ECS) to the west. The entire complex is arcu-ate, convex toward the Pacific with a NNE–SSW alignment from Japan to Taiwan (Lee et al., 1980). The OT is a big graben, consisting of the topographic depression behind the Ryukyu Arc with a length of 1200 km and a width of 100– 150 km. Since the middle Miocene with the opening of the OT (Sibuet et al., 1987), it has been a depositional center in the ECS and has received a very large supply of sediment from nearby continents.
The modern hydrographic characteristics of surface water masses in the OT are controlled by the Yangtze River runoff
Figure 1. The pink star indicates core CSH1. The open circles means other cores mentioned in this study and the triangles denote the stalagmite caves in East China. Arrows denote simplified sur-face currents in the study region. The blue dashed curve stands for the−120 m isobath.
and the Kuroshio (Lie and Cho, 2002). The Yangtze River carries huge amount of terrigenous materials and nutrients into the OT (Lie et al., 2003), which are responsible for the high surface productivity in the ECS. The Kuroshio is charac-terized by a high temperature and high salinity. After separat-ing from the North Equatorial Current (Sawada and Handa, 1998), it flows across the Philippine Sea and along the east of Taiwan, entering the OT and flowing northwards along the trough. In the northern OT and the southern Kyushu, the main axis of the Kuroshio turns eastward, crosses the Ryukyu Arc through the Tokara Strait and then continues to flow north-eastwardly into the northwestern Pacific Ocean at∼38◦N.
Another branch of the Kuroshio, the TWC, flows into the Sea of Japan through the Tsushima Strait. Because of the strong intrusion of the Kuroshio, the hydrographies are character-ized by high temperature and salinity as well as a great depth of the thermocline (DOT) in the OT (Jian et al., 2000a). In contrast, the hydrographies are characterized by lower tem-perature and salinity and shallow DOT in the adjacent ECS shelves.
Table 1.Details of age controlling points of accelerator mass spectrometry radiocarbon (AMS14C) andδ18O of planktonic foraminifera in core CSH1 used for age model reconstruction.
Depth Materials AMS14C Error Range (1δ) Calibrated age Sedimentation rate Source (cm) (yr) (yr) (cal yr BP) (cm ka−1)
10 N. dutertrei 3420 ±35 3261–3339 3301 this study
106 N. dutertrei 7060 ±40 7500–7580 7542 22.6 this study
150 N. dutertrei 10 840 ±50 12 220–12 392 12 328 9.2 this study 318 N. dutertrei 15 130 ±80 17 718–18 029 17 913 30.1 Chen et al. (2006) 362 mixing species 16 990 ±140 19 476–19 510 19 746 24.0 Chen et al. (2006) 558 N. dutertrei 20 650 ±120 23 975–24 339 24 161 44.4 this study 678 mixing species 22 430 ±240 26 084–26 805 26 472 51.9 Chen et al. (2006) 742 N. dutertrei 25 440 ±210 29 644–29 746 29 904 18.6 this study 850 N. dutertrei 27 810 ±290 31 283–31 789 31 572 64.7 this study 1002 mixing species 34 050 ±850 37 152–39 359 38 414 22.2 Chen et al. (2006) 1058 MIS 3.13 ±4710 43 880 10.2 this study 1210 MIS 3.3 ±3850 50 200 24.1 this study 1282 MIS 3.31 ±5030 55 450 13.7 this study 1346 MIS 4.22 ±6350 64 090 7.4 this study
1530 MIS 5 ±2590 73 910 18.7 this study
1610 MIS 5.1 ±3580 79 250 15.0 this study
3 Materials and methods
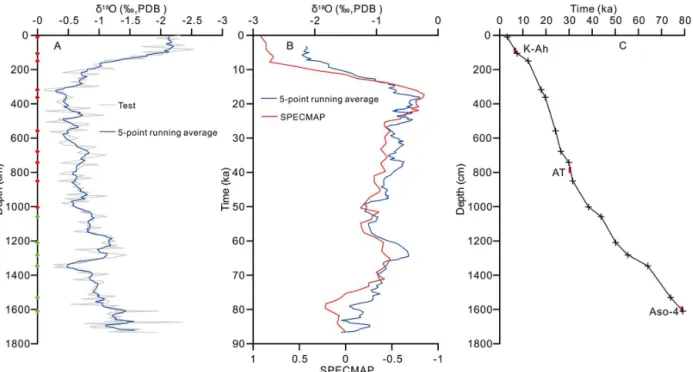
The core CSH1 (31◦13.7′N, 128◦43.4′E, water depth 703 m), which has with a length of 17.3 m, was taken from the northern OT using a piston corer during the Xiang Yang Hong Cruise in 1998. The sediments of the core mainly con-sist of black-gray and gray silt or clayey silt, with shell frag-ments and foraminifera occurring throughout the core (Ge et al., 2007). Initial core descriptions for CSH1 indicated that the core is continuous without interruption by any visible turbidites but contains three volcanic ash layers (Ge et al., 2007; Wu et al., 2004). In this study, we performed high-resolution sampling at 4 cm intervals that resulted in a total of 434 samples for this analysis. Based on our accelerator mass spectrometry (AMS)14C dating andδ18O stratigraphy of planktonic foraminifera (Table 1), the bottom age of CSH1 is∼88 ka, equivalent to MIS 5.1 (Fig. 3).
3.1 Grain size analysis
The sediment grain size was measured by Malvern MS-2000 laser diffraction in the Key Laboratory of Marine Sed-imentology and Environment Geology in the First Institute of Oceanography, State Oceanic Administration (SOA). The equipment has a dynamic range of 0.02–2000 µm with a res-olution of 0.01ϕ. After removing the organic matter (10 % H2O2)and carbonate (1 M HCl) from the sediment samples, the residual samples were standing for 12 h to make it fully precipitate. The residuals were then measured for grain size analysis after adding into sodium hexametaphosphate.
3.2 Planktonic foraminiferal fauna analysis
The samples for planktonic foraminiferal fauna analysis was first dried in the oven at 50◦C, weighed and then placed in water for 72 h. The samples were washed through a 63 µm sieve to remove the fine fraction and the identification of planktonic foraminiferal fauna specimens was done based on census counting of at least 300 specimens>154 µm. All 26 species of planktonic foraminifera were identified and the relative abundances of each planktonic foraminiferal species were calculated based on the classification scheme (Table 2). 3.3 Analysis forδ18O,δ13C and AMS14C
Stable oxygen and carbon isotopes (δ18O and δ13C) of 199 downcore samples were measured using∼30 specimens of planktonic foraminifera Globigerinoides ruber and an Iso-prime stable isotope mass spectrometer at Bremen Univer-sity. The analysis error for δ18O and δ13C is <0.06 and 0.03 ‰, respectively.
AMS14C ages were measured based on analysis of∼500
specimens ofNeogloboquadrina dutertrei(>150 µm) at 12 stratigraphic horizons using the AMS at the Leibniz Labora-tory for Radiometric Dating and Isotope Research, Kiel (Ta-ble 1).
3.4 Alkenone sea surface temperature (SST) analysis
Dried and homogenized sediment samples were extracted three times using a mixture of dichloromethane and methanol (97:3). The unsaturated alkenones were isolated from
Table 2.Descriptive statistics of planktonic foraminiferal species and Q-mode varimax factor analysis for core CSH1.
SD (%) Min (%) Average (%) Max (%) F1 F2 F3 F4
Orbulina universa 1.57 0 0.24 0.26 0.03 0.16 0.05 0.29
Globigerinoides conglobatus 1.03 0 0.1 0.17 −0.05 0.51 −0.16 0.17
Globigerinoides ruber 22.34 5.25 11.59 3.28 0.10 0.94 0.01 0.14
Globigerinoides tenellus 3.52 0 1.04 0.66 0.09 0.71 0.09 −0.03
Globigerinoides sacculifer 5.35 0.17 1.7 1.14 −0.04 0.54 −0.22 0.17 Globigerinella aequilateralis 2.62 0 0.37 0.42 −0.03 0.43 −0.32 0.15
Gloigerina calida 2.82 0 0.68 0.61 −0.06 0.47 −0.28 0.11
Globigerina bulloides 53.79 9.4 22.4 7.93 0.98 0.13 0.17 −0.05
Globigerina falconensis 5.38 0 1.39 1.19 −0.01 0.10 0.05 0.14
Globigerina digitata 0.4 0 0.01 0.05 −0.03 0.18 −0.15 −0.01
Globigerinoides rubescens 2.22 0 0.68 0.5 0.20 0.71 0.09 −0.05
Globigerina quinqueloba 8.86 0 2.34 1.43 0.11 0.32 0.58 −0.08
Neogloboquadrina pachyderma(sin.) 0.67 0 0.1 0.14 0.01 −0.14 0.45 0.04 Neogloboquadrina pachyderma(dex.) 25.89 0.14 10.49 5.8 −0.08 −0.20 0.96 0.16
N dutertrei 34.52 8.28 21.59 5.69 0.07 0.13 0.44 0.88
Globoquadrina conglomerata 0.67 0 0.02 0.08 −0.11 −0.01 0.10 0.07
Pulleniatina obliquiloculata 6.79 0 1.8 1.45 0.00 0.62 −0.40 0.38
Globorotalia inflata 11.26 0.18 4.9 2.64 −0.11 −0.03 −0.05 0.52
Globorotalia truncatulinoides(sin.) 0.73 0 0.05 0.12 −0.06 −0.07 −0.10 0.34 Globorotalia truncatulinoides(dex.) 2.04 0 0.27 0.35 0.04 −0.15 0.32 0.01
Globorotalia crassaformis 5.74 0 0.95 0.76 0.02 0.33 −0.09 0.05
Globorotalia menardii 1.11 0 0.17 0.23 0.04 0.33 −0.35 0.32
Globigerinita glutinata 25.03 1.08 6.99 5.05 0.16 0.95 −0.17 −0.15
% of Variance 44.84 22.88 15.73 12.28
Cumulative % 44.84 67.72 83.46 95.74
Note: High factor loading (bold type) indicates the primary species contributing to each factor.
Figure 2.Monthly temperature and salinity for the upper 400 m of the water column in the northern Okinawa Trough at 131–132◦E and 28–29◦N. (Data source: JODC (Japan Oceanographic Data Center) Data On-line Service System).
nitrogen gas, the extracts were separated into four fractions using column chromatography. N-C36H74 was added as an internal standard to alkenone. Unsaturated alkenones were analyzed using a HP6890 Gas chromatography with on-column injection, an electronic pressure control system and a flame ionization detector. The experimental procedures of
Figure 3. (a)δ18O of planktonic foraminiferaG.ruberplotted against depth (cm) for core CSH1. The age control point for AMS14C and δ18O are indicated by the red and green diamonds, respectively.(b)Five-point running averageδ18O of planktonic foraminiferaG. ruberfor core CSH1 and the SPECMAP (Spectral Maping Project) curve (Martinson et al., 1987) plotted against age over the last 88 ka.(c)Plot of measured ages vs. depth for core CSH1. The three known ash layers are indicated by solid red rectangles.
(Muller et al., 1998):
U37k′ =C37:2Me/(C37:2Me+C37:3Me), (1) SST (◦C)=(U37k′−0.044)/0.033. (2) The analytical error forU37k′ is 0.006, which translates into an error of 0.2◦C in estimating SST.
3.5 Salinity
The planktonic foraminiferaδ18O (δ18Opf) is controlled by seawaterδ18O (δ18Osw) and local SST. In the northern OT, higher contents of unsaturated alkenones, observed in the upper water column of ∼20 m, and the estimated
temper-ature are consistent with the modern observation based on the sediment trap samples (Nakanishi et al., 2012). Coccol-ithophore fluxes are high throughout the year, except for the summer season in the ECS (Tanaka, 2003). Therefore, alkenone-derived SST could be used to obtain annual mean SSS (sea surface salinity) estimates in the northern OT. For
G. ruber, Mulitza et al. (2004) established the following cor-relation between temperature andδ18O:
T =14.32−4.28×(δ18Opf−δ18Osw) (3)
+0.07(δ18Opf−δ18Osw)2,
where δ18Osw is related to local SST, evaporation and precipitation. In the areas influenced by the Kuroshio,
there is the following relationship between salinity andδ18Osw(Oba, 1988):
δ18Osw=0.203×SSS−6.76. (4) In 2006, a total of 317 seawater samples collected from the Yellow Sea and ECS were analyzed for salinity andδ18Osw, which resulted in the following correlation (Du et al., 2012):
δ18Osw=0.29×SSS−9.85. (5)
Figure 4.Time series plots for contents of sand, silt and clay and the mean grain size. Gray bars indicate the intervals of impor-tant climatic events. MIS 1, 2, 3, 4 and 5 represent marine iso-tope stages. K-Ah, AT and Aso-4 refer to well-known ash layers, recorded across a wide spread of the Sea of Japan and the northern Okinawa Trough and indicated by the gray bars filled with diagonal cross. PB, YD, BA, H1, H2, LGM, H3, H4 and H5 refer to Prebo-real, Younger Dryas, Bølling–Allerød, Heinrich 1, Heinrich 2, Last Glacial Maximum, Heinrich 3, Heinrich 4 and Heinrich 5, respec-tively.
3.6 Age model
The age model for CSH1 was built by AMS 14C and planktonic foraminiferaδ18O SPECMAP (Spectral Maping Project) age controls (Fig. 3a). In the upper 1002 cm, the age control points were determined by AMS14C, while be-low 1002 cm, the age model was constructed by SPECMAP chronology (Table 2). A preliminary age model of the last 40 ka for core CSH1 was built using four AMS14C data based on mixing planktonic foraminiferal specimens (Chen et al., 2006). In this study, we constructed a more precise age model by picking up single speciesN. dutertreifor AMS14C dating from 12 samples, of which five AMS 14C dating below the core depth 1002 cm are older than 40 ka and are unused. All other AMS14C dates show no reversals (Table 2). Combined with previously reported 4 AMS14C dates, all 11 AMS14C
ages were calibrated to the calendar year by a correction for an average surface ocean carbon reservoir of 400 years (Calib 6.1) (Reimer et al., 2009). Considering that the calibrated calendar age (12.384–12.491 ka) at 178 cm conflicts slightly with the age at 158 cm (12.220–12.392 ka), the age at 178 cm is not adopted here. Finally, a total of 10 AMS14C ages were used as age control points for the upper 1002 cm in CSH1.
Theδ18O curve ofG. rubershows good correlation with the SPECMAP (Martinson et al., 1987) (Fig. 3b), which al-lows us to identify MIS 1–5.1 (Table 1). The existence of three ash layers provides independent age controls. The sed-iment grain size and susceptibility are increased at the ash layers (Ge et al., 2007). Based on the heavy mineral com-position, morphology and refractive index of volcanic glass, the first two ash layers are considered as being K-Ah (6.1– 7.5 ka) and AT (30–35 ka) (Machida, 1999), layers which are widely distributed in the Sea of Japan and the OT. The bottom ages of the two ash layers are consistent with previous re-sults – 7.54 ka (108 cm) and 30.67 ka (796 cm), respectively. The third ash layer is recognized as Aso-4 (MIS 5.1/5.2) (Machida, 1999). However, our isotope age model indicates that the bottom of the third ash layer dates to ∼79.44 ka
(1616 cm), which is slightly younger than the absolute dat-ing for Aso-4 (84–89 ka) (Machida, 1999). The age differ-ence might result from the internal discrepancy between the K-Ar dating method and SPECMAP chronology and does not affect our interpretation of the records.
Our combined AMS14C, SPECMAPδ18O and volcanic ash layer chronology generates an estimated bottom age of
∼87.4 ka for CSH1 (Fig. 3c) with an averaged sampling resolution of∼200 years. The calculated linear sedimenta-tion rate (LSR) varies from>40 cm ka−1during MIS 2 and MIS 3 to<10 cm ka−1in the last deglaciation (7.5–12.3 ka) and MIS 4 (55.5–64.1 ka).
4 Results
4.1 Grain size analysis
The grain size analysis reveals that the sediment mainly con-sists of silt and clayey silt, which varies between 36 and 81 % (Fig. 4). Except for the volcanic ash layers, the mean grain size increased during MIS 5.1 and from the last deglacial period onwards(Fig. 4a). In ash layers, the sand content in-creases significantly, while clay and silt contents decrease (Fig. 4b, c and d). The frequency distribution for sediment grain size shows a single peak in normal sediment layers, while a bimodal peak is shown in the ash layers.
4.2 Planktonic foraminiferal assemblages
Figure 5.Time series plots for the abundances of dominant species of planktonic foraminifera in core CSH1. Gray bars are the same as those in Fig. 4.
low-average abundances, they areGlobigerina bulloides,N. dutertrei, G. ruber, Neogloboquadrina pachyderma (dex.),
Globigerinita glutinata, Globorotalia inflata, Globigerina quinqueloba, Pulleniatina obliquiloculata,Globigerinoides sacculifer, Globigerina falconensis and Globigerinoides tenellus(Table 2).
The planktonic foraminiferal assemblage in CSH1 con-sists of many cold-water species. For example,N. dutertrei
mainly lives in the thermocline below the mixed layer and is a dominant species in core CSH1 with an average value of 21.6 %. The highest abundances ofN. dutertreioccurred dur-ing the LGM (Last Glacial Maximum) (26.6 %) and MIS 5.1 (26.2 %), while lower abundances appeared during MIS 1 (15 %) (Fig. 5; Table 2). In the tropical and subtropical At-lantic, higher abundances ofN. dutertreiare mainly related to upwelling (Pflaumann et al., 1996) and are indicative of the upwelling zones in the South China Sea (SCS) (Pflau-mann and Jian, 1999).N. pachyderma (dextral), is a cold-water species dominant in the Arctic and subarctic oceans (Hemleben et al., 1989). In core CSH1, the abundances of
N. pachyderma(dextral) were 2.5 % and 6.7 % during MIS 1 and MIS 5.1, respectively; while during MIS 2, MIS 3 and MIS 4, its abundances were relatively high with 15.3 %, 11.3 % and 12.7 %, respectively. Except during MIS 5.1, abundances ofN. pachyderma(dextral) were well paralleled withN. dutertrei. The abundances ofG. quinquelobawere higher during MIS 2 and MIS 4 than during MIS 1 and MIS 5.1, with an average value of 2.3 %; they also show a similar trend withN. pachyderma(dextral) (Fig. 5).G. inflata
is a “gyre margin” species in the world ocean (Hemleben et al., 1989), and the high abundances ofG. inflataoccur at the convergence zone between the Kuroshio and subpolar wa-ter mass in the weswa-tern Pacific (Thompson, 1981). In core CSH1, the abundances ofG. inflatawere lower during MIS 1 (3.1 %) and MIS 2 (3.7 %) than those in MIS 3 (5.5 %), MIS 4 (6.6 %) and MIS 5.1 (6.5 %) (Fig. 5).
Among warm-water species in CSH1,G. ruberis the most dominant and shows high abundances during interglacials and low abundances during glacials (Fig. 5). The G. ru-berabundances gradually increased from 16 ka onwards and reached a maximum in the mid-Holocene. The G. ruber
abundances decreased during H events, but were relatively high during the LGM. Another warm-water species,G. gluti-natashows a similar pattern toG. ruber. The average abun-dances of the warm-water speciesP. obliquiloculataandG. sacculiferare<2 %, but show similar patterns toG. ruber. However, the abundances ofP. obliquiloculatawere charac-terized by maxima during MIS 5.1, which were not seen in other warm-water species (Fig. 5).
The presence ofG. bulloidesandGloborotalia truncatuli-noidesin CSH1 indicate changes in upwelling.G. bulloides
Figure 6. Time series plots of δ18O and δ13C of planktonic foraminifera, contrasted with the records in cores MD982195 (Ijiri et al., 2005), MD972142 (Chen et al., 2003) and Site 184–1144 (Buhring, 2001). Gray bars are the same as those in Fig. 4.
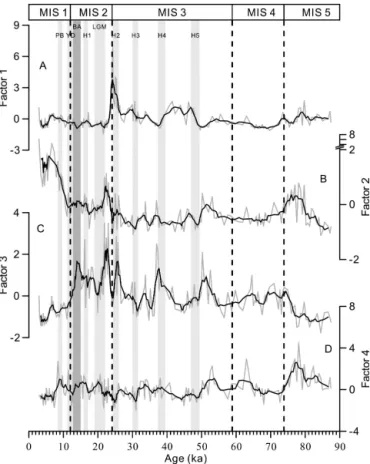
decreased and they were rarely found from 4 to 8 ka, consis-tent with the previous study from the SCS (Jian et al., 2000b). In order to reveal the correlation between the abundances of planktonic foraminiferal species, a Q-mode varimax factor analysis was used based on the abundance data of planktonic foraminiferal species from core CSH1, and four factors that explain 96 % of the total variance were extracted (Table 2). Factor 1 explains 45 % of the total variance and is composed solely of the upwelling species, G. bulloides. Factor 2 ex-plains 23 % of the total variance and is mainly composed of numerous warm-water species – G. ruber,G. conglobatus,
G. rubescens,G. tenellus,G. glutinata,G. sacculiferandP. obliquiloculata. Factor 3 explains 16 % of the total variance and consists of cold-water species –G. quinquelobaandN. pachyderma. Factor 4 explains 12 % of the total variance and is mainly composed of species indicative of a convergence zone between water masses –N. dutertreiandG. inflata. 4.3 Stable carbon and oxygen isotopes of
planktonic foraminifera
The values ofδ18O fromG. rubervary between−2.54 and
−0.11 ‰, and were heavier during MIS 2, MIS 3 and MIS 4
than those during MIS 1 and MIS 5.1 (Fig. 6a). The val-ues ofδ18Oruberduring MIS 1 were much heavier than those in MIS 5.1 (Fig. 6a), although SST values were close dur-ing both intervals. In spite of its high-frequency variation, δ18Oruber with a five-point running average in core CSH1 matches well with the SPECMAP (Martinson et al., 1987),
Figure 7. Time series plots of temperature, salinity, depth of the thermocline (DOT) and the ratio of shallow/deep species in core CSH1 as well as comparison with the abundances of G.quinqueloba, G.truncatulinoides, N.dutertrei and G.inflata in core CSH1 and other records in cores MD982195 (Ijiri et al., 2005) and DGKS9604 (Yu et al., 2009). Salinity values are given as the difference from the present-day climate,1S. Both the distributions ofN. dutertreiandG.inflataare related to DOT, but they show dif-ferent down-core profiles in core CSH1. Gray bars are the same as those in Fig. 4.
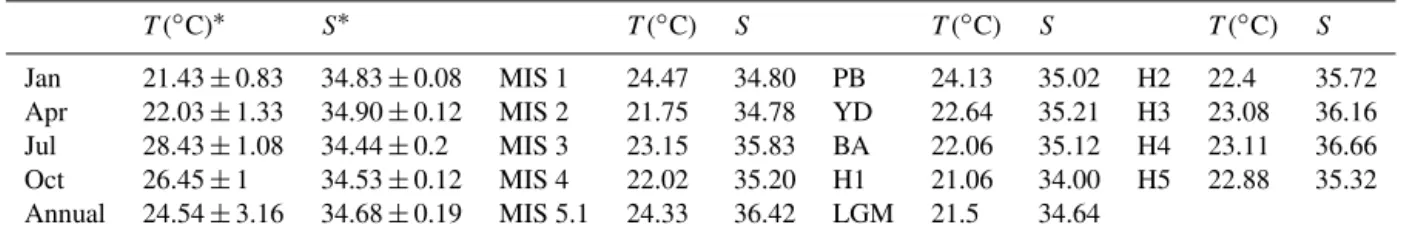
Table 3.Average SST and SSS from proxies of different periods for core CSH1 and from instrumental records in the study area around 28–29◦N, 131–132◦E.
T(◦C)∗ S∗ T(◦C) S T(◦C) S T(◦C) S
Jan 21.43±0.83 34.83±0.08 MIS 1 24.47 34.80 PB 24.13 35.02 H2 22.4 35.72 Apr 22.03±1.33 34.90±0.12 MIS 2 21.75 34.78 YD 22.64 35.21 H3 23.08 36.16 Jul 28.43±1.08 34.44±0.2 MIS 3 23.15 35.83 BA 22.06 35.12 H4 23.11 36.66 Oct 26.45±1 34.53±0.12 MIS 4 22.02 35.20 H1 21.06 34.00 H5 22.88 35.32 Annual 24.54±3.16 34.68±0.19 MIS 5.1 24.33 36.42 LGM 21.5 34.64
Note: data (∗) obtained from the JODC Data On-line Service System.
(Buhring, 2001) and MD972142 (Chen et al., 2003) in the SCS.
The value ofδ13Cruberranges between−0.61 and 1.45 ‰ with the lowest values in H2 (24 ka) and has gradually be-come heavier since then (Fig. 6b). The13C enrichment is also recorded in Site 184 (Buhring, 2001), MD972142 (Chen et al., 2003) and MD982195 (Ijiri et al., 2005). However, dur-ing MIS 5.1,δ13Crubershowed reverse a trend, in contrast to Site ODP184 (Buhring, 2001) and core MD972142 (Chen et al., 2003). Theδ13C value in planktonic foraminiferal shell is controlled by many factors, including theδ13C of the lo-cal seawater, vital effects, the habitat fauna species and post-depositional dissolution (Mulitza et al., 1999). The difference between δ13C curves from CSH1, Site ODP184 (Buhring, 2001) and MD972142 (Chen et al., 2003) suggests different surface ocean hydrology in the OT and SCS during MIS 5.1. From 6 to 20 ka, δ13Cruber values in core DGKS9603 from the middle Okinawa Trough showed lighter values, which was interpreted as reflecting an invasion of oligotrophic trop-ical Pacific water (Li et al., 2002) but which was not observed in CSH1. This indicates a more complicated spatial pattern of δ13C in the seawater in the OT which is far beyond our current understanding.
4.4 Alkenone SST
In core CSH1, alkenone SST varies from 21 to 25◦C with an average of 23◦C. The average SSTs during MIS 1 (24.5◦C) and MIS 5.1 (24.4◦C) were more or less simi-lar and these values are much higher than MIS 2 (21.8◦C), MIS 3 (23.1◦C) and MIS 4 (22◦C) (Table 3). The average SST since 8 ka is close to the annual mean SST from instru-mental observations near the site (∼24.87◦C) (Table 3), in-dicating that the alkenone SST mainly reflects annual mean temperature. The CSH1 SSTs during MIS 2 and MIS 4 were similar and were lower than modern SST by 2.5◦C. During the LGM, the alkenone SST varied from 21 to 22◦C, with an average of 21.5◦C, which was lower than modern SST by 3.4◦C. Since 17 ka, the CSH1 alkenone SST values have increased rapidly from 21 to 25◦C. Compared to other SST records in cores DGKS9604 and MD982195 from the OT, the CSH1 SST record shows a similar pattern but is slightly
higher than that of MD982195 (Ijiri et al., 2005) and lower than that of DGKS9604 (Yu et al., 2009) (Fig. 7a).
4.5 Sea surface salinity
Our SSS estimate for core CSH1 shows large fluctuations (Fig. 7b). During MIS 1 and MIS 2, the SSS was similar (34.8 and 34.8, respectively) (Table 3), consistent with the modern annual mean SSS (34.7) near this site. The SSS val-ues were much higher in MIS 3 (35.8), MIS 4 (35.2) and MIS 5.1 (36.4), with maxima occurring during MIS 5.1 and mid-MIS 3 (Fig. 7b, Table 3). During cold periods, such as the LGM and H events/stadials, the SSS values increased. These high SSS values suggest less precipitation and/or river runoff relative to evaporation than today in the northern OT.
4.6 Depth of the thermocline (DOT)
Our DOT estimate using the planktonic foraminiferal trans-fer function (Andreasen and Ravelo, 1997) for CSH1, which is based on the spatial distribution of 189 core-top planktonic foraminifera in the tropical Pacific. The transfer function has a standard error of 22 m and an additional 5 m of error due to insufficient counts in the core top database. The result shows the changes of DOT vary from>160 m during MIS 1, and between 139 m and 141 m from MIS 2 to MIS 5.1 (Fig. 7f). DOT in core CSH1 rapidly increased from 15 ka onwards but abruptly decreased during the LGM, H events/stadials, con-sistent with what has been observed from the middle OT (Xi-ang et al., 2007). Our DOT estimate is also consistent with the implications of the changes in planktonic foraminiferal assemblages (Ravelo and Fairbanks, 1992; Ravelo et al., 1990; Thunell et al., 1983). Planktonic foraminiferal species
movement of cold subarctic water mass, weakening of the Kuroshio or stronger winter AM.
5 Discussion
5.1 Multiproxy hydrographic reconstructions
The most noticeable hydrographic changes are revealed by the faunal analysis. Our faunal Factor 1, which represents the most dominant species G. bulloidesin CSH1 (Table 2), serves as a proxy for local upwelling and may also indi-cate the changes in productivity (Anderson and Prell, 1993; Emeis et al., 1995; Peeters et al., 2002). In surface sediments in the northern OT, the abundances ofG. bulloidesare high in the ECS shelves and mainly related to lower SSS and high-nutrient water with an average abundance of 12 % (Xu and Oda, 1999). In the marginal seas of the northwestern Pacific, higher abundances ofG. bulloidesare mainly associated with upwelling (Ijiri et al., 2005; Xiang et al., 2007). High Factor 1 scores and G. bulloidesabundances during the late MIS 3 (Figs. 5 and 8a) may be linked to strong upwelling with an increased nutrient supply that triggers high productivity.
The faunal Factor 2 represents warm-water speciesG. ru-ber,G. glutinataandP. obliquiloculata(Table 2), serving as a better proxy for Kuroshio intrusion into the OT that further regulates the strength of the TWC. The same modern plank-tonic foraminera assemblages can also be found in the sur-face sediments of the OT and Ryukyu Arc region, which is closed related to the Kuroshio (Thompson, 1981; Ujiie and Ujiie, 2000).We could thus infer that the higher scores of Factor 2 during MIS 5.1 and MIS 1 (Fig. 8b) reflect a stronger Kuroshio intrusion into the northern OT.
The faunal Factor 3 includes cold-water speciesN. pachy-derma (dex.) andG. quinqueloba, higher scores of which in-dicate increased influence of cold water entering the northern OT.N. pachyderma (dex.) andG. quinquelobamainly live in arctic and subarctic waters. In the modern surface sediments of the ECS, however, the abundances ofN. pachydermaare very low (Xu and Oda, 1999). From 12.5 to 24 ka, the higher Factor 3 scores and abundances of N. pachyderma (dex.) (Figs. 5 and 8c) along with low-alkenone SST (Fig. 7) indi-cate a strong invasion of cold water, which is related to the southward shift of the subarctic front and an abrupt north-ward shift of the front by 12 ka. The higher abundances ofG. quinquelobain the surface sediments of the ECS are mainly limited in the Yangtze Estuary region with low SSS and SST, indicating the influence of cold, low-salinity coastal water masses (Xu and Oda, 1999). High abundances of G. quin-quelobaare linked to low SSS before 18 ka, the late MIS 3 and the early MIS 4 (Fig. 7b and c), indicating an increased river runoff effect or increased precipitation versus evapo-ration in the northern OT while the sea level was relatively lower. During the LGM and H events/stadials, the decreased abundances of G. quinqueloba correspond well to the
in-Figure 8.Time series plots of the four main factor scores for plank-tonic foraminiferal assemblages. Gray bars are the same as those in Fig. 4.
creased SSS, which reflects stronger winter and/or weaker summer AMs.
Factor 4 is mainly composed of the species related to the DOT, includingG. inflataandN. Dutertrei(Hemleben et al., 1989). In the regions of the Kuroshio and the Taiwan Warm Current, the abundances ofN. dutertrei in modern surface sediments are as high as 20–40 % (Wang et al., 1988). In the ECS and the northern OT, the high abundances ofN. dutertrei
in the surface sediments appear to be associated with transi-tional zones between the Kuroshio and coastal water (Li et al., 2007). In CSH1, high abundances ofN. dutertrei corre-late well with the shallower DOT (Fig. 7), suggesting that the Factor 4 scores and N. dutertrei abundances are indicative of nutrient and upwelling conditions. ThoughG. inflata is also a species indicative of strong mixing (Thompson, 1981), in core CSH1, its abundances show no correlation with the DOT (Fig. 7). We consider that the abundances ofG. inflata
may respond to nutrient distributions (Cléroux et al., 2007), or more extreme or short-lived upwelling conditions that are not well captured by the DOT transfer function used in this study.
method. The local SSS in the northern OT is mainly regu-lated by two factors – river runoff and oceanic high-salinity water brought by the Kuroshio. The effects of both factors are constrained by the sea level. In addition, the upwelling may also bring saline water to the surface. In our CSH1 SSS record, the SSS values are∼2 times higher than that of
to-day during MIS 5.1, while the SST difference between MIS 1 and MIS 5.1 is∼0.3◦C, which translates to only∼0.066 ‰
as a temperature effect in driving δ18Oruber changes. How-ever, theδ18Oruberdifference between MIS 1 and MIS 5.1 is
∼0.74 ‰, which cannot be affected by temperature change. Therefore, this observation suggests that the much heavier δ18Oruber in MIS 5.1 and the whole CSH1δ18Oruber record must be dominated by other factors, such as local SSS and regional precipitation versus evaporation.
This estimation, along with the higher abundances of
P.obliquiloculata(Fig. 5), suggests stronger intrusion of the Kuroshio into the northern OT. During the conditions of lower sea levels, the saline Kuroshio water intrusions were weakened. As seen from the faunal records in the late MIS 3 (Fig. 5), the increased CSH1 SSS values coincide with higher abundances ofG. bulloidesand Factor 1,which are strong in-dications of strong upwelling in the northern OT (Li et al., 2007). After 16 ka, though the global sea level has risen, the saline intrusion of the Kuroshio might be counteracted by fresh river runoff water from increased regional precipitation brought by intensified summer AM (Wang et al., 2001, 2008; Yuan et al., 2004), resulting in low-SSS conditions since then (Fig. 7b). During the LGM and H events/stadials, the SSS values were significantly increased (Fig. 7b). The δ18O of stalagmites in East China showed weakened summer AM at the time (Wang et al., 2001, 2008; Yuan et al., 2004), causing regional aridity and less precipitation/river runoff from the Yangtze and Huanghe rivers (Fig. 9), which are responsible for the high-saline water in the northern OT. In addition, the stronger winter AM during the cold episodes may have in-tensified the surface water mixing, which also helps increase the SSS.
Evidence from our CSH1 SSTs, SSSs, DOTs and P. obliquiloculata abundances support the idea that the strength of the Kuroshio and the TWC has been responding to gional and global climate forcing for the last 88 ka. The re-sponses of the Kuroshio to climate are exemplified in the lower SST, SSS, shallower DOT and lower abundances ofP. Obliquiloculata (Fig. 9), which imply weakened Kuroshio intrusion into the northern OT during the LGM. During MIS 1 and MIS 5.1, evidence of higher SST, SSS and higher abundances of P. obliquiloculata (Fig. 9) indicate strong Kuroshio intrusion. Low-sea-level conditions appear to block or decrease the intrusion of the Kuroshio into the OT. It is exemplified by the lower SST and lower abundances of P. obliquiloculataduring MIS 3 and MIS 4 when compared to MIS 1 and MIS 5.1. Our records show consistent evidence provided from core MD982195 (Ijiri et al., 2005) (Fig. 1), indicating that it is a robust regional pattern in the
north-ern OT. Previous studies also suggest that the strength of the Kuroshio was weakened abruptly during the late Holocene (Jian et al., 2000a; Li et al., 1997; Shieh et al., 1997), a mysterious short-lived episode that may imply a weakened Kuroshio. It was possible to find this event in CSH1 (Fig. 5), suggesting that it is also a robust regional feature with a greater spatial scale in the main Kuroshio region. Despite disagreement between studies using paleoceanographic data and modeling approaches on whether or not the Kuroshio en-tered the OT during glacial low-sea-level conditions (Lee et al., 2013; Ujiié and Ujiié, 1999), our evidence shows that the high-SST and -SSS conditions and Kuroshio-indicative planktonic foraminifera existed in at least one major branch of the Kuroshio in the northern OT. Though the volume trans-port of the Kuroshio responds to the trade wind (Sawada and Handa, 1998), which may cause regional variability of Kuroshio intrusion into the OT, our multiproxy records show homogenous responses in the OT and suggest that the Kuroshio is the most dominant mechanism governing the hy-drographic variations over the past 88 ka.
5.2 Millennial-scale responses of the Kuroshio
Our multiproxy hydrographic records present clear evidence for high-frequency, millennial-scale fluctuations in the re-sponses of the Kuroshio. The high-frequency component in CSH1δ18Oruber shares similar features with foraminifer δ18O in MD982195 (Ijiri et al., 2005) and GISP2 ice core δ18O (Stuiver and Grootes, 2000). Our CSH1 alkenone SST shows abrupt decreases and 3.5, 2.1, 1.5, 1.4 and 1.7◦C lower than modern values during the short-term inter-vals of 15.8–17.1, 24.3–26, 29.9–31.6, 37.3–39.5 and 46.9– 49.4 ka, respectively (Fig. 7a). Moreover, the average values of δ18Oruber during those periods are relatively heavier by 1.43, 1.65, 1.48, 1.59 and 1.15 ‰, respectively, than that in the most recent cooling at∼8 ka (−2.12 ‰). The timing of
Figure 9. Time series plots of temperature, salinity, depth of the thermocline and the contents ofP. obliquiloculata, compared to sea level (Cutler et al., 2003);δ18O curve of cave stalagmite from East China (Wang et al., 2001, 2008; Yuan et al., 2004); grain size of Xifeng loess (Guo et al., 2009). Gray bars are the same as those in Fig. 4.
5.3 Orbital-scale responses of the Kuroshio
Precession forcing that changes the seasonal distributions of incoming solar insolation is a well-known factor in driving past monsoon variability. In core CSH1, the spectral analy-sis ofδ18Oruber, SST, SSS and DOT and the abundances ofG. ruber,P. obliquiloculataandN. pachyderma(dex.) all show a common frequency during the precession cycles (near 24 ka, Fig. 10), indicating that precession forcing plays an impor-tant role in regulating the hydrographic changes in the north-ern OT.
Though the orbital-scale Kuroshio responses to the AM were identified in our spectral analysis of the hydrographic records, the controlling mechanisms of Kuroshio hydrogra-phies are much more complicated than the mechanism in-terpreted solely on the basis of an AM mechanism. For ex-ample, both SST and SSS values were high during MIS 5.1
(Fig. 7). The average SST was close to the modern long-term instrumental observation value but the SSS was∼1.6 higher than today. While the summer AM is considered stronger during this specific episode, the high SSS and low abundances of the coastal-water species (Fig. 7) G. quin-quelobasuggest a reduced river runoff, which conflicts with the condition of higher precipitation by enhanced summer AM. Moreover, during MIS 5.1, higher abundances of P. obliquiloculata suggest stronger Kuroshio (Fig. 5). In this context, we consider that the Kuroshio climate in MIS 5.1 is warm but dry, which is detectable from the other episodes in the western Pacific and East Asian paleoclimate (Ikehara and Oshima, 2009; Morley et al., 1991; Sun et al., 2003).
During MIS 4, the sea level fell and brought the CSH1 site closer to the coastline (Cutler et al., 2003) (Fig. 9). Increased river runoff caused decreased SSS values and increased abun-dances of the coastal-water species G. quinquelobaduring this time interval, while the abundances ofP. obliquiloculata
remained low, indicating a weakened Kuroshio intrusion. In particular, during MIS 4, the abundances ofG. quinqueloba
decreased, corresponding well with the increased SSS. The Chinese loess grain size (>32 µm) indicates that the winter AM intensified during MIS 4.2 (Guo et al., 2009) (Fig. 9) and echoed the scenario reconstructed here. In addition, dur-ing MIS 4 the higher abundances ofN. pachydermaindicate a southward migration of subarctic water, suggesting coher-ent atmospheric and oceanic changes in response to northern hemispheric cooling.
Our alkenone SST and SSS reached maxima during the early MIS 3 (∼50 ka) and mid-MIS 3 (∼35 ka) and rapidly decreased from ∼35 ka onwards (Fig. 9). However, lower abundances of P. obliquiloculata during MIS 3 suggest a weakened Kuroshio intrusion (Fig. 9), which may have been caused by a partial blocking of gateways into the OT with relatively low sea levels during this time. The MIS 3 climate was interrupted by several millennial-scale, high-abundance episodes ofN. pachydermaandG. inflata, indicating rapid cooling of surface seawater (Fig. 5). The increased abun-dances of the upwelling speciesG. bulloides and Factor 1 scores (Figs. 5 and 8) suggest that the MIS 3 climate was characterized by a strengthened winter AM, with more fre-quent southward shifting of the subarctic front and weakened Kuroshio intrusion into the northern OT mainly due to lower sea levels.
Figure 10.Power spectrum of theδ18O, SST (sea surface temperature), SSS (sea surface salinity), depth of the thermocline and the abun-dances ofP.obliquiloculataandN.pachyderma(dex.) time series. All proxies show a common frequency during the precession cycles (near 24 ka).
conditions indicates a weakened Kuroshio, which may have been diverted into the open northwestern Pacific at lower lat-itudes. The hydrographic conditions during the LGM and H1 appear to not be well explained by the AM, as weakened summer AM at these cold intervals would cause low SST and high SSS, which are inconsistent with our reconstructions.
Since 12 ka, while the global climate has continued to be much warmer, our SST values have increased, respond-ing to the rise in sea level and stronger intrusion of the Kuroshio into the northern OT. The stronger Kuroshio in response to rising sea levels is evidenced by higher abun-dances of warm-water species and ofP. obliquiloculata. The lower abundances of G. quinquelobaindicate a reduced in-fluence of coastal water since 12 ka. The abundances of
N. pachyderma (dex) decreased abruptly, indicating a rapid northward shift of the subarctic frontal zone. Therefore, our reconstruction supports the idea that the Kuroshio is the main factor that controlling the hydrographic evolution in the northern OT since 12 ka.
6 Conclusions
Based on AMS 14C and δ18O correlation, a new high-resolution hydrographic record was first established with an
extension down to 88 ka in the northern OT. Multiproxies, including alkenone SST,δ18O deconvoluted SSS, planktonic foraminiferal assemblages and the DOT from core CSH1, suggest that the hydrography of the surface water in the OT is a homogenous system that has responded dramatically mainly to the global sea level, the Kuroshio, AM and sub-arctic front. The main conclusions are as following:
1. The surface hydrologic variability in the northern OT of the past 88 ka shows sensitive responses to the abrupt climate changes. During MIS 1 and MIS 5.1, the sur-face hydrology was dominated by the Kuroshio while the sea level was relatively high. During MIS 2, 3 and 4, however, stronger winter AM and a southward mean position of the subarctic front played more important roles in governing the hydrographic conditions. 2. On millennial timescales, five abrupt events with
3. All proxies show a common frequency near the pre-cession cycles, suggesting an important monsoon-controlled mechanism in the surface water in the OT. During MIS 5.1, the ocean climate in the northern OT was warm but dry, which was detectable from the other episodes in the western Pacific and the East Asian pale-oclimate. During MIS 4 and MIS 2, the ocean climate was dry and cold, which is thought to be mainly due to stronger winter AM and southward shifts of the subarc-tic front. During MIS 3, the ocean climate was charac-terized by a strengthened summer AM but interrupted by millennial-scale cooling events, indicating a rapid latitudinal shifting of the subarctic front and weakened Kuroshio intrusion into the northern OT. During MIS 1, the Kuroshio returned as a main factor controlling the hydrographic evolution in the northern OT.
Acknowledgements. This study was supported by the National Natural Science Foundation of China (Grant no. 40710069004, 40431002, 41206059, 41221004), by the Basic Scientific Fund for National Public Research Institutes of China (no. 2012G31, GY0213G23) and by the Youth Foundation of the State Oceanic Administration People’s Republic of China (2012301). We thank Yoshiki Saito (Geological survey of Japan) for helping to determine the reflectance of volcanic glass. We also thank Min-Te Chen (Taiwan Ocean University) and two anonymous reviewers for providing insightful comments and suggestions, which greatly improved the quality of the paper.
Edited by: M.-T. Chen
References
Anderson, D. M. and Prell, W. L.: A 300 Kyr Record of Upwelling Off Oman during the Late Quaternary: Evidence of the Asian Southwest Monsoon, Paleoceanography, 8, 193–208, 1993. Andreasen, D. J. and Ravelo, A. C.: Tropical Pacific Ocean
ther-mocline depth reconstructions for the Last Glacial Maximum, Paleoceanography, 12, 395–413, 1997.
Bintanja, R., van de Wal, R. S. W., and Oerlemans, J.: Modelled at-mospheric temperatures and global sea levels over the past mil-lion years, Nature, 437, 125–128, 2005.
Bond, G., Heinrich, H., Broecker, W., Labeyrie, L., McManus, J., Andrews, J., Huon, S., Jantschik, R., Clasen, S., and Simet, C.: Evidence for massive discharges of icebergs into the North At-lantic ocean during the last glacial period, Nature, 360, 245–249, 1992.
Bond, G. C., Showers, W., Elliot, M., Evans, M., Lotti, R., Hajdas, I., Bonani, G., and Johnson, S.: The North Atlantic’s 1–2 Kyr Cli-mate Rhythm: Relation to Heinrich Events, Dansgaard/Oeschger Cycles and the Little Ice Age, in: Mechanisms of Global Climate Change at Millennial Time Scales, edited by: Clark, P. U., Webb, R. S., and Keigwin, L. D., American Geophysical Union, 35–58, 1999.
Buhring, C.: East Asian Monsoon variability on orbital- and millennial-to-sub-decadal time scales, Ph.D thesis, University of Kiel, 164 pp., 2001.
Chang, Y.-P., Wang, W. L., Yokoyama, Y., Matsuzaki, H., Kawa-hata, H., and Chen, M. T.: Millennial-scale planktic foraminifer faunal variability in the East China Sea during the past 40 000 years (IMAGES MD012404 from the Okinawa Trough), Terr. Atmos. Oc. Sci., 19, 389–401, 2008.
Chang, Y.-P., Wang, W.-L., and Chen, M.-T.: The last 100 000 years’ palaeoenvironmental changes inferred from the diatom as-semblages of core MD012404 from the Okinawa Trough, East China Sea, J. Quat. Sci., 24, 890–901, 2009.
Chen, J., Zhang, D., Zhang, W., and Li, T.: The paleoclimatic change since the last galciation in the north of Okinawa Trough based on the spore-pollen records, Acta Oceanologica Sinica, 28, 85–91, 2006 (in Chinese with English Abstract).
Chen, M.-T., Shiau, L.-J., Yu, P.-S., Chiu, T.-C., Chen, Y.-G., and Wei, K.-Y.: 500 000-Year records of carbonate, organic carbon, and foraminiferal sea-surface temperature from the southeast-ern South China Sea (near Palawan Island), Palaeogeography, Palaeoclimatology, Palaeoecology, 197, 113–131, 2003. Cléroux, C., Cortijo, E., Duplessy, J.-C., and Zahn, R.:
Deep-dwelling foraminifera as thermocline temperature recorders, Geochemistry, Geophysics, Geosystems, 8, Q04N11, doi:10.1029/2006GC001474, 2007.
Coplen, T. B.: Calibration of the calcite–water oxygen-isotope geothermometer at Devils Hole, Nevada, a natural laboratory, Geochimica et Cosmochimica Acta, 71, 3948–3957, 2007. Cutler, K. B., Edwards, R. L., Taylor, F. W., Cheng, H., Adkins, J.,
Gallup, C. D., Cutler, P. M., Burr, G. S., and Bloom, A. L.: Rapid sea-level fall and deep-ocean temperature change since the last interglacial period, Earth Planet. Sci. Lett., 206, 253–271, 2003. Du, J.-Q., Chen, M., Cao, J.-P., Qiu, Y.-S., Tong, J.-L., Ma, Q., and Yang, J.-H.: Oxygen isotope in seawater and its hydrolog-ical implication in the southern Yellow Sea and the East China Sea, Oceanologia et Limnoloia Sinica, 43, 1057–1066, 2012 (in Chinese with English Abstract).
Emeis, K.-C., Anderson, D. M., Doose, H., Kroon, D., and Schulz-Bull, D.: Sea-Surface Temperatures and the History of Monsoon Upwelling in the Northwest Arabian Sea during the Last 500 000 Years, Quat. Res., 43, 355–361, 1995.
Ge, S., Shi, X., Wu, Y., Lee, T., Xiong, Y., and Saito, Y.: Rock mag-netic property of gravity core CSH1 from the northern Okinawa Trough and the effect of early diagenesis, Ac. Oceanol. Sinica, 26, 54–65, 2007.
Guo, Z. T., Berger, A., Yin, Q. Z., and Qin, L.: Strong asymmetry of hemispheric climates during MIS-13 inferred from correlat-ing China loess and Antarctica ice records, Clim. Past, 5, 21–31, doi:10.5194/cp-5-21-2009, 2009.
Hemleben, C., Spindler, M., and Anderson, O. R.: Modern plank-tonic foraminifera, Springer, Berlin, 1989.
Hsueh, Y.: The Kuroshio in the East China Sea, J. Mar. Syst., 24, 131–139, 2000.
Hsueh, Y., Wang, J., and Chern, C. S.: The Intrusion of the Kuroshio across the continental-shelf northeast of Taiwan, J. Geophys. Res.-Oc., 97, 14323–14330, 1992.
China Sea during the past 42 000 years, Palaeogeogr. Palaeoclim. Palaeoecol., 219, 239–261, 2005.
Ikehara, K. and Oshima, H.: Orbital- and millennial-scale fluctu-ations in late Quaternary marine pollen records from the Japan Sea, J. Quat. Sci., 24, 866–879, 2009.
Jian, Z. M., Saito, Y., Wang, P. X., Li, B. H., and Chen, R. H.: Shifts of the Kuroshio axis over the last 20 000 years, Chinese Science Bulletin, 43, 1053–1056, 1998.
Jian, Z., Wang, P., Saito, Y., Wang, J., Pflaumann, U., Oba, T., and Cheng, X.: Holocene variability of the Kuroshio Current in the Okinawa Trough, northwestern Pacific Ocean, Earth Planet. Sci. Lett., 184, 305–319, 2000a.
Jian, Z. M., Li, B. H., Huang, B. Q., and Wang, J. L.: Globoro-talia truncatulinoides as indicator of upper-ocean thermal struc-ture during the Quaternary: evidence from the South China Sea and Okinawa Trough, Palaeogeogr. Palaeoclim. Palaeoecol., 162, 287–298, 2000b.
JODC Data On-line Service System, available at: http://www.jodc. go.jp/service.htm, last access: 16 November 2013.
Kao, S. J., Roberts, A. P., Hsu, S. C., Chang, Y. P., Lyons, W. B., and Chen, M. T.: Monsoon forcing, hydrodynamics of the Kuroshio Current, and tectonic effects on sedimentary carbon and sulfur cycling in the Okinawa Trough since 90 ka, Geophys. Res. Lett., 33, L05610, doi:10.1029/2005gl025154, 2006a.
Kao, S. J., Wu, C.-R., Hsin, Y.-C., and Dai, M.: Effects of sea level change on the upstream Kuroshio Current through the Okinawa Trough, Geophys. Res. Lett., 33, L16604, doi:10.11029/12006gl026822, 2006b.
Kawahata, H., Nohara, M., Aoki, K., Minoshima, K., and Gupta, L. P.: Biogenic and abiogenic sedimentation in the northern East China Sea in response to sea-level change during the Late Pleis-tocene, Glob. Planet. Change, 53, 108–121, 2006.
Lee, C.-S., Shor Jr, G. G., Bibee, L. D., Lu, R. S., and Hilde, T. W. C.: Okinawa Trough: Origin of a back-arc basin, Mar. Geo., 35, 219–241, 1980.
Lee, K. E., Lee, H. J., Park, J.-H., Chang, Y.-P., Ikehara, K., Itaki, T., and Kwon, H. K.: Stability of the Kuroshio path with respect to glacial sea level lowering, Geophys. Res. Lett., 40, 392–396, 2013.
Li, B. H., Jian, Z. M., and Wang, P. X.: Pulleniatina obliquilocu-lata as a paleoceanographic indicator in the southern Okinawa Trough during the last 20 000 years, Mar. Micropal., 32, 59–69, 1997.
Li, T., Liu, Z., Hall, M. A., Saito, Y., Berne, S., Cang, S., and Cheng, Z.: A broad deglacialδ13C minimum event in planktonic foraminiferal records in the Okinawa Trough, Chinese Sci. Bull., 47, 599–603, 2002.
Li, T. G., Liu, Z. X., Hall, M. A., Berne, S., Saito, Y., Cang, S. X., and Cheng, Z. B.: Heinrich event imprints in the Ok-inawa Trough: evidence from oxygen isotope and planktonic foraminifera, Palaeogeogr. Palaeoclim. Palaeoecol., 176, 133– 146, 2001.
Li, T. G., Sun, R. T., Zhang, D. Y., Liu, Z. X., Li, Q., and Jiang, B.: Evolution and variation of the Tsushima warm current during the late Quaternary: Evidence from planktonic foraminifera, oxygen and carbon isotopes, Sci. China Ser. D-Earth Sci., 50, 725–735, 2007.
Lie, H.-J. and Cho, C.-H.: Recent advances in understanding the cir-culation and hydrography of the East China Sea, Fish. Oceanogr., 11, 318–328, 2002.
Lie, H. J., Cho, C. H., Lee, J. H., and Lee, S.: Structure and eastward extension of the Changjiang River plume in the East China Sea, J. Geophys. Res. Oc., 108, 3077, doi:10.1029/2001JC001194, 2003.
Liu, Z. X., Li, T. G., Li, P. Y., Huang, Q. Y., Berne, S., Saito, Y., Cheng, Z. B., Wei, G. J., Liu, L. J., and Li, Z.: The paleoclimatic events and cause in the Okinawa Trough during 50 ka BP, Chi-nese Sci. Bull., 46, 153–157, 2001.
Machida, H.: The stratigraphy, chronology and distribution of distal marker-tephras in and around Japan, Glob. Planet. Change, 21, 71–94, 1999.
Martinson, D. G., Pisias, N. G., Hays, J. D., Imbrie, J., Moore, T. C., and Shackleton, N. J.: Age dating and the orbital theory of the ice ages: Development of a high-resolution 0 to 300 000-year chronostratigraphy, Quat. Res., 27, 1–29, 1987.
Morley, J. J., Heusser, L. E., and Shackleton, N. J.: Late Pleis-tocene/Holocene radiolarian and pollen records from sediments in the Sea of Okhotsk, Paleoceanography, 6, 121–131, 1991. Mulitza, S., Arz, H., Kemle-von Mücke, S., Moos, C., Niebler, H.
S., Pätzold, J., and Segl, M.: The South Atlantic Carbon Iso-tope Record of Planktic Foraminifera, in: Use of Proxies in Pa-leoceanography, edited by: Fischer, G. and Wefer, G., Springer Berlin Heidelberg, 427–445, 1999.
Mulitza, S., Donner, B., Fischer, G., Paul, A., Pätzold, J., Rüh-lemann, C., and Segl, M.: The South Atlantic Oxygen Isotope Record of Planktic Foraminifera, in: The South Atlantic in the Late Quaternary, edited by: Wefer, G., Mulitza, S., and Ratmeyer, V., Springer Berlin Heidelberg, 121–142, 2004.
Muller, P. J., Kirst, G., Ruhland, G., von Storch, I., and Rosell-Mele, A.: Calibration of the alkenone paleotemperature index UK37′based on core-tops from the eastern South Atlantic and the global ocean (60◦N–60◦S), Geochimica et Cosmochimica Acta, 62, 1757–1772, 1998.
Nagashima, K., Tada, R., Tani, A., Sun, Y., Isozaki, Y., Toyoda, S., and Hasegawa, H.: Millennial-scale oscillations of the westerly jet path during the last glacial period, J. As. Earth Sci., 40, 1214– 1220, 2011.
Nakanishi, T., Yamamoto, M., Irino, T., and Tada, R.: Distribution of glycerol dialkyl glycerol tetraethers, alkenones and polyunsat-urated fatty acids in suspended particulate organic matter in the East China Sea, J. Oceanogr., 68, 959–970, 2012.
Oba, T.: Paleoceanographic information obtained by the isotopic measurement of individual foraminiferal specimens, Proceed-ings of the First International Conference Asian Marine Geology, Shanghai, 1988, 169–180, 1988.
Peeters, F. J. C., Brummer, G.-J. A., and Ganssen, G.: The ef-fect of upwelling on the distribution and stable isotope composi-tion of Globigerina bulloides and Globigerinoides ruber (planktic foraminifera) in modern surface waters of the NW Arabian Sea, Glob. Planet. Change, 34, 269–291, 2002.
Pflaumann, U., Duprat, J., Pujol, C., and Labeyrie, L. D.: SIMMAX: A modern analog technique to deduce Atlantic sea surface tem-peratures from planktonic foraminifera in deep-sea sediments, Paleoceanography, 11, 15–35, 1996.
new transfer technique to estimate regional sea-surface tempera-tures, Mar. Geol., 156, 41–83, 1999.
Porter, S. C. and An, Z.: Correlation between climate events in the North Atlantic and China during the last glaciation, Nature, 375, 305–308, 1995.
Ravelo, A. C. and Fairbanks, R. G.: Oxygen Isotopic Composition of Multiple Species of Planktonic Foraminifera: Recorders of the Modern Photic Zone Temperature Gradient, Paleoceanography, 7, 815–831, 1992.
Ravelo, A. C., Fairbanks, R. G., and Philander, S. G. H.: Re-constructing tropical Atlantic hydrography using planktontic foraminifera and an ocean model, Paleoceanography, 5, 409– 431, 1990.
Reimer, P. J., Baillie, M. G. L., Bard, E., Bayliss, A., Beck, J. W., Blackwell, P. G., Ramsey, C. B., Buck, C. E., Burr, G. S., Ed-wards, R. L., Friedrich, M., Grootes, P. M., Guilderson, T. P., Hajdas, I., Heaton, T. J., Hogg, A. G., Hughen, K. A., Kaiser, K. F., Kromer, B., McCormac, F. G., Manning, S. W., Reimer, R. W., Richards, D. A., Southon, J. R., Talamo, S., Turney, C. S. M., van der Plicht, J., and Weyhenmeye, C. E.: Intcal09 and Ma-rine09 Radiocarbon age calibration curves, 0–50 000 years Cal BP, Radiocarbon, 51, 1111–1150, 2009.
Sawada, K. and Handa, N.: Variability of the path of the Kuroshio ocean current over the past 25 000 years, Nature, 392, 592–595, 1998.
Shieh, Y. T., Wang, C. H., Chen, M. P., and Yung, Y. L.: The Last Glacial Maximum to Holocene environment changes in the southern Okinawa Trough, J. As. Earth Sci., 15, 3–8, 1997. Sibuet, J. C., Letouzey, J., Barbier, F., Charvet, J., Foucher, J. P.,
Hilde, T. W. C., Kimura, M., Chiao, L.-Y., Marsset, B., Muller, C., and Stéphan, J. F.: Back Arc Extension in the Okinawa Trough, J. Geophys. Res. Sol. Earth, 92, 14041–14063, 1987. Stuiver, M. and Grootes, P. M.: GISP2 Oxygen Isotope Ratios, Quat.
Res., 53, 277–284, 2000.
Sun, X., Luo, Y., Huang, F., Tian, J., and Wang, P.: Deep-sea pollen from the South China Sea: Pleistocene indicators of East Asian monsoon, Mar. Geol., 201, 97–118, 2003.
Sun, Y. B., Oppo, D. W., Xiang, R., Liu, W. G., and Gao, S.: Last deglaciation in the Okinawa Trough: Subtropical northwest Pa-cific link to Northern Hemisphere and tropical climate, Paleo-ceanography, 20, PA4005, doi:10.1029/2004pa001061, 2005. Tanaka, Y.: Coccolith fluxes and species assemblages at the shelf
edge and in the Okinawa Trough of the East China Sea, Deep-Sea Res. Pt. II, 50, 503–511, 2003.
Thompson, P. R.: Planktonic foraminifera in the Western North Pacific during the past 150 000 years: Comparison of mod-ern and fossil assemblages, Palaeogeography, Palaeoclimatology, Palaeoecology, 35, 241–279, 1981.
Thunell, R. C., Curry, W. B., and Honjo, S.: Seasonal variation in the flux of planktonic foraminifera: time series sediment trap re-sults from the Panama Basin, Earth Planet. Sci. Lett., 64, 44–55, 1983.
Ujiié, H. and Ujiié, Y.: Late Quaternary course changes of the Kuroshio Current in the Ryukyu Arc region, northwestern Pa-cific Ocean, Mar. Micropal., 37, 23–40, 1999.
Ujiie, Y. and Ujiie, H.: Distribution and oceanographic relation-ships of modern planktonic foraminifera in the Ryukyu arc re-gion, northwest Pacific Ocean, J. Foramin. Res., 30, 336–360, 2000.
Wang, P. X., Zhang, J. J., and Zhao, Q. H.: Foraminifera and Os-tracoda in sediments in the East China Sea, China Ocean Press, Beijing 1988 (in Chinese).
Wang, Y., Cheng, H., Edwards, R. L., An, Z., Wu, J., Shen, C.-C., and Dorale, J. A.: A High-Resolution Absolute-Dated Late Pleistocene Monsoon Record from Hulu Cave, China, Science, 294, 2345–2348, 2001.
Wang, Y., Cheng, H., Edwards, R. L., Kong, X., Shao, X., Chen, S., Wu, J., Jiang, X., Wang, X., and An, Z.: Millennial- and orbital-scale changes in the East Asian monsoon over the past 224 000 years, Nature, 451, 1090–1093, 2008.
Wu, Y., Cheng, Z., and Shi, X.: Stratigraphic and carbonate sedi-ment characteristics of Core CSH1 from the northern Okinawa Trough, Adv. Marine Science, 22, 163–169, 2004 (in Chinese with English Abstract).
Xiang, R., Sun, Y. B., Li, T. G., Oppo, D. W., Chen, M. H., and Zheng, F.: Paleoenvironmental change in the middle Oki-nawa Trough since the last deglaciation: Evidence from the sedi-mentation rate and planktonic foraminiferal record, Palaeogeogr. Palaeoclim. Palaeoecol., 243, 378–393, 2007.
Xing, L., Zhao, M., Zhang, H., Liu, Y., and Shi, X.: Biomarker reconstruction of phytoplankton productivity and community structure changes in the middle Okinawa Trough during the last 15 ka, Chinese Sci. Bull., 53, 2552–2559, 2008.
Xu, X. D. and Oda, M.: Surface-water evolution of the eastern East China Sea during the last 36 000 years, Mar. Geol., 156, 285– 304, 1999.
Yu, H., Liu, Z. X., Berne, S., Jia, G. D., Xiong, Y. Q., Dickens, G. R., Wei, G. J., Shi, X. F., Liu, J. P., and Chen, F. J.: Variations in temperature and salinity of the surface water above the mid-dle Okinawa Trough during the past 37 kyr, Palaeogeogr. Palaeo-clim. Palaeoecol., 281, 154–164, 2009.
Yuan, D., Cheng, H., Edwards, R. L., Dykoski, C. A., Kelly, M. J., Zhang, M., Qing, J., Lin, Y., Wang, Y., Wu, J., Dorale, J. A., An, Z., and Cai, Y.: Timing, Duration, and Transitions of the Last Interglacial Asian Monsoon, Science, 304, 575–578, 2004. Zhang, J., Letolle, R., Martin, J. M., Jusserand, C., and Mouchel, J.
M.: Stable oxygen isotope distribution in the Huanghe (Yellow River) and the Changjiang (Yangtze River) estuarine systems, Contin. Shelf Res., 10, 369–384, 1990.