Abstract— Coaxial aircells are designed and fabricated to measure the electromagnetic
properties of ferrite materials in the frequency range from 1 MHz to 3.6 GHz. These
S-parameters are actually measured connecting the aircell to a vector network analyzer (VNA).
The electromagnetic properties such as complex permittivity and complex permeability are
extracted using Nicolson-Ross-Weir (NRW) method and also suitable air-gap corrections are
made. To optimize the measured result and to estimate the error, the aircells are characterized
in terms of their phase constant and resistivity of the aircell conductor. The measurements
clearly showed that the electrical length is longer than the mechanical length of the aircell at all
frequencies. The arithmetic mean of the resistivity of aircell which is of 7mm line size and 60mm length is about 66 nΩm. This paper presents a simple method by which the phase constant and resistivity of the aircell can be determined accurately. This is done with the transmission
measurements made using a VNA.
Index Terms—Coaxial aircell, S-parameters, Complex permittivity, Complex
permeability.
I. INTRODUCTION
The measurement of complex permeability (
µ
∗= µ
′− iµ
′′) and complex permittivity(
ε
∗= ε
′− iε
′′) of materials at high-frequency is used in microwave communication devices,electromagnetic interference (EMI) shielding, electromagnetic compatibility (EMC), field sensors,
microwave heating and magnetic recording etc.
A number of methods have been developed for measuring permittivity and permeability.
These techniques include free-space methods [1-3], waveguide techniques [4, 5], open-ended
coaxial-probe techniques [6, 7], cavity resonators [8], and dielectric-resonator techniques [9]. Each method
has its range of applicability and its inherent limitations. For instance, however cavity based
techniques are precise, yet not broadband, are typically restricted to low-loss materials. The
waveguide methods do not experience the radiation loss like free-space methods and at the same time
give accurate results. However, each waveguide operates at the limited frequency band. Coaxial line
method gives accurate results and allows measurement in a wider frequency range [10-12].
Coaxial air dielectric transmission lines can be very useful as references, or standards, for
high-precision impedance measurement at RF and microwave frequencies [13-15]. These aircells do
not contain dielectric support that are usually used to hold the center conductor of the aircell coaxially
Design of coaxial aircell fixture for the
measurement of electromagnetic properties
V. Seetha Rama Rajuinside the outer conductor. The absence of dielectric support medium, along with the use of high-conducting materials for the aircell’s conductors, air as the dielectric and high precision connectors at both ends of the line, means that such lines exhibit near ideal properties, and exhibit very low
insertion loss.
A measurement utilizing the transmission / reflection (TR) technique continues by setting a
specimen in an area of coaxial aircell and measuring the two-port complex S-parameters, ideally by a
vector network analyzer (VNA). The scattering equations relate the measured scattering parameters to
the permittivity and permeability of the material. However, for these aircells to be used for such
applications, they must be characterized accurately in terms of their propagation characteristics and
impedance. This includes the understanding of a small amount of loss in the aircell and the associated
impact of this loss on other characteristics. A simple to-execute test technique has been exhibited in
this paper for the determination of the resistivity of the aircells conductor including VNA estimations
of the S-parameters of the aircell.
II. EXPERIMENTAL METHOD
A. Sample holder
A coaxial aircell consists of a hollow cylindrical transmission line. The inner walls have a smooth
contour and acts as the sample holder. Both outer ends are threaded to secure the connectors to both
test ports on a Network Analyzer. A center conductor runs through the center of the hollow cylinder
and provides the connection, and is secured in place by the threaded cables on both the sides.
Fig. 1(a). Photograph of the coaxial
aircell.
Figures 1 (a) and 1 (b) show the photograph and the structure of the coaxial aircell sample holder
college workshop with machine position accuracy of 6 µ m. The sample holder and the VNA are
connected though male to male N type connectors with standard 7 mm coaxial cables. The cell is
made of Brass and its dimensions are adapted to match the precise N connectors used. All these
components had a 50 ohm characteristic impedance to prevent mismatch.
Fig. 1(b). Structure of the coaxial aircell.
B. Measurement setup
In this work measurement of S-parameters are made using Rohde & Schwarz ZVH 4 Cable
and Antenna analyzer / Network analyzer. Full two-port calibration was initially performed on the test
setup in order to remove errors due to the directivity, source match, load match, isolation and
frequency response in both the forward and reverse measurements. The R&S ZVH analyzer uses ZVH
29 standard kit for short, open, load and through calibration at each port. The calibration also
establishes the reference planes for the measurement test ports. Before we proceed for the
measurement of the ferrite samples, the fabricated coaxial aircells without samples are characterized
for phase constant and resistivity.
C. Test samples
The ferrite samples (Mg0.2Cu0.3Zn0.5 Fe2O4, Ni0.53Cu0.12Zn0.35 Fe2O4 and Co0.4Zn0.6Fe2O4) are
finally pressed into the toroidal-shaped samples of 7.00 mm outer diameter and 3.04 mm inner
diameter with the height of 4.0 mm. The scattering parameters of the toroidal samples that correspond
to the reflection (S11 and S22) and transmission (S21 and S12) are measured by the vector network
analyzer using a coaxial transmission / reflection method in the frequency range of 1 MHz to 3.6
GHz. The toroids tightly fit into the coaxial measurement cell.
D. Phase constant and Resistivity measurement
The aircell of length L connected between the two ports of reference plane will have a phase
change of the signal to travel between two ports. The electrical length of the line may therefore be
calculated from the measured phase using the equation
L = � −�
� (1)
where is called phase constant, θ is the phase (in radians) measured by the VNA and n is an
integer (n= 0, 1, β,…) used to take account of the number of complete wavelengths that the length of
aircell contains at a given frequency. The value of ‘n’ is determined from knowledge of the length of
physical length (obtained from a precision mechanical measurement). If the two length determinations
(mechanical and electrical) agree to within the expected uncertainty, then the VNA phase
measurement is verified as being of an acceptable accuracy (again, to within the expected uncertainty
of measurement).
In practice, the aircells are not lossless, they exhibit a small amount of loss owing to the finite
conductivity (or non-zero resistivity) of the metals used to fabricate the aircell’s conductors. The
attenuation constant � is related to a transmission coefficient (say S21) of a length L, of perfectly
matched line (i.e. |S11| = |S22| = 0), by
� = − ���|� | (2)
the resistivity ρ of a line is related to � as follows [16]:
ρ = [ α
+ / ]
π
µ f (3)
where a and b are the radii of the aircell centre and outer conductors respectively
From equations (2) and (3), it is clear that, at any given frequency, ρ can be determined from the
measurement of S21.
E. Extraction of electromagnetic properties from S-parameters
The complex permeability (µ∗) and permittivity (ε∗) of the ferrite samples are determined
from the scattering parameters using the NRW models using the following equations [17, 18].
µ∗= +Γ
Λ −Γ√ −
c
(4)
Where Γ is reflection coefficient, is the free space wavelength and is the cutoff wavelength and
Λ = - ( πLln T ) (5)
The permittivity can be defined as
ε∗=
r( c− [ πLln T ] ) (6)
Equation (12) and (13) have an infinite number of roots since the imaginary part of the term ln
T is
equal to i(� + ��) where n = 0, ± , ± …, the integer of (�
��). The ‘n’ can be determined by
finding � wavelength in sample.
F. Airgap correction:
Air-gaps are created if the machined sample does not fit the sample holder’s cross-section and
make close contact with the cavity walls [19]. As with the parallel-plate capacitor, ideal experimental
accuracies of 5% can be achieved, but air-gaps and fixture problems can decrease the accuracy to 15%
uncertainty. There are two types of air-gap correction; coaxial and waveguide gap correction. The
respective correction is applied once the permittivity data has been obtained after data conversion.
Coaxial gap correction calculation can be determined by first describing the dimension of the sample and coaxial holder into three terms [21]:
� = ln �
� + ln �
� (7)
� = ln �
� (8)
� = ln �
� (9)
Where � is the diameter of the inner conductor in the aircell, � is the inner diameter of the toroidal
sample, � is the outer diameter of the sample, and � is the diameter of the coaxial aircell itself (see
Figure 2).
Fig. 2. Coaxial sample in holder with air gaps.
With these terms, the corrected real and imaginary part of the permittivity can be determined as
��′ = �′ � −� �� �′ (10)
��′′ = ��′× �� ′′ ��′
�
� −� ��′ +[�� ′′ ��′ ]
(11)
Where ��= corrected permittivity values and � = measured permittivity values
With the same terms, the corrected real and imaginary part of the permeability is described as
�
′ = ′ � −�
� (12)
�
′′ = ′′ �
� (13)
Where �= corrected permeability values and = measured permeability values
III. RESULT AND DISCUSSION
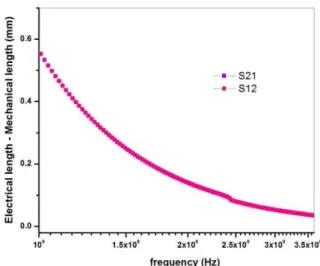
The difference between the mechanical length and electrical length of the coaxial aircell is
shown in figure 3. It is clear from the figure that, if the line is assumed to be lossless, the electrical
length is longer than the mechanical length of the aircell at all frequencies. The electrical length also
varies as a function of frequency (owing to the dispersion in the aircell not being taken into account).
However, when the loss is taken into account, the electrical length of the aircell shows better
the resistivity of the aircell before it can be used as a reference artefact for verifying VNA phase
measurements.
Fig. 3. Difference between mechanical and electrical length of the coaxial aircell.
Fig. 4. Resistivity versus frequency of the aircell conductor.
Figure 4 shows the resistivity determinations for these lines plotted as a function of frequency.
The arithmetic mean of the resistivity of aircell of 7mm line size of length of 60 mm is about 66 nΩm.
These results show good agreement with the earlier determinations of resistivity [16], and so this
provides some degree of validation for the technique presented in this paper. Any deviation in the
values of resistivity depends on the composition of the aircell conductor.
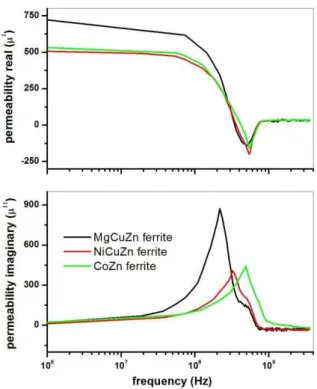
The complex permeability spectra of the ferrite samples obtained from NRW method is
shown in figure 5. The value of the real part of permeability ′ for present ferrites is more than 500 in
the frequency range of 1 MHz to 50 MHz. Then the values of permeability are found to decrease with
The loss component ′′ rises to a pronounced peak as ′falls. This is the resonance type of
permeability dispersion. The resonance/relaxation frequency fr, at which ′′, has a maximum value, is
above 200 MHz for all ferrites.
Fig. 5. Complex permeability spectra of ferrites.
It is known that the complex permeability is composed of two different magnetization
mechanisms and those are the spin rotational magnetization and the domain wall motion. The first one
is a relaxation type factor and its dispersion is inversely proportional to frequency. Otherwise, the
domain wall contribution is of resonance type and depends on the square of the frequency [22].
Usually, there is a relevant interplay between the resonance due to the domain wall motion and
relaxation due to the spin rotation. Domain wall resonance is usually observed at lower frequency
while the spin rotational relaxation is observed in MHz frequency range.
The high frequency permeability of spinel ferrite is governed by Snoek's law as ( s-1) fr =
/3π Ms where, s is the static permeability, fr is the resonance frequency, Ms is the saturation
magnetization and is the gyromagnetic ratio [23]. It follows from the equation that a change in s
due to variations in material microstructure is followed by an opposite change in fr.
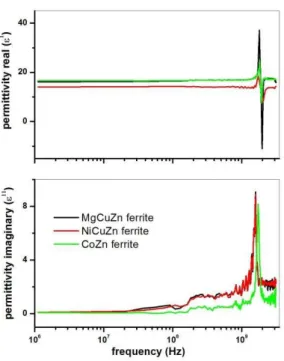
The complex permittivity spectra of the ferrite samples obtained from NRW method is shown
in figure 6. The complex permittivity of any material, in general, is due to dipolar, electronic, ionic,
and interfacial polarizations. At low frequencies, dipolar and interfacial polarizations are known to
play the most important role [24]. Moreover, the polarization in ferrites is through a mechanism
displacement of electrons in the directions of the electric field and these electrons determine the
polarization.
Fig. 6. Complex permittivity spectra of ferrites.
In ferrites, it is well known that the samples consist of well-conducting grains separated by
poorly conducting grain boundaries. The electrons reach the grain boundary through hopping and if
the resistance of the grain boundary is high enough, electrons pile up at the grain boundaries and
produce polarization. Koops explained this by considering the heterogeneous structure of
polycrystalline ferrites as equivalent to a series parallel combination of resistors and capacitors [26].
However, as the frequency of the applied field increases, the electrons reverse their direction of
motion more often. This decreases the probability of electrons reaching the grain boundary and as a
result the polarization decreases.
Therefore, the dielectric constant decreases with increasing frequency of the applied field.
Ultimately, as the field frequency increases, the dipoles will barely have started to move before the
field reverses, and try to move the other way. At this stage, the field is producing virtually no
polarization of the dielectric. This process is generally called relaxation and the frequency beyond
which the polarization no longer follows the field. Relaxation arises from the inertia of the system of
charges and restoring force acting on the charges which oppose the force due to the applied electric
field. Thus, these systems combine inertia and restoring force, whereby resonance is possible rather
than relaxation.
The dielectric losses in ferrites are generally reflected in the resistivity, materials with low
permeability can be explained on the basis of Koop’s model [26]. The resonance peak around 1 GHz can be explained as when the hopping frequency of electrons is equal to the applied field frequency,
maximum electrical energy is transferred to the oscillating ions and power loss shoots up, thereby
resulting in resonance. The measured results of complex permeability and complex permittivity in this
work are in good agreement with the published reports measured with impedance analyzers [27-29].
IV. Conclusions
A new coaxial aircell sample holder has been designed and fabricated to measure the
S-parameters in transmission / reflection methods. The aircell is characterized for phase constant and
resistivity for optimization of result using a simple method discussed in this paper. The complex
permeability and complex permittivity of the ferrite materials are extracted from measured
S-parameters in the frequency range of 1 MHz to 3.6 GHz using NRW method.
Acknowledgements
The author is very much thankful to Dr. K. S. Nayanatara for making VNA available for
measurements. I would like to thank M. Srinivas Reddy, Y. Srinivas Goud and K. Venkat Reddy for
their help in machining the aircell. I also would like to thank Dr. C. V. Raghava (Chairman, CVR
College of engineering) and Dr. C. Madhusudana Reddy (Advisor) for their encouragement.
References
[1] D. K. Ghodgaonkar V. V. Varadan, V. K. Varadan, “A free-space method for measurement of
dielectric constants and loss tangents at microwave frequencies,” IEEE Trans. Instrum. Meas., vol. 38,
pp. 789-793, 1989.
[2] P. Skocik, P. Neumann, “Measurement of Complex Permittivity in Free Space,” Procedia Eng.,
vol. 100, pp. 100-104, 2015.
[3] F. C. Smith, B. Chambers, and J. C. Benett, “Methodology for accurate free-space characterization
of radar absorbing materials,” Proc. Inst. Elect. Eng. Sci. Meas. Technol., vol. 141, pp. 538-546, 1994.
[4] M. J. Akhtar , L. Feher, M. Thumm, “Measurement of dielectric constant and loss tangent of
epoxy resins using a waveguide approach,” in Proc. IEEE Antennas Propag. Soc. Int. Symp., vol. 1,
pp. 3179 – 3182, 2006.
[5] H. Soleimania, Z. Abbasb, N. Yahyaa, H. Soleimanib, M. Yeganeh Ghotbic, “Determination of
complex permittivity and permeability of lanthanum iron garnet filled PVDF-polymer composite
using rectangular waveguide and Nicholson–Ross–Weir (NRW) method at X-band frequencies,”
Measurement., vol. 45, pp. 1621-1625, 2012.
[6] B. Filali, F. Boone, J. Rhazi, G. Ballivy, “Design and Calibration of a Large Open-Ended Coaxial
Probe for the Measurement of the Dielectric Properties of Concrete,” IEEE Trans. Microw. Theory
[7] D. M. Hagl, D. Popovic, S. C. Hagness, J. H. Booske, M. Okoniewski, “Sensing Volume of
Open-Ended Coaxial Probes for Dielectric Characterization of Breast Tissue at Microwave
Frequencies,” IEEE Trans. Microw. Theory Tech., vol. 51, pp. 1194-1206, 2003.
[8] J. Sheen, “Microwave Measurements of Dielectric Properties Using a Closed Cylindrical Cavity
Dielectric Resonator,” IEEE Trans. Dielectr. Electr. Insul., vol. 14, pp. 1139-1144, 2007.
[9]J. Krupka, A. P. Gregory, O. C. Rochard, R. N. Clarke, B. Riddle, J. B. Jarvis, “Uncertainty of
complex permittivity measurements by split-post dielectric resonator technique,” J. Eur. Ceram. Soc.,
vol. 21, pp. 2673-2676, 2001.
[10] V. Shemelin, N. Valles, “Improved accuracy of measurements of complex permittivity and
permeability using transmission lines,” Nucl. Instr. Meth. Phys. Res. A., vol. 767, pp. 385-396, 2014.
[11] J. B. Jarvis, R. Geyer, P. Domich, “Improvements in transmission line permittivity and
permeability measurements,” in Precision Electromagnetic Measurements (CPEM) Conf. on Jun
1990, pp. 232-233.
[12]J. Xu, M. Y. Koledintseva, Y. Zhang, Y. He, B. Matlin, R. E. DuBroff, J. L. Drewniak, J. Zhang, “Complex Permittivity and Permeability Measurements and Finite-Difference Time-Domain Simulation of Ferrite Materials,” IEEE Trans. Electromagn. Compat., vol. 52, pp. 878-887, 2010.
[13] B. O. Weinschel, “Air-filled coaxial lines as absolute impedance standards,” Microw. J., vol. 7,
pp. 47-50, 1964.
[14] I. A. Harris, R. E. Spinney, “The realization of high-frequency impedance standards using air
spaced coaxial lines,” IEEE Trans. Instrum. Meas., vol. 13, pp. 265-272, 1964.
[15] K. H. Wong, “Using precision coaxial air dielectric transmission lines as calibration and
verification standards,” Microw. J., vol. 31, pp. 83-92, 1998.
[16] G. J. Kilby, N. M. Ridler, “Comparison of theoretical and measured values for attenuation of
precision coaxial lines,” Electron. Lett., vol. 28, pp. 1992-1994, 1992.
[17] A. M. Nicolson and G. F. Ross, “Measurement of the intrinsic properties of materials by
time-domain techniques,” IEEE Trans. Instrum. Meas. vol. 19, pp. 377-382, 1970.
[18] W. B. Weir, “Automatic measurement of complex dielectric constant and permeability at
microwave frequencies,” Proc. IEEE., vol. 62, pp. 33-36, 1974.
[19] J. Baker-Jarvis, C. Jones, B. Riddle, M. Janezic, R. Geyer, J. Grosvenor and C. Weil, “Dielectric
and magnetic measurements: A survey of nondestructive, quasinondestructive, and process- control
techniques,” Research in Nondestructive Evaluation, vol. 7, pp. 117-136, 1995.
[β0] J. Krupka, A. Abramowicz, “Measurements of Electromagnetic Properties of Materials at Microwave Frequencies,” XXXII International Conference of IMAPS - CPMT IEEE Poland Pułtusk
21 - 24 September 2008.
[21] J. Baker-Jarvis, “Transmission/Refection and Short-Circuit Line Permittivity Measurements,”
[22] C.A. Stergioun , V. Zaspalis, “Analysis of the complex permeability of NiCuZn ferrites up to 1 GHz with regard to Cu content and sintering temperature,” Ceram. Int., vol. 40, pp, γ57–366, 2014. [23] T. Nakamura, “Snoek’s limit in high-frequency permeability of polycrystalline Ni–Zn, Mg–Zn,
and Ni–Zn–Cu spinel ferrites,” J. Appl. Phys., vol. 88, pp. 348-354, 2000.
[24] S. Zaima, T. Furuta, and Y. Yasuda, “ Conduction mechanism of leakage current in Ta2O5 films
on Si prepared by LPCVD,” J. Electrochem. Soc., vol. 1γ7, pp. β876-2882, 1990.
[25] V. Seetha Rama Raju, “Effect of Ta2O5 addition on the electrical and magnetic properties of
nanocrystalline MgCuZn ferrites,” J. Mater. Res., vol. 29, pp. 2220-2228, 2014.
[26] C. G. Koops, “On the Dispersion of Resistivity and Dielectric Constant of Some Semiconductors at Audio frequencies,” Phys. Rev. Lett., vol. 83, pp. 121-124, 1951.
[27] V. Seetha Rama Raju, “Complex permeability spectra of PbO and Ta2O5 added nanocrystalline
MgCuZn ferrites,” J. Magn. Magn. Mater., vol. 382, pp. 84-87, 2015.
[28] T. Krishnaveni, B. Rajini Kanth, V. Seetha Rama Raju, S. R. Murthy, “Fabrication of multilayer
chip inductors using Ni–Cu–Zn ferrites,” J. Alloys Compd., vol. 414, pp. 282-286, 2006.
[29] T. Slatineanua, A. R. Iordana, V. Oanceaa, M. N. Palamarua, I. Dumitrub, C. P. Constantinb, O.
F. Caltun, “Magnetic and dielectric properties of Co–Zn ferrite,” Mater. Sci. Eng. B., vol. 178, pp.