Introduction
The behavior of laboratory animals has been studied by means of experimental models with different objectives1. Different methods have been used for the analysis of displacement, such as an ultrasonic activity monitor2, electronic device3, calculation of the position of the center of gravity on the ground4, and infrared detection5. However, these methods present limitations to analyze the behavior of animals in a group, or interacting with each other. They can track only one animal at a time. Besides that, these methods require a simple background (in terms of their gray scale values) and can deal only a limited range of experimental setups7,
making tracking in the dark dificult. On the other hand, analysis by videogrammetry in manual tracking mode allows the recording of several animals in a cage or enriched environment to analyze the behavior of animals in a group through the individual analysis of the animals and it enables the tracking during the dark cycle.
Initially employed to analyze human movement6, the use of videogrammetry for the analysis of displacement continued to be used in experimental animal models7. Although, in human studies, acceleration, speed, and the analysis of angles of body segments are important parameters for some areas of knowledge. In experiments with animals, the displacement is an important
parameter in the study of behavior. Classiied as spontaneous physical activity, locomotor behavior is a key element in the daily lives of animals, required for survival and homeostasis8. In recent decades, the development of analytical methods to analyze displacement by videogrammetry has been used in studies with different objectives: to understand the effects of psychostimulants9, different environments10, food restriction11, different conditions of housing12, and drugs13.
Although automated videogrammetry is an effective method for the analysis of displacement, this technological progress requires high cost equipment. On the other hand, the manual tracking mode of displacement analysis of animals is also a good option, since it uses the same method (videogrammetry), but with much lower investment than the automatic method. The semi-automatic method has been used in studies requiring high precision, such as angular kinematics of movement14 and measures of distance and velocity in sport15,16, showing various possibilities of application for analysis in three dimensions (3D), using at least two cameras. In experimental models with rats, displacement analysis can be performed in two dimensions (2D), with only one camera, since it is possible to position the camera above the cage or environment in which the animals are located and obtain images for analysis of the displacement of
Original article (short paper)
Accuracy and reliability of a videogrammetry
system in the analysis of displacement of Wistar rats
Osvaldo Tadeu da Silva Junior
Universidade Estadual Paulista “Júlio de Mesquita Filho”, Rio Claro, SP, Brazil
Paulo Roberto Santiago
Universidade de São Paulo, Ribeirão Preto, SP, Brazil
Jose Alexandre Almeida Leme Curiacos
Centro Universitário Católico Salesiano Auxilium, Lins, SP, Brazil
Julio Wilson dos Santos
Universidade Estadual Paulista “ Julio de Mesquita Filho”, Bauru, SP, Brazil
Abstract — Aims: The behavior of laboratory animals has been studied through displacement, with different objectives by researchers. Methods: Although different methods have already been used in the tracking of laboratory animals, manual tracking mode videogrammetry for 2D analysis of displacement has not been observed in animal studies. The aim of this study was to verify the accuracy and reliability of determining the displacement of Wistar rats by means of videogrammetry software Dvideo. The accuracy (between the known distance and distance traced) was determined by 3 different evaluators twice consecutive, by videoing a course of 10 meters in the enriched environment together with further analysis of the displacement of the midpoint marked on an apparatus. To calculate reliability (accuracy of the measurement system) and reproducibility (precision of the evaluators) to obtain the ratio of precision to tolerance (P/T), eight animals were ilmed for 10 minutes in the enriched environment and analysis of distance covered by one of the animals by three different reviewers thrice consecutive. Results: The results obtained in the course of 10 meters of the known distance demonstrated accuracy of 0.10 m, precision of 0.05 m, and bias of 0.07 m. In the reliability test during the 10 minutes of displacement (m) of animal, the ratio of precision to tolerance (P/T) = 0.1 m was found between three different evaluators, demonstrating adequate capacity of the measure. Conclusion: The manual tracking mode of the Dvideo presented high reliability and it can be employed for the displacement analysis of studies with rat experimental models.
the animals during the spontaneous physical activity. However, the accuracy and reliability of the manual tracking mode method of video analysis, using 2D videogrammetry for analysis of displacement, have not been veriied in animal studies.
Accuracy is widely used to indicate the quality of an observed size or estimated parameter, deined as the degree of proximity of an estimate with the parameter, true value18. Therefore, the analysis of the measurement system is a fundamental component to guarantee the reliability of the results that it produces. As an option, it is possible to plan studies of the capacity of a measur-ing system to investigate two measurement error components, through the reliability and reproducibility parameters (R&R)19. Thus, R&R is a tool used for the analysis of the variability as-sociated with the contribution of instrumentation, environmental conditions, and evaluators, in a particular measurement process. To our knowledge, none of the displacement analysis systems used in the experimental model with rats presented a measure of accuracy and reliability.
Reliability of measurement results is directly linked to knowledge and control of the characteristics of the measuring system. In this way, verifying the accuracy and reliability of videogrammetry for the measurement of displacement in the animal experimental model is primordial. The aim of this study was to verify the accuracy and reliability of the determination of the distance of Wistar rats using manual tracking mode.
Materials and methods
Animals
Wistar rats (RattusNorvegicus Albinus Wistar), of 120 days of age from the Vivarium of the São Paulo State University (UNESP)
Botucatu campus, were used in this study. The animals were al-located to a cage (enriched environment) measuring 128 x 58 x 45 cm (8 animals/environment) in the vivarium of the Unisalesiano University Center, Lins Campus. The enriched environment com -prised a group of animals and inanimate objects (racing wheel, tunnel, bridges, balls, and others) that facilitated sensory, motor, and social cognitive stimulation20. The temperature (25 ± 1°C) and luminosity (light/dark cycle 12/12 h) of the vivarium were tracked and the animals had free access to water and food. The procedures of this study were in accordance with the guidelines stated by the Ethical Principles in National Council for Animal Experimentation and control (CONSEA) and approved by the Commission of eth -ics in the use of Animals-CEUA-UNISALESIANO (Protocol no. 09/2015, in 8/27/2015). Our research procedures were carried out strictly in accordance with these approved guidelines.
Acquisition of the images to calculate the accuracy
An IP Camera 1.3 MP Infrastructure 30M (1280 x 720) was ixed in the center top of the enriched environment one meter above the cage by means of a metal bracket attached to the ceiling. The recording was managed by Capture Software (Citrox), set to a frequency of 60 Hz acquisition (image reso-lution of 720 x 480).
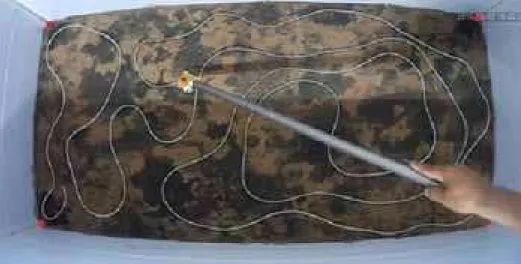
Accuracy determination was performed in the same en-riched environment space without the inanimate objects. A 10 meters line of continuous nylon was distributed randomly in the background. An apparatus containing a wooden rod with a mini fabric bag (4 x 6 cm) at its end, marked with a red dot of 0.5 cm in RADIUS, as a reference to the center of mass, was used for the ilming of an appraiser walking the path of 10 m ( Figure 1).
Figure 1. Enriched environment, with the nylon line of 10 meters distributed randomly in the background, markings of the extremities (calibration
points in red) and the rod with the mini-bag marked with the midpoint.
After the acquisition of the video of the 10 meters route and calibration process that took as a reference the four points marked in the corners of the box of the enriched environment, whose actual distances had been previously measured, the “X” axis represented the length of the enriched environment,
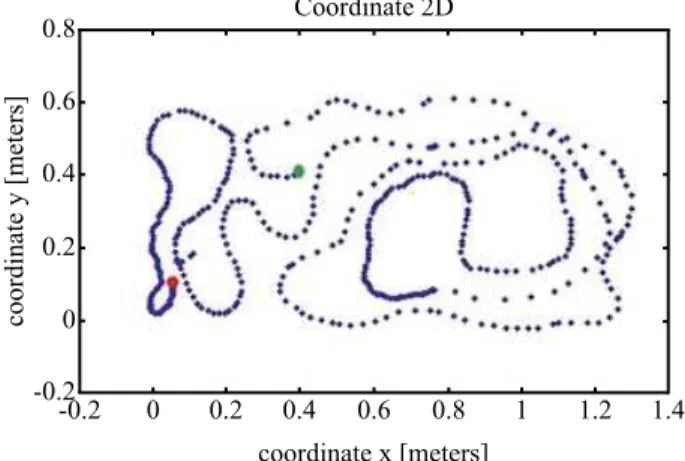
of the rod around the markings in the environment background and, from this information, the displacement of the midpoint was calculated to obtain the total distance (m) (Figure 2), in a speciic routine developed in Matlab® software 2014a (Match Works Inc, Massachusetts, United States).
(1) R = 1
3(R1 + R2 + R3) 0.8
coordinate x [meters] 0.4
0.6 0.6
coordinate y [meters]
0.2
1.4 0.4
-0.2 0
-0.2 0.2
0
0.8 1
Coordinate 2D
1.2
Figure 2. Image of the 10 meters route from the X, Y coordinates in 2D, obtained by one of the three evaluators. Green dot = beginning of
the trace; red dot = end of the trace.
Accuracy test
The total distance of the displacement by the rod was traced, and the accuracy (Equation 1), bias (systematic error-equation 2) and precision (Equation 3) measured from the calculation of the distance obtained through the experimental formulas presented below:
(1) a2 = b2 + p2
of the “X” and “Y” coordinates were performed as described above, for the test of accuracy. As in the test of accuracy, a red point was marked as a reference on the animal, to standardize the trace. The result of the tracking of one animal by one of the evaluators is presented in Figure 3.
0.4
0.6 0
-0.1 0 0.1
0.4 0.2
0.2 0.8 1.4
Coordinate 2D 0.6
coordinate y [meters]
0.5
cordinate x [meters] 0.3
1.2 1
Figure 3.Image of the tracing of one rat in the enriched environment during the 10 minutes screening. Green dot = beginning of the trace;
red dot = end of the trace.
Reliability and reproducibility
The reliability and reproducibility by videogrammetry in manual tracking mode of the Dvideo were calculated as proposed by method (R&R)19. Thus, the reproducibility refers to the variability of the averages of the measurements obtained by different evalu-ators (either in different time periods, different environments, or under different conditions) when performing repeated times with the same measuring instrument. From the R&R it is possible to obtain the components of the standard deviation of the measure-ment error (σ _ meter) and calculate the precision to tolerance ratio (P/T), where a measurement system needs to be able to measure accurately enough to interpret the correct measure between the evaluators. P/T values equal or less than 0.1 indicate adequate capacity of the measure. The trace data were obtained from rat displacement for determining the following parameters:
σ2
measurement error = σ2
measurer (equation 3) =
σ2
repeatability (equation 1) + σ2
reliability (equation 2) and the 6σmeasurer ratio (total tolerance range of precision-equation 4) with the following:
σ2
measurement error = σ2
meter = σ2
repeatability + σ2
reproducibility
(3) p =
(
Ν−11)
Σ
(
)
i=1n mi-m
2
R d2 σrepeatability = ^
(2)
x
máx=máx
(x ,x ,x 1 2 3)x
mín=mín
(
x ,x ,x
1 2 3)
x
R
=MÁX
X
-X
MÍNx
R
=
σ
reproducibility
d
2^
(2) b=
Σ
i=1
n 1 N µ- mi
where: a = accuracy; b = bias; p = precision; µ = actual value; mi= (i = 1, ..., N) = observed value of the measure obtained experimentally; m = average value of N measures; N = number of repetitions of the experiment.
Calculation of Displacement
(3) σ^2measurer = σ^2repeatability + σ^2reproducibility
Table 1 - Values obtained by the evaluators from distance of 10 meters
Evaluator
Measurements (m)
Mean Standard deviation
1° 2°
1 9,77 9,77 9,77 0,005
2 9,67 9,60 9,64 0,053
3 9,81 9,82 9,81 0,007
Individual results as well as the mean and standard deviation to the measurements obtained by the evaluators during the 10 minute of the rat displacement are shown in Table 2. According to the results observed, the difference between the maximum and minimum values between the evaluators is very small, resulting in the coeficient of variation (CV = 0,06).
Table 2 - Values obtained by the evaluators during the 10 minute of the displacement rat.
Evaluator
Measurements (m)
Mean Standard deviation
1° 2° 3°
1 13,42 13,42 13,24 13,36 0,10
2 13,45 13,27 13,38 13,37 0,08
3 13,42 13,24 13,34 13,33 0,08
0.4
1.2 0.1
0.6
0.6 0.3
Coordinate x [meters] 0.2
0.8 0
0.4 0.2 -0.1
1.4 1
0.5
0
Coordinate y [meters]
Coordinate 2D
Figure 4.Image of the tracing of one rat in the enriched environment during the 10 minutes of the tracking. Red = evaluator n°1; green = evalu-ator n°2 and blue = evaluator n° 3.
(4) P
T = 6LSE - LIEσmeasurer ^
where: R = Average of the three average amplitudes of the evalu-ators, R1 = Mean amplitude of measures 1 and 2 of evaluator n° 1; R2 = Mean amplitude of measures 1 and 2 of evaluator n° 2; R3 = Mean amplitude of measures 1 and 2 of evaluator n° 3; d2 = Factor for size 2 samples (1,693), x1 = Mean of the average
value of the measures of the evaluator n° 1, x2 = Mean of the average
value of the measures of the evaluator n° 2, x3 = Mean of the average
value of the measures of the evaluator n° 3,σmeter = Amplitude of a sample of 3 sizes, P = precision, T = tolerance, LSE = upper speciication limit (average plus standard deviation), LIE = lower speciication limit (average plus standard deviation).
Results
The results of measurements performed during the manual track-ing mode by three evaluators presented acceptable values, in comparing between known distance and distance traced (Table 1).
The total distance traveled, that is the sum of the three differ-ent 10 minutes animal tracking results performed by the differdiffer-ent raters found was 40.08 meters for the rater n° 1, 40.10 meters (maximum value) evaluator n° 2 and 40.01 meters (minimum value) for evaluator 3. The largest difference found in the value of the distance traveled between the evaluators was 0.10 meters (0.27%). The igure 4 show the result of the tracking of the animal by three evaluators during the irst attempt.
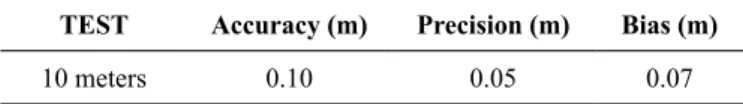
Table 3- values obtained in the calculations of accuracy, precision, and bias of the irst experiment.
TEST Accuracy (m) Precision (m) Bias (m)
10 meters 0.10 0.05 0.07
Table 4 - Data of the variables of the σ2 measurement error for the reliability of the second experiment.
TEST σrepeatability σreproducibility σ2meter Ratio P/T
R&R 0,08 0,05 0,009 0,1
Discussion
Methodologies based on videogrammetry allow to investigate and to better understand various phenomena in laboratory animals related to the displacement, such as: the effect of psychostimulant drugs on locomotion13, quantify the inluence of the environment on physical activity levels21, improve animal study protocols21, to study memory information and spatial orientation10.
The present study was designed to investigate the accuracy and reliability of measurement of displacement of Wistar rats by videogrammetry using manual tracking mode of the Dvideo. The Dvideo interface allows to obtain the screen coordinates of a given object through an operator, pointing the computer screen to the object whose coordinate you want to obtain, with the help of the mouse. It is an option used where it is not pos-sible to perform the measurement automatically.
The indings of this study, accuracy of 1% (0.10 m) and reliabil -ity through the calculations of R&R (P/T = 0.10 m) demonstrated that manual tracking mode of the Dvideo 2D videogrammetry is a good method to analysis of displacement of Wistar rats.
The accuracy 0.10 m, precision (0.05 m) and Bias (0.07 m) corroborate with previous studies6,17 in which through
vid-eogrammetry has been veriied the reliability of the software Dvideo in determining the displacement in soccer players and analysis of human movements, respectively, demonstrating its lexibility of application. Although the situations of analysis of the above studies are different, displacement in soccer ield, movement of human body segments and, of the present study, with rat displacement, in all situations the use of Dvideo software presented accuracy. Speciically, in the studies on displacement analysis in the experimental model with rats, to our knowledge, no study presented the accuracy and reliability of the measure in its different methods, such as an ultrasonic activity monitor2, electronic device3, calculation of the position of the center of gravity on the ground4, and infrared detection5. Therefore, the comparison of our results with results from other studies with animal is limited. This is the irst study that presents the accuracy of the displacement analysis in the experimental model with rats, demonstrating the reliability of the Dvideo system, through manual tracking mode, for use in studies with displacement in the experimental model with rats.
The analysis by videogrammetry allows storage of information and analyze the behavior of several rats allocated in the same environment, which is not possible to do with the methods applied in previous studies, such as ultrasonic activity monitor2, electronic device3, calculation of the position of the center of gravity on the ground4, and infra-red detection5. In those studies cited above, the rat is evaluated in isolation, without interaction with others animals. The videogrammetry system allows the displacement analysis considering the animal’s interaction with other animals and the environment, which can be manipulated by the researcher. Inside the videogrammetry analysis, the automatic method has been used in studies on the behavior in the light/dark cycle21,22, distance and speed13,10. On the other hand, to our knowledge, the videogrammetry with manual tracking mode had not yet been tested in animal experiments. In the present study, the manual tracking mode of analysis presented reliability and accuracy. In addition, the system analyzed in present study is a low-cost option compared to the automatic method, which has a high commercial value, while the Dvideo software was developed for research purposes and made available free of charge.
Videogrammetry manual tracking mode reliability veriied through the study of parameter R&R18 demonstrated to be useful for evaluating the tool used in the experiment, once your setting was 0.1 meter, which indicates an adequate measurement capability. The index R&R is used to verify the suitability of the measuring system, determined by reason of 6σmeter to the total tolerance range or precision to tolerance ratio (P/T). Once the ratio P/T is inluenced by the reliability (basic accuracy associated with the measuring tool itself) and reproducibility (variability due to the fact that the measuring system to be used by different raters), the result found for reproducibility (0,05 ) with regard to reliability (0,08) makes it clear that the use of videogrammetry using the Dvideo between different evaluators have good reliability.
The method manual tracking mode videogrammetry , em-ployed in this study to rats, in addition to presenting low cost, accuracy and reliability veriied, it may be useful for research in different experimental models with rats and other species, such as the analysis of the social behavior of Wistar rats kept in enriched environment, analysis in isolated situations, such as labyrinths, or any other condition where it is possible to carry out the acquisition of image with top view.
Finally, it is important to note that the present study does not close this topic. The study presents the limitation of evaluating only one animal species, Wistar rats, in an enriched environ -ment. Thus, although the accuracy and reliability of the Dvideo system has been conirmed, further studies should be carried out, with animals of another species, such as mice, mainly because of the difference in body size and the displacement velocity between the two animal species, rat and mice, and the to analyze in other environment.
Conclusion
The high reliability of system tested in present study demonstrate that the videogrammetry manual tracking mode of the Dvideo can be useful to the analysis of distance traveled in experimental
models that study the effects of different variables on animal behavior, such as social interaction, drugs, food and diet, physi-cal activity and exercise among others.
References
1. Kilkenny C, Browne WJ, Cuthill IC, Emerson M, Altman DG. Improving Bioscience Research Reporting: The ARRIVE Guidelines for Reporting Animal Research. PLoS Biol. 2010; 8(6). 2. Akaka WH, Houck BA.The use of an ultrasonic monitor for
recording locomotor activity. Behav Res Meth Instrum Comput. 1980;12(5): 514-516.
3. Tarpy RM, Murcek RJ. An electronic device for detecting activity in caged rodents. Behav Res Meth Instrum Comput. 1984; 16(4): 383-387.
4. Gapenne O, Simon P, Lannou J.A simple method for recording the path of a rat in an open ield. Behav Res Meth Instrum Comput. 1990; 22(5): 443-448.
5. Clarke RL, Smith RF, Justesen DR. A programmable proximity-contact sensor to detect location or locomotion of animals. Behav Res Meth Instrum Comput. 1992; 24(4): 515-518.
6. Barros RML, Brenzikofer R, Leite NJ, Figueroa PJ. Development and evaluation of a system for three-dimensional kinematic analy-sis of human movements. Res Biomed Eng. 1999; 15(1): 79-86. 7. Noldus LP, Spink AJ, Tegelenbosch RA. EthoVision: A versatile
video tracking system for automation of behavioral experi-ments. Behav Res Meth Instrum Comput. 2001; 33(3): 398-414. 8. Garland T, Schutz H, Chappell MA, Keeney BK, Meek TH,
Copes LE, et al. The biological control of voluntary exercise, spontaneous physical activity and daily energy expenditure in relation to obesity: Human and rodent perspectives. J Exp Biol. 2010; 214(2): 206-229.
9. Marin MT, Zancheta R, Paro AH, Possi AP, Cruz FC, Planeta CS. Comparison of caffeine-induced locomotor activity between ado-lescent and adult rats. Eur J Pharmacol. 2011; 660(2-3): 363-367. 10. Xie H, Wu Y, Jia J, Li G, Zhang Q, Yu K, et al. Enrichment-induced
exercise to quantify the effect of different housing conditions: A tool to standardize enriched environment protocols. Behav Brain Res. 2013; 249: 81-89.
11. Perez-Leighton CE, Grace M, Billington CJ, Kotz CM. Role of spontaneous physical activity in prediction of susceptibility to activity based anorexia in male and female rats. Physiol Behav. 2014; 135: 104-111.
12. Augusiak J, Brink PJ. Studying the movement behavior of benthic macro invertebrates with automated video tracking. Ecol Evol. 2015; 5(8): 1563-1575.
13. Smethells JR, Swalve N, Brimijoin S, Gao Y, Parks RJ, Greer A, et al. Long-Term Blockade of Cocaine Self-Administration and Locomotor Activation in Rats by an Adenoviral Vector-Delivered Cocaine Hydrolase. J Pharm Exp Ther. 2016; 357(2): 375-381 14. Barbieri FA, Gobbi LT, Santiago PR, Cunha SA. Performance
comparisons of the kicking of stationary and rolling balls in a futsal context. J Sport Biomech. 2010; 9(1): 1-15.
15. Bueno MJ, Caetano FG, Pereira TJ, Souza NM, Moreira GD, Nakamura FY, et al. Analysis of the distance covered by Brazilian professional futsal players during official matches. J Sport Biomech. 2014; 13(3): 230-240.
16. Pereira TJ, Nakamura FY, Jesus MT, Vieira CL, Misuta MS, Barros RM, et al. Analysis of the distances covered and technical actions performed by professional tennis players during oficial matches. J Sports Sci. 2016; 1-8.
17. Barros RML, Misuta MS, Menezes RP, Figueroa PJ, Moura FA, Cunha SA, et al. Analysis of the Distances Covered by First Division Brazilian Soccer Players Obtained with an Automatic Tracking Method. J Sports Sci Med. 2007; 6(2): 233–242. 18. Mikhail EM, Ackerman FE. Observations and least squares. New
York: IEP; 1976.
19. Montgomery DC. Introduction to statistical quality control. Hoboken, NJ: Wiley; 2004.
20. Sztainberg Y. Chen A. An environmental enrichment model for mice. Nat Protoc. 2010; 5(9): 1535-1539.
21. Verwey M, Robinson B, Amir S. Recording and Analysis of Circadian Rhythms in Running-wheel Activity in Rodents. J Vis Exp. 2013; (71).
22. Aslani S, Harb MR, Costa PS, Almeida OF, Sousa N, Palha JA. Day and night: Diurnal phase inluences the response to chronic mild stress. Front Behav Neurosci.2014; 8:82.Acessoem 01/11/2016: In: Pubmed; PMID 24672446.
Corresponding author
Osvaldo Tadeu
Universidade Estadual Paulista Julio de Mesquita Filho - Campus de Rio Claro, Physical Education. Av. Engenheiro Luiz Edmundo Carrijo Coube, Rio Claro. Brazil Email: [email protected]
Manuscript received on December 14, 2016
Manuscript accepted on April 28, 2017