Introduction
As many developing countries, Chile has shown a sustained growth in its overweight and obesity rates in the last twenty years. The last ENS, or National Health Survey, conducted in 2009, showed that 39% of Chileans were overweight and 25% were obese1. Initially, the obesity problem was confronted with programs promoting healthier dietary habits directed at the adult and schoolchildren populations2. This situation, however, began to change at the beginning of the last decade with the introduction of programs that, together with educating the population with regard to modifying their eating habits3, also emphasized the importance of physical activity (PA). Examples of this are the programs Vida Chile, launched in 20034, and Elige Vivir Sano, launched in 20075.
The inclusion of physical activity in the agenda to combat the obesity epidemic was far from being novel. Indeed, since the early nineties, the United States, the United Kingdom and Canada have confronted the obesity epidemic by paying atten-tion to environmental factors that act as barriers or facilitators to the adoption of healthy lifestyles 6,7,8,9. In 2004, these ideas
were ratiied by the World Health Organization (WHO) using
the slogan: “a healthy city is an active city”10, which gave ori-gin to the recommendations of physical activity, namely, 150
minutes of moderate activity per week, in order to maintain an appropriate health condition.
In the case of Chile, the National Health Surveys of 2006 and 2009-10 showed that nine out of ten Chileans do notengage in PA regularly1. These results prompted the authorities to adopt a more energetic strategy regarding the promotion of healthier lifestyles. Consequently, they started analyzing whether the urban environment was acting as a facilitator or as a barrier for
adop-tion of a more active lifestyle. In this context, many OGs were
installed in the last decade in Chile’s capital, Santiago (6.5 m).
The irst OG was installed in 2006, in the central district of Quinta Normal. Having one or more exercise machines, OGs
allow users to carry out physical activities of different types (cardiovascular, strength and elongation) free of charge, and in
an outdoor environment (Figure 1). In 2007, a series of OGs
were inaugurated in the coastal city of Viña del Mar (100 km
East of Santiago), with a signiicant amount of press coverage,
which contributed to the growth of outdoor gyms in the following years. Financed by the municipalities, or by several governmental agencies11, in less than ten years this type of infrastructure has expanded to metropolitan areas, intermediate-sized cities, and towns, becoming part of the urban scenery of squares, streets and sidewalks of Chile nowadays.
Original article (short paper)
Outdoor gyms in Santiago: urban distribution
and effects on physical activity
Rodrigo Mora
Universidad Diego Portales, Santiago, Chile
Gerardo Weisstaub
Universidad de Chile, Santiago, Chile
Margarita Greene
Pontiicia Universidad Católica, Santiago, Chile
Geraldine Herrmann
Universidad Diego Portales, Santiago, Chile
Abstract — Aims: To put together a registry of the location of all existing outdoor gyms (OGs) in Santiago, Chile, and
establish a proile of the users of these gyms. Methods: All OGs in Santiago located in public spaces were identiied
and geo-referenced, and an accessibility analysis of them was carried out. A total of 1,023 users of OGs were surveyed (71% men, average age 31.5 years old, SD =16.6), about the frequency of use of OGs, amount of time spent using them,
transportation habits, motivation for usage, and their perceptions regarding their own health, among other questions. In addition, each person’s neck circumference was measured. Results: There are 1,981 OGs in the city squares, sidewalks and parks, mostly located in poorest areas of the city. Most OG users live less than one kilometer away from an OG. Discussion: In line with international studies, this research demonstrates that OGs have positive collateral effects, as they not only contribute to users to increase their physical activity, but also because they attract people with sedentary lifestyles to make physical activity. This, in turn, might contribute to make urban areas more livable and safer, for they bring new “eyes to the street” and permit to use cities’ under-occupied public spaces. Conclusion: The proliferation of outdoor gyms should be regarded as an opportunity for public health policies aimed at tackling the obesity problem and increasing the physical activity of people.
A study carried out in 2012 showed that two out of ive us
-ers of OGs installed along the streets of Pocuro, in the Eastern
side of Santiago12, did not carry out any physical activity prior to their construction. Studies carried out after the installation
of outdoor gyms have shown that OGs are positively evalu
-ated by the public, as these installations facilitate spontaneous
meetings of residents, promoting social cohesion, especially in vulnerable areas13 .
In spite of the above, little research has been done on how OGs
are being used by people. The current study tries to complement
existing studies, learn the location of the OGs in Santiago, their usage patterns, as well as the proile of their users.
Methods
This study was conducted in two stages. The irst stage sought to create a record of all existing OGs in Santiago: the record was required because OGs were built by each municipality of the city
in an autonomous, organic way. The record was conducted by requesting the 37 municipalities to provide information regard-ing this type of equipment in their jurisdictions. This
informa-tion was veriied on site and later transferred to a geographical information system (software ArGis 10.3).
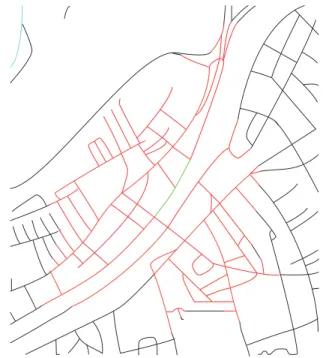
Once all OGs were mapped, an accessibility analysis was car -ried out. To do so, we employed the Network Analyst tool of Arc
Gis, which allowed determination of the “service area” (in this
case an outdoor gym), within the city’s urban grid, considering a
speciic radius. In this case, a radius of 500 meters was set, equal
to a ten-minute walk, a typical threshold used in urban studies14,15.
Figure 2 illustrates this procedure.
The accessibility of OGs was irst studied at a district level,
that is, assessing how much of a district’s total urban grid had
an OG at 500m or less, and later at a city level, that is, the per
-centage of the urban grid of Santiago with an OG at the same distance. In addition to metric-based accessibility of OGs, a
socioeconomic accessibility analysis was performed. The pro-cedure consisted of selecting all blocks within the 500m radius
of OGs, and then analyzing the socioeconomic characteristics
of all households living in these blocks, based on data from the 2002 National Census16. Socioeconomic groups were divided
into ive categories: ABC1, C2, C3, D and E, according to the
stratiication deined by Adimark17, the traditional survey used
in Chile to classify socioeconomic strata1.
The second stage surveyed a large pool of users of OGs. The
survey collected basic characteristics of users, such as age, gender
and educational level,as well as speciic information regarding
1 “he ive strata order has been the traditional way to classify socioeconomic groups in he ABC1 is the wealthiest group and corresponds to about 11.3% of the population. he C2 corresponds to 15,4% of Chileans. he C3 group accomodates 22.4% of the population, while the D and E, the poorest socioeconomic groups, represent 34.8% and 20.3% of the population, respectively”
Figure 1: Outdoor gym in Santiago. Source: own elaboration
how OGs were perceived and used. Participants were asked if they considered themselves users of the OGs, and how many blocks they lived from an OG they were using. They were also
asked how long they spent at these facilities and three questions
of the GPAQ questionnaire: 1) if they walked or used a bicycle
for more than 10 minutes to get to work, or school/university, and how frequently they did this; 2) evaluation of their general health level compared to one year ago; and 3) whether prior to
using the OGs these users had carried out any physical activity and what was their main motivation to use the OGs.
Figure 2: Example of a 500 m accessibility analysis. The green line corresponds to the “origin”, while all red lines show the area covered by a 500 m walk from it. Source: own elaboration
lexible metric tape (Seca pediatric 5-5) at the level of most
prominence of the cricoid cartilage (Adam’s apple)18,19,20,21. In
order to deine a large neck perimeter, the following measure
-ments were considered as references for this study: ≥ 35 cm for
women, and ≥41 for men19. This measurement was conducted
by the same surveyors who distributed the written survey, who had been trained before on this type of measurement at the National Institute of Food Technology, a well-known institute for the study of obesity at the University of Chile.
The survey was conducted among 1,023 people (71% men, average age 31.5 years, standard deviation =16.6) between June 2015 and January 2016. The sample allowed an estimation
er-ror level of 3% with a conidence interval of 95%, assuming
that this encompasses a large population (over 100,000 cases), maximum variance and a random selection. It is worth noting
that it was not possible to know the real population of OG users
prior to the elaboration of this research, as no registry of this kind of equipment existed before this research.
Most surveys were carried out in three districts of Santiago, each representing different socioeconomic groups: Maipú (39%, middle-to-low income level), Providencia (31%, middle-to-high income level), and Santiago (18%, middle income district). The
other surveys were conducted at OGs located in the South and West of Santiago. People surveyed signed an informed consent
(previously approved by the Ethics Committee of the Universidad Diego Portales and approved by Conicyt), before responding to the questionnaire.
The third stage consisted of an initial descriptive analysis of
the OG location (number and type of outdoor gyms in Santiago
by district), the number of itness equipment, and their urban ac
-cessibility. Data analysis of surveys began with a description of each variable to establish a consistency of the registered informa-tion (range of values, lost responses, registrainforma-tion errors, etc.), in addition to identifying typical values and dispersion. In the next stage of analysis, association patterns between key variables were
examined. Given the level of measurement of the variables, this
was carried out with the aid of contingency table adjustments
and the application of the statistical test of Chi-square (χ2) or
observed distribution versus expected distribution.
Results
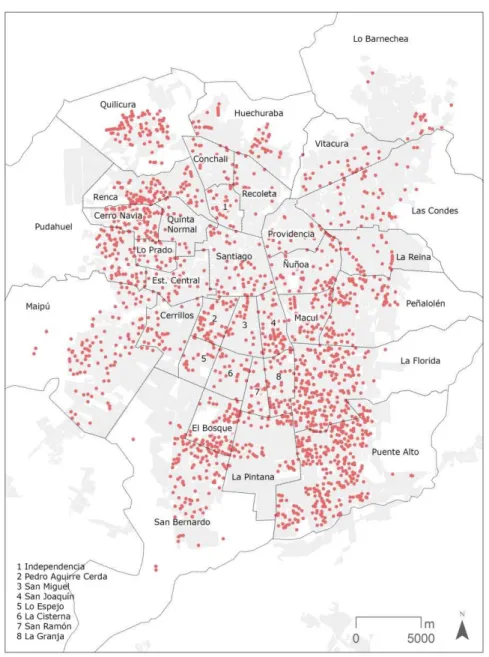
We surveyed 1,981 OGs in Santiago, as shown in Figure 3. As
it can be observed, outdoor gyms were not evenly distributed in the city, for districts such as Puente Alto or La Florida, in the South of Santiago, have 295 and 215 outdoor gyms, respectively,
while districts such as Quinta Normal or Lo Barnechea, in the
Central-East of Santiago, have only 10 and 17 outdoor gyms, respectively. Figure 4 shows these differences. It is worth noting
that the greatest concentration of OGs is in the South and West
part of the city, the poorest areas, while districts in the Eastern
part of the city, the most afluent, have fewer gyms.
The average number of itness equipment per OG was 4.6
(SD=2.5), although 70% of the registered installations had 3 to 6 (see Table 1). There were important differences in this aspect: while some districts tended to favor smaller installations (one
or two itness equipment) to spread them over the district, oth
-ers favored OGs with more itness equipment in fewer places.
Accessibility analysis – with a radius of 500 meters – showed
that most residents live near OGs near. Indeed, 64% of the households of the city have an OG (regardless of the number of itness equipment in it) within 500m. If only outdoor gyms
with four or more itness equipment are considered (which al
-lows many people exercise simultaneously), 53% of the street
layout of the city has an OG within 500 m or less, and 27% if only outdoor gyms with six or more itness equipment are
considered. Figure 5 shows these results.
Figure 6 shows that outdoor gyms are more likely to be found in poor areas than in rich areas. Indeed, while 45% of all households belonging to the highest socioeconomic group
(ABC1) have an outdoor gym at a walking distance, 60% of the
poorest households have an outdoor gym within 500 m radius. Table 2 shows the main results of the survey. First, the most
participants surveyed consider themselves users of OGs (89.1%).
Some interesting differences were found between males and
females. The irst signiicantly statistical difference refers to the habits of physical activity prior to the installation of the OGs:
men expressed a greater inclination towards carrying out physi-cal activity than women (80.3% vs. 61.3%, x2 (1) = 42.3, p <, 001). Secondly, although women and men were highly inclined to walk or use a bicycle to travel from home to a place of work and/or study (82.7% and 85.3%, respectively), men were more likely to do this on a daily basis (82.3% of men vs. 74.2% of
women make their journeys in an active manner more than ive
times a week, x2 (1) = 42.6, p <, 01). Thirdly, men and women
had different motivations to use the OGs: while men primarily
sought to improve their health (56.5% of men preferred this
alternative vs. 47.9% of women), women used the OGs to lose
weight (26.2% of women chose this alternative vs. 10% of men, x2 (4) = 42. 2, p <, 001). Other factors of interest are detailed below, which resulted from the survey, but they did not show
signiicant differences between men and women.
Although accessibility analysis showed that 64% of the
households of Santiago had an OG at a distance of 500 m or less, only 44.7% of those surveyed said that they lived ive blocks or less from the OG they were using. The study showed that women were less inclined to use OGs that were farther than ive blocks from their home (53.3% of women said they lived ive blocks or
less from the gym they were using vs. 42.4% of men). This could
mean that OG users do not necessarily go to the closest facility
to their residence, but rather to the one that provides them with a more complete exercise routine, or that have a more convenient location in the city, either for esthetical or for security reasons. More detailed studies are needed to answer these questions.
Regarding the amount of physical activity performed at OGs,
the survey detected that 32.1% of users say that they attended these installations four or more times per week, 37.9% said their frequency was three times a week, and 30% said they exercised between one or two times per week. Additionally, most attendees
declared they used OGs for extended periods: about 76.8% said
they spent 30 minutes or more exercising.
It was also found that OG users have active lifestyles:
Figure 3: The 1,981 outdoor gyms in public spaces currently in operation in Santiago. Source: own elaboration
45 45 51 54 58
69 80 85 85 87 90 96 103
215 295
30 33 46 47
22 18 18 20 22 23 24
50
29 30 39
20 350
17 25
50 150 250
0 300
200
100
10
Quinta Normal Independencia V
itacur
a
Cerrillos Estación Centr
al
La Reina La Gr
anja
Las Condes PA
C
Lo Barnec
hea
Lo Espejo Recoleta Conc
hali
Lo Pr
ado
San Miguel San Ramón Pro
videncia
La Cisterna Huec
hur
aba
Quilicur
a
Peñalolén Renca Maipú San Bernardo La Florida Puente Alto Nuñoa Macul La Pintana Santiago San J
oaquin
Pudahuel El Bosque Cerro Na
via
for at least ten minutes when moving through the city, and
79.7% said they do this ive days a week. Moreover, about
91.2% said they combine the use of OGs with other physi
-cal activities, such as riding a bicycle or jogging. The above
suggests that OGs are not only affecting the immediate urban
space by motivating more neighbors to occupy squares and city parks, but also are allowing people who engage in outdoor physical activities, such as joggers and cyclists, to diversify their sports activities.
Table 1: Number of itness equipment per outdoor gym. Source: own elaboration
Type of Gym Quantity %
1 to 2 itness equipment 276 13.9
3 to 4 itness equipment 996 50.3
5 to 6 itness equipment 394 19.9
7 or more itness equipment 315 15.9
Total 1,981 100
30%
10%
64%
53%
20%
0% 70%
all outdoor gyms R=500m 50%
27%
Four or more fitness equipment R=500m
Six or more fitness equipment R=500m 60%
40%
Figure 5: Percentage of urban grid of Santiago with at least one outdoor gym within a 500 m distance. Source: own elaboration.
0%
58%
55% 57%
70%
45%
30% 50%
20% 40%
56%
E 10%
D
60%
Total C3
ABC1 C2
60%
Figure 6: Percentage of all households of different socioeconom-ics groups with an outdoor gym at a distance up to 500 m. Source: own elaboration.
Table 2: Main results of survey. Source: own elaboration
Q Content of Question All Women Men
1 Do you consider yourself an OG user? (% YES) 89.1 88.1 89.5
2 How many times a week do you use an OG? (%1 - 2 times /3 times
/4 - 7 times) 30 / 37.9 / 32.1 26.9 / 41.8 / 29.1 30.3 / 36 / 33.6
3 Distance in blocks to the OG (% 5 or less/ more than ive blocks) 44.7 / 50.3 53.3 / 46.7 42.4 / 57.6
4 How many minutes do you spend at an OG on each visit? (% less
than 30 minutes /30-50 minutes/60 minutes or more) 23.2/ 33.1 / 43.7 31.5/ 47.6 / 20.8 33.9/ 41.8 / 24.3
5 Do you practice another PA when you come to this OG? (% YES) 91.2 90.8 91.4
6 Did you carry out PA regularly prior to the use of this OG?(% YES) 74.1 61.3 80.3
7 Do you walk or use a bicycle for 10 min for your transportation
needs? (% YES) 84.4 82.7 85.3
8 In a typical week, how many days do you ride a bicycle or walk at
least ten minutes? (% 5 or more times ) 79.7 74.2 82.3
9 Health condition compared to one year ago (% much better /
some-what better / the same / somesome-what worse) 63.6 / 24.7 / 11.7 64.9 / 25 / 10.1 62.9 / 24.6 / 12.5
10 Motivation to use an outdoor gym (% lose weight/ improve health / socialize / relax / other)
15.6 / 53.5 / 1.4 / 15.9 / 13.6
26.2 / 47.9 / 0.7 / 15.1 / 10.1
10 / 56.5 / 1.8/ 16.3/ 15.4
Fourthly, it was observed that OGs had a positive effect on
health. Indeed, 25.9% of participants surveyed said they did not carry out any physical activity on a regular basis prior to
the installation of outdoor gyms, which in the case of women
reached 38.7%. The above suggests that OGs might be acting as
inactive. This behavioral change might have affected how people perceived their own health, as demonstrated by the fact that almost 63.6% of participants surveyed said their general health is better than one year ago.
Measurements of the neck circumference in men and women show a consistency with the Chilean National Health Survey of 2009-10 (ENS)1. As shown in Table 3, neck circumference in men was 39.3 cm (SD=3.1) versus 39.1 in the last ENS survey, while in women it was 35.6 cm (SD=3.4) versus 34.7 in the abovemen-tioned survey1. In the same manner, a progression of these values, for both women and men, was observed as their age increased.
In other words, OG users do not have a lower cardiovascular risk
than the general population. However, a disaggregate analysis of
the population suggests a positive effect of OGs for those with
larger neck measurements. It is estimated that 31% of people surveyed with neck perimeter larger than P=0.75 percentile were
more inclined to carry out physical activities after OGs had been
installed than those with neck perimeter smaller than P=0.75 threshold, (x2(1) = 19.1, p <, 001). In addition, these people cited
weight loss as the most important factor for using OGs (26% of
them said they wanted to lose weight versus 10% of other people surveyed, (x2(4) = 40.5, p <, 001).
Cases (N) 15-24 25-44 45-64 65 and over All ages
Men 38.6 (SD=2.3) 39 (SD=2.6) 41.5 (SD=4.4) 40.9 (SD= 2.0) 39.3 (SD= 2.9)
NHS 2009-10 Values 1975 37.2 39.3 40.1 39.4 39.1
Women 34 (SD=2.7) 36 (SD=3.7) 37.6 (SD=2.7) 34.6 (SD=2.8) 35.6 (SD= 3.4)
NHS 2009-10 Values 2931 33 34.7 35.7 35.5 34.7
Discussion
There are several points of interest resulting from this investi-gation. First, the quick expansion of outdoor gyms in Santiago reveals a growing concern from municipalities of different socioeconomic areasover urban environments that encourage people to engage in physical activity.
This interest was not part of a plan proposed by the central government, but the result of individual initiatives by each mayor of the 37 districts of Santiago. It is still debated to what extent city managers perceive that the urban environment can facilitate the adoption of active lifestyles. Urban policies in Chile, however, should attempt to export this approach to higher levels of government, such as ministries and regional governments to generate a multi-sectorial agenda to encom-pass different policies, such as health, urbanism, transport and sports into the design of the urban environment. This last point is especially relevant in the case of Chile, where the govern-ment’s self-imposed health goals relegate physical activity in
the urban environment to a secondary role in the ight against
the obesity epidemic22.
In line with international studies on OGs 23,24, this research
demonstrates that these installations have positive collateral effects, as they not only contribute to increase physical activity made by their users23, but also because they attract people with sedentary lifestyles to make physical activity12,23,24,25. This, in turn, might contribute to make urban areas more livable and safer, insofar as they bring new “eyes to the streets”26, giving new “purpose” thus to under-occupied parks and green areas in the cities23. Indeed, studies carried out in Chile show also
that OGs have become places where families and neighbors of
vulnerable areas can meet and interact in the public space, for they give an “excuse” to occupy the public space13.
In line with international studies, people will more likely
use OGs close to their homes. Moreover, OG users tend to
engage in other forms of physical activity12,23,28, which means that installing these facilities in places of easy access, such as bicycle lanes or lineal parks12, could increase the use of all types of sporting infrastructure.
Previous studies on outdoor gyms in Europe, Asia and North America have shown that outdoor gyms are more likely to be used by seniors and females than men and adolescents24, 25, 26. This is not the case of this study, nonetheless. Indeed, the major-ity of outdoor gym users were men under 30 years, with active lifestyles. This pattern, also detected in another type of research on outdoor gyms in Chile11, 12, 13 suggests the existence of cultural barriers for using public equipment for physical activity. Future policies should attempt to integrate other groups (seniors and women) to the use of outdoor gyms.
In contrast to green areas (parks) unequal distribution , which
are concentrated in the afluent part of the city27, OGs are more
prevalent in the poorer and more densely populated areas of Santiago. Indeed, districts with higher indices of obesity and sedentary lifestyles (97% according to ENS 2009) have more
OGs. OGs can thus play an important role in the development
of preventive health policies aimed at vulnerable groups and seniors28. Moreover, by attracting people to use parks and open spaces 28, 29, 30 OGs could also contribute to occupy public spaces in poorer districts of Santiago, improving the perception of security in these neighborhoods by increasing the amount of people on the streets31, which could help prevent young people engaging in antisocial behavior.
References
1. Ministerio de Salud, Encuesta Nacional de Salud 2009. National Health Survey 2009, Chile´s Ministry of Health. Consulted in July 2015: http://web.minsal.cl/portal/url/item/bcb03d7b-c28b64dfe040010165012d23.pdf
2. Kain J, Uauy R, Leyton B, Cerda R, Olivares S, Vio F. Effectiveness of a dietary and physical activity intervention to prevent obesity in school age children. Rev Med Chile. 2008;136 (1):22-30
3. Salinas J, Cancino A, Pezoa S, Salamanca F, Soto M. Vida Chile 1998–2006: resultados y desaf́os de la poĺtica de promocín de la salud en Chile. Rev Panam Salud Publica. 2007;21(2/3):136–44. 4. Consejo Nacional para la Promocín de Salud VIDA Chile. Plan
Estratégico 2001-2006. Metas Intersectoriales al. 2006. Ministerio de Salud, Santiago, Chile 2000.
5. Elige Vivir Sano [Internet]. Santiago, Ministerio de Salud. Disponible desde http://eligevivirsano.gob.cl
6. Sallis JF, Bauman A, Pratt M. Environmental and Policy interventions to promote physical activity. Am J Prev Med 1998;15:379–97.
7. Frank L, Engelke P. The built environment and human activity patterns: exploring the impacts of urban form on public health. J Plan Lit. 2001;16(2); 202–218
8. Jacoby E, Pardo CF. Ciudades del autoḿvil: obesidad y cambio climático: se alinean las crisis y también las soluciones. Slow Research 2010. Documento Nº1, serie “Discusiones contem-poráneas”, Bogotá. Accesado en septiembre de 2015 en http:// www.bvsde.paho.org/texcom/cd045364/ciudadesauto.pdf 9. Cervero R, Kockelman K. Travel demand and the 3Ds: density,
di-versity, and design. Transp Res D Transp Environ. 1997; (2): 199-219 10. Organización Mundial de la Salud, OMS. Estrategia mundial sobre
régimen alimentario, actividad f́sica y salud, 2004. Accesado en http://www.who.int/dietphysicalactivity/goals/es/
11. Mora R, Weisstaub G. Gimnasios al aire libre en la ciudad de Santiago. Rev Med Chil. 2016; 144 (12):140-41
12. Mora R, Moving Bodies: Open gyms and physical activity in Santiago, Chile. Jour Urban Des. 2012; 17 (4): 479–492 13. Katalejo Consultores. Informe sobre uso de gimnasios al aire libre
preparado para el Ministerio de Salud, 2013.
14. Gehl J. Life between buildings. Island Press, London, 1971 15. Aliaga, L. Socio-Spatial Implications of Street Market Regulation
Policy. The Case of Ferias Libres in Santiago de Chile. Working Paper Nº 2011/11, United Nations University, Unu-wider, World Institute for Development Economics Research, 2011
16. Instituto Nacional de Estad́sticas (INE), Censo de Poblacín y Vivienda 2002. Accessed from http://www.ine.cl/canales/chile_es-tadistico/censos/censo_poblacion_vivienda.php. 2002
17. Adimark. Mapa Socioecońmico de Chile. Accessed from http:// www.ine.cl/canales/menu/publicaciones/estudios_y_documentos/ documentostrabajo/estratificacion_socioeconomica_encues-tas_hogares.pdf
18. La Berge R, Vaccani JF, Gow R, Gaboury I, Hoey L, Katz S. Inter – and Intra- Rater Realiability of Neck Circumference Measurements in Children. Pedriatr Pulm. 2009; 44: 64-69 19. Zhou J, Ge H, Zhu M, Chen L, Chen Y, Zhu H. Neck Circumference
as an independent predictive contributor to cardio-metabolic syn-drome. Cardiovasc Diabetol. 2013; 12: 76
20. Ben-Noun L, Sohar E, Laor A: Neck circumference as a simple screening measure for identifying overweight and obese patients. Obes Res. 2001; 9: 470-477)
21. Alie J, Díaz M, Paéz O, Cufaro P, Rodríguez P, Fábreques G, Magni R, Nucci S, Rodriguez M, Marin M. Relacín entre la circunferencia del cuello y el diagństico de hipertensín arterial en el Registro Nacional de Hipertensín Arterial (RENATA). Rev. argent. cardiol. 2012; 80(4): 275-279
22. Gobierno de Chile, Estrategia Nacional de Salud 2011-2020. Para el cumplimiento de los Objetivos Sanitarios de la Década. 2012. Accesado en http://web.minsal.cl/portal/url/item/c4034eddbc-96ca6de0400101640159b8.pdf
23. Furber S, Pomroy H, Grego S, Tavener-Smith K. People´s ex -periences of using outdoor equipment in parks. Health Promot J Austr. 2014; 25 (3): 211
24. Bettencourt L, Neves R. Seniors’ playground and physical activity: Perceptions and practises. J Aging Phys Act. 2012; 20.
25. Cohen DA (2010). Playgrounds for seniors in Europe, Asia and North America. Athletic Business. Retrieved from http://www.athletic -business.com/articles/article.aspx?articleid=3609&zoneid=10 26. Chow H. Outdoor itness equipment in parks: a qualitative study
from older adults’ perceptions. BMC Public Health. 2014; (13):1216 27. Reyes S, Figueroa IM. Distribución, supericie y accesibilidad de las
áreas verdes en Santiago de Chile. EURE. 2010; 36 (109): 89-110 28. Cranney L, Phongsavan P, Kariuki M, Scott A, Hua M, Bauman
A. Impact of a outdoor gym on park users´ physical activity: A natural experiment. Health Place. 2016; 37: 26-34
29. Cohen DA, McKenzie TL, Sehgal A Williamson S, Golinelli D, Lurie N. Contribution of public parks to physical activity. Am. J. Public Health. 2007; 97(3):509-514
30. Cohen D, T, Williamson S, Golinelli D, Impact and Cost-Effectiveness of Family Fitness Zones: A Natural Experiment in Urban Public Parks. Health Place. 2012;18 (1): 39-45
31. Jacobs J. The life and death of Great American cities. Penguin Books, New York, 1960
Acknowledgments
We are grateful to FONDECYT (Project 1141096) and the Centre for Sustainable Urban Development, CEDEUS (Project CONICYT/FONDAP 15110020), for hav -ing inanced this project.
Corresponding author
Rodrigo Mora
School of Architecture, Universidad Diego Portales, República 180, Santiago cen-tro, Santiago 8370074, Chile.
E-mail: [email protected]
Manuscrip received on April 16, 2017 Manuscript accepted on April 22, 2017