www.atmos-chem-phys.net/10/11851/2010/ doi:10.5194/acp-10-11851-2010
© Author(s) 2010. CC Attribution 3.0 License.
Chemistry
and Physics
Cloud thermodynamic phase inferred from merged POLDER
and MODIS data
J. Riedi1, B. Marchant1, S. Platnick2, B. A. Baum3, F. Thieuleux1, C. Oudard1, F. Parol1, J.-M. Nicolas4, and P. Dubuisson1
1Laboratoire d’Optique Atmosph´erique, UMR 8518, Universit´e de Lille 1 - Sciences et Technologies, CNRS, France 2NASA Goddard Space Flight Center, MD, USA
3SSEC, University of Wisconsin-Madison, WI, USA
4ICARE Data and Services Center, Universit´e des Sciences et Technologies de Lille, France Received: 20 September 2007 – Published in Atmos. Chem. Phys. Discuss.: 4 October 2007 Revised: 12 November 2010 – Accepted: 29 November 2010 – Published: 13 December 2010
Abstract.The global spatial and diurnal distribution of cloud properties is a key issue for understanding the hydrological cycle, and critical for advancing efforts to improve numer-ical weather models and general circulation models. Satel-lite data provides the best way of gaining insight into global cloud properties. In particular, the determination of cloud thermodynamic phase is a critical first step in the process of inferring cloud optical and microphysical properties from satellite measurements. It is important that cloud phase be derived together with an estimate of the confidence of this determination, so that this information can be included with subsequent retrievals (optical thickness, effective particle ra-dius, and ice/liquid water content).
In this study, we combine three different and well doc-umented approaches for inferring cloud phase into a single algorithm. The algorithm is applied to data obtained by the MODIS (MODerate resolution Imaging Spectroradiometer) and POLDER3 (Polarization and Directionality of the Earth Reflectance) instruments. It is shown that this synergistic al-gorithm can be used routinely to derive cloud phase along with an index that helps to discriminate ambiguous phase from confident phase cases.
The resulting product provides a semi-continuous index ranging from confident liquid to confident ice instead of the usual discrete classification of liquid phase, ice phase, mixed phase (potential combination of ice and liquid particles), or simply unknown phase clouds. The index value provides
si-Correspondence to:J. Riedi
multaneously information on the phase and the associated confidence. This approach is expected to be useful for cloud assimilation and modeling efforts while providing more in-sight into the global cloud properties derived from satellite data.
1 Introduction
Clouds are important modulators of the Earth’s radiation budget and hydrological cycle. Their macrophysical, mi-crophysical, and optical properties (cloud pressure, tempera-ture, height, optical thickness, thermodynamic phase, effec-tive particle size) and their variation in space and time need to be understood to improve general circulation and weather prediction models. Additionally, cloud properties are being used increasingly in nowcasting activities as part of data as-similation efforts. For nowcasting, the cloud thermodynamic phase is an important indicator used by forecasters to deter-mine hazardous road conditions because occurence of super-cooled precipitation strongly increases the risk of ice forma-tion on the ground (Tremblay and Glazer, 2000).
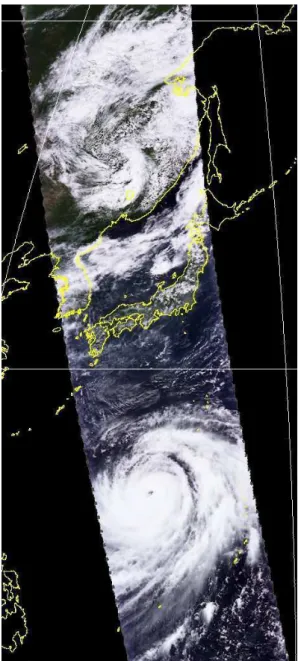
Fig. 1. POLDER true color composite of the common scene ob-served by MODIS and PARASOL on 2 September 2005 (MODIS swath is larger than POLDER but only the common part is presented here). The southern part of the image is typhoon Nabi as it moved North toward Japan.
for determination of optical thickness, effective particle ra-dius and ice/liquid water content.
Recent efforts have been made to derive cloud thermody-namic phase from satellite-based passive radiometric obser-vations (e.g., Hutchison et al., 1997; Knap et al., 2002; Baum et al., 2000; Key and Intrieri, 2000; Goloub et al., 2000; Platnick et al., 2003) but no single method is expected to be preferable for all cloud types and regions. Atmospheric or surface properties can bias existing methods or lead to ambiguous results. Further, a single unambiguous answer
is inappropriate for multilayer cloud systems (Baum et al., 2003; Pavolonis and Heidinger, 2004) or mixed phase clouds (Pavolonis et al., 2005). Yet, both cases are recognized as significant components of the global cloud cover (Hahn et al., 1982, 1984; Tian and Curry, 1989). There is a great interest for new approaches that can provide more meaningful cloud thermodynamic phase information from passive imagers on a global scale.
The approach proposed in this study is based on the syn-ergy between the POLDER-3/Parasol (POLarization and Di-rectionality of the Earth Reflectances) and MODIS/Aqua (MODerate resolution Imaging Spectroradiometer) instru-ments operating in the framework of the A-Train mission. Both POLDER and MODIS have been used to derive key parameters needed to improve our knowledge of cloud prop-erties (Platnick et al., 2003; Parol et al., 2004).
The potential of using polarization measurements of the reflected shortwave radiation to infer cloud phase has been clearly demonstrated using POLDER observations (Goloub et al., 2000; Riedi et al., 2001). The MODIS instrument provides information on cloud phase using two methods that rely on spectral measurements in the visible, shortwave to midrange infrared, and thermal infrared (Platnick et al., 2003). However, both the instruments and the specifically designed retrieval algorithms have limitations that need to be understood and recognized to prevent drawing misleading conclusions from analysis of the data products. Fortunately, limitations from one instrument can partly be mitigated by capabilities available from the other, as will be demonstrated in this paper.
We present a methodology to combine these three dif-ferent and well documented approaches for deriving cloud phase within a single algorithm that uses data from both the MODIS and POLDER instruments. A brief description of the processing algorithm used to merge radiance data from MODIS and POLDER is provided in Sect. 3.
In the first part of the paper, we provide an overview of the theoretical basis of the three methods for cloud phase discrimination with particular emphasis on their respective strengths and limitations. In the second part, the process-ing scheme for the joint MODIS/POLDER data analysis is briefly discussed and the practical implementation of the joint algorithm described. A case study, featuring typhoon Nabi on September 2005, is then analyzed to show how this synergistic algorithm can be used routinely to derive a cloud phase index containing information on retrieval qual-ity/confidence useful for easily discriminating ambiguous from confident cases.
The resulting product is provided as a semi-continuous in-dex ranging fromconfident liquid onlytoconfident ice only
instead of the usualliquid/ice/mixed discrete phase classifi-cation. This approach is a necessary step towards being able to assess errors inherent in derived regional and global cloud products.
Our results will have future implications in two domains. First, the development of the merged POLDER/MODIS phase product aims at creating a reference dataset that can be used for model evaluation or other cloud climatologies as-sessment. Also, the subset of high confidence cases in our dataset can be used to study liquid/ice phase transition as a function of other thermodynamics parameters with mini-mum bias due to temperature dependency of the phase detec-tion technique itself. This is critically needed to understand phase transition in the supercooled temperature range where both ice and liquid can coexist. Second, the present study provides a framework for algorithm development of the up-coming GLORY mission and can be used to define mission requirements for development of future missions that would include multispectral, multiangle and multipolarization mea-surements.
2 Theoretical basis overview
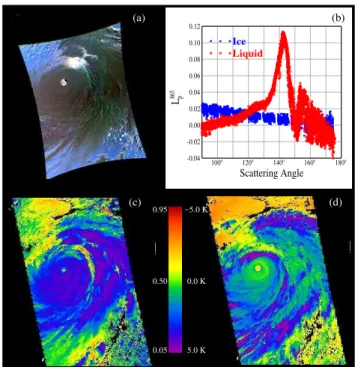
Figure 2 provides an overview of the three metrics used for phase discrimination in this study. The interpretation of these metrics will be discussed. For a case study to illustrate the theoretical basis for the three different methods, we have se-lected a region covered by Typhoon Nabi.
2.1 Multiangle polarization measurements
When considering a cloudy system observed from a satellite, the polarized component of the upwelling radiance comes primarily from the upper portion of the cloud layer. Calcula-tions have shown that the polarized component,Lp, is satu-rated for cloud optical thickness greater than 2–3 depending on the cloud microphysics that are represented by the particle shape and effective size (Goloub et al., 2000; Chepfer et al., 2001). The important quantity for determining cloud phase is the polarized radianceLp, which is less sensitive to
mul-0.05 0.50 0.95 −5.0 K
0.0 K
5.0 K -0.04 -0.02 0.00 0.02 0.04 0.06 0.08 0.10 0.12
Lp
865
100o 120o 140o 160o 180o
Scattering Angle
Ice Liquid
(d) (c)
(a) (b)
Fig. 2. Illustration over typhoon Nabi of the 3 metrics used for
phase determination: (a)false color composite from 490, 670 and 865 nm polarized reflectance for one instantaneous POLDER field of view, (b)typical multi-angular polarized reflectance signature (from POLDER) of liquid (red) and ice (blue) clouds,(c)ratio of shortwave infrared to visible MODIS channel (2.1 to 0.865 microm-eter),(d)brightness temperature difference between 8.5 and 11 mi-crometer MODIS channels.
tiple scattering effects than the total radianceL1. Thus, the polarization features, which correspond tosingle scattering, are preserved inLp.
before 135◦, (iii) negative polarized reflectance before 100◦.
For ice clouds detection we look for: (i) the absence of the
cloudbow around 140◦ using a simple threshold technique
and (ii) decreasing polarization with increasing scattering
angle. The results of these individual tests are then
com-bined using a look-up table filled from a priori knowledge and yields one of the following results : confident ice, ice, unknown, liquid or confident liquid. A thorough description of the use of polarization for cloud phase determination from POLDER can be found in Goloub et al. (2000) and Riedi et al. (2001).
Because it relies on the different single scattering proper-ties of spherical and non-spherical particles, this cloud phase detection may be considered a cloud particle shape detec-tion method. Ice clouds are typically composed of nonspher-ical particles, whereas liquid water clouds are assumed to be composed of spherical droplets.
Finally, the use of polarized angular signatures depends on the availability of particular scattering angles, which means phase information will depend on the total number of view-ing geometries and the range of scatterview-ing angles available. An advantage of this technique is that it is insensitive to par-ticle size and also to potential biases in inferred cloud tem-perature. A complete description of the operational imple-mentation for this algorithm is given by Riedi (2001). 2.2 Shortwave infrared and visible measurements Pilewskie and Twomey (1987) recognized that reflectance measurements near 1.6 and 2.1 µm can provide useful infor-mation for cloud phase discrimination. For wavelengths in the shortwave infrared spectrum, the imaginary part of the refractive index becomes non-negligible for both water and ice, thereby causing absorption by cloud particles to occur at these wavelengths. For the MODIS 1.6 and 2.1 µm bands, the imaginary part is also greater for ice than for liquid wa-ter. With all other properties being equal, an ice cloud will exhibit higher absorption than a liquid cloud.
Since almost no absorption occurs at visible wavelengths, the ratio of shortwave infrared (SWIR) to visible (VIS) re-flectances will be lower for an ice cloud than for a liq-uid cloud, assuming everything but phase is kept the same. Because ice particles are generally larger than liquid cloud droplets, we can derive cloud phase by simply applying threshold tests on the SWIR to VIS ratio. This will work as long as (i) the liquid cloud droplets are small or ice crys-tals large enough (see Sect. 4 for details on threshold values), (ii) the optical thickness is sufficiently large for the tion signal to build (for very thin clouds almost no absorp-tion occurs, hence the SWIR/VIS ratio stays close to unity for both ice and liquid clouds), and (iii) the surface albedo in the SWIR band relative to the visible is not too different.
With these considerations, the ratio of SWIR/VIS re-flectances can provide useful information on the cloud ther-modynamic phase when the optical thickness is greater than
about 1 (King et al., 2004) and as long as the cloud is not composed of internally mixed ice and liquid particles (Lee et al., 2006). As illustrated in the following section, an ob-vious limitation of this metric is that separation between ice and liquid phase can be ambiguous when the particle size be-comes too large for liquid clouds or too small for ice clouds. However, this technique is not subject to cloud temperature bias nor systematic geometrical sampling effects except for the sunglint region over ocean.
2.3 Use of thermal infrared measurements
The bispectral technique discussed in Baum et al. (2003) and Platnick et al. (2003) is currently used for routine analysis of MODIS data. It is based on the fact that the imaginary part of the refractive index for ice and liquid are almost equal at 8.5 µm but diverge significantly around 11 µm with ice hav-ing greater absorption. The use of differential absorption properties is similar to the previous SWIR/VIS technique but thermal infrared (TIR) channels are used, making the infer-ence of cloud phase independent of solar illumination. With this method, cloud analyses will be consistent between day-time and nightday-time conditions.
Radiative transfer simulations indicate that the brightness temperature difference between the 8.5- and 11-µm bands (hereafter denoted as BTD[8.5–11]) tends to be positive in sign for ice clouds that have a visible optical thickness greater than approximately 0.5. Water clouds of relatively high optical thickness tend to exhibit negative BTD[8.5–11] values of generally less than−2 K.
In addition to the differences caused by the divergence in the refractive index for ice and water, the BTD[8.5–11] val-ues are quite sensitive to atmospheric absorption, especially by water vapor. Also, these IR window bands are sensi-tive to the surface emittance properties. Recent studies have shown that the 8.5-µm surface emittance can be much lower than that at 11-µm over non-vegetated land (Seemann et al., 2008). Thus, clear-sky BTD[8.5–11] values tend to be nega-tive because of the difference in surface emissivity over non-vegetated surfaces between the two bands as well as from dif-fering sensitivities to water vapor absorption. The BTD[8.5– 11] value for low-level water clouds tends to become more negative as the water vapor loading increases and as particle size increases. Additionaly, small particles tend to increase the BTD[8.5–11] values relative to large particles (Takano et al., 1992) because of increased scattering (assuming total ice water content is kept constant).
one could make a case on the basis of radiative transfer simu-lations that either water or ice particles could be present (or a mixture of the two), so that one cannot make an unambiguous assessment of the phase. This is important because single-layered clouds of wide spatial extent having cloud-top tem-peratures in the range between 238 K and 270 K are prevalent in the storm tracks in both the Northern and Southern Hemi-spheres. Despite these limitations, the MODIS bispectral IR algorithm reports an unambiguous cloud phase determina-tion in approximately 80% of global data.
The MODIS operational algorithm provides two sets of in-formation for cloud phase. One product is provided day and night at 5-km resolution and is based solely on the bispec-tral thermal infrared technique. The other product, used in the optical properties retrieval, is provided at 1-km resolu-tion during the daytime only and is based on a combinaresolu-tion of both SWIR, thermal IR, and additional information from individual cloud mask tests. However, the synergistic algo-rithm developed in this study uses the MODIS 1-km radi-ances averaged over a POLDER pixel at a constant resolution of about 6 km×6 km for both the SWIR and TIR channels.
3 Algorithm description 3.1 Data fusion
The rationale for merging the three methods previously de-scribed is twofold. First, because each method has its own limitations, it is not always possible to provide a definitive phase determination based on a single technique. By imple-menting multiple approaches, the phase information content can be improved.
The second reason is that when all three methods provide a “reliable” answer, a general agreement between them pro-vides a higher confidence level in the retrieval. When they disagree, this information is again useful because it provides guidance for focused attention and potential for identification of multilayer situations or mixed phase clouds.
3.2 Implementation
In a first step, the algorithm is designed to compute a cloud phase index from each of the three individual methods above described. All algorithms are applied on POLDER and MODIS measurements at a spatial resolution of 6 km×6 km corresponding to POLDER level 1 full resolution data with MODIS radiances being collocated and averaged over each corresponding POLDER pixel).
In our implementation, the polarization (POLDER) and bispectral thermal IR (MODIS) algorithms are obtained di-rectly from application of a copy of the most recent produc-tion code software. However, we allow for more undeter-mined cases in the POLDER algorithm output when the de-cision is known to be less reliable. This is the case when the rainbow region (around 140◦) is not observed, when the
accessible range of scattering angle is lower than 10◦ or if
less than 4 viewing geometries are available. Additionally, the cloud top pressure sanity check is not performed. Fur-ther details are provided in the Algorithm Theoretical Basis Documents for each method and their associated publications (Platnick et al., 2003; Riedi, 2001).
The SWIR/VIS method does not reproduce the more complex algorithm used in the MODIS opti-cal properties phase product (Platnick et al., 2003) (In MOD06 Collection 5 product: refer to Science Data Set
Cloud Phase Optical Properties). Only SWIR/VIS
thresh-olds are applied (2.1 µm to 0.670 µm ratio over land; 2.1 µm to 0.865 µm ratio over ocean) and are given thresholds that provide an unambiguous decision of either ice or liquid phase. Such an implementation of the SWIR/VIS phase algorithm alone would yield a large proportion of undetermined cases if it was to be applied as a standalone phase retrieval scheme. This is counterbalanced here by the combination of the three methods.
After each method has been applied, we ob-tain for each pixel a triplet of index of the form
[phasepolar;phaseSWIR;phaseIR], where phasexxx can be either confident liquid, liquid, mixed, ice, confident ice or unknown (Fig. 3). Note that due to the inherent potential temperature bias of the IR technique, the phaseIR index is never attributed the “confident” index. In a subsequent step, a global phase index is derived from these three individual indices based on a logical decision tree presented in Fig. 4.
The decision tree starts by looking at the thermal IR phase index. The main reasons for this are that (i) the algorithm can be applied everywhere with a minimum amount of unde-termined cases and (ii) it can be applied regardless of solar illumination. The use of this infrared method as a basis for the decision logic has the advantage of providing a maximum coverage of the final phase product and is expected to provide better day/night continuity.
Then, for each possible output of the thermal IR method (liquid, mixed, ice, unknown) the two other indices (phasepolar; phaseSWIR) are compared and a value is at-tributed to phasefinal depending on whether the two indices are in agreement with each other, and also whether they agree with the thermal IR test. The confidence level of each in-dividual index is also considered for this decision. At this stage, the phasefinal value will be around 20 for high confi-dence liquid, 50 for confident liquid, 80 for low conficonfi-dence liquid, 100 for mixed cases, 120 for low confidence ice, 150 for confident ice and 180 for high confidence ice with the exact value depending on the precise triplet combination.
Liquid Mixed Ice Ice HC Unknown Liquid HC
(a) (b) (c)
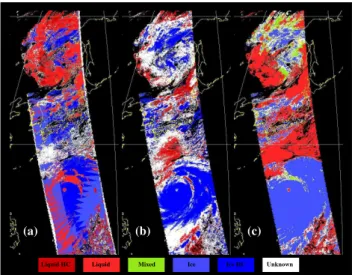
Fig. 3. Results of the partial cloud phase index retrieved from(a)
POLDER polarization algorithm,(b) MODIS SWIR based
algo-rithm and(c)MODIS bispectral IR algorithm.
(ice/liquid with high confidence, medium confidence, low confidence and mixed) made in previous step.
Each possible combination of the [phasepolar; phaseSWIR; phaseIR]triplet is evaluated according to this general logic and accorded a value ranging from 0 (corresponding to high confidence liquid) to 200 (for high confidence ice). The high-est confidence (0 or 200) is reached when all three indices agree with each other and are all at the highest possible con-fidence level for the class considered (the termclassrefers here to either the liquid, mixed or ice category). Intermedi-ate values of the phase index gradually indicIntermedi-ate the level of confidence in the retrieved phase. Values from 0 to 80 will indicate liquid phase from highest to lowest confidence, and values from 120 to 200 will correspond to ice clouds with in-creasing confidence. Values between 80 and 120 will denote mixed cases.
As an example, if two indices indicateliquidand the third index isice, the final decision would beliquidbut with a low confidence value (about 70). When one or two tests can not provide useful information, the remaining test will be used alone to take a decision and will always be accorded a low confidence value. Note that the final decision is not strictly a linear average of the three intermediate results as each com-bination has been evaluated individually. Hence, a combina-tion of 2liquidand 1iceintermediate results will not always provide the same final decision depending on which methods yielded the ice answer.
Themixedphase situations tend to be denoted by a final
index value around 100 and correspond to cases in which the individual tests do not agree with each other. It is important to note that “mixed” phase from a passive remote sensing point of view frequently corresponds to multilayer situations with different phases for each layer. These can not be
sep-phaseSWIR phasePOLAR
phase
IR
phase
Final
phase
Final
phase
Final
= 50 = 100 = 150
phase
IR== Liquid
phaseIR== Ice
phaseIR== Mixed Prepare
phaseSWIR
phasePOLAR phase
POLAR
phaseSWIR
phaseIR == ==
phasePOLAR
phaseSWIR
phase
IR
phasePOLAR
phaseSWIR
phaseIR
phasePOLAR
phase
Final
phase
IR
phase
Final
phaseSWIR
phase
IR
phaseFinal according tophasePOLAR/phaseSWIR
phaseIR
phaseSWIR phasePOLAR
phase
Final
No
according to / Reset value
phaseFinal
Level Confidence Set
phaseFinal
Level Confidence Set Algorithm Algorithm Shorwave Infrared bispectral Multiangle polarisation Thermal Infrared bispectral
Algorithm
FIRST STAGE
SECOND STAGE
Case :
THIRD STAGE
Merge
== Yes
No
Yes
No
== !=
No
== !=
Yes Yes according to
/
according to / Adjust value
Adjust value
Evaluate for each case of : Switch case : Liquid, Ice, Mixed and Unknown
Output final phase index
Adjust value
Init
Fig. 4. Flowchart of the merging algorithm and decision tree used
to produce the final cloud phase index.
arated from “real” mixed phase clouds where both ice and liquid at present at the same time. For instance a thin cirrus over a liquid cloud or a supercooled layer of liquid on top of an ice cloud may not be distinguishable from an “internally” mixed phase cloud. It is expected however that further evalu-ation of our merged phase product in view of CALIPSO and CloudSat observations will help understanding and discrimi-nate these different situations.
A typicalmixed phasecase situation would be for instance, a thermal IR index ofmixed, a SWIR indicatingiceand a po-larization index indicatingliquid. Hence, there is a difference in the final product between low confidence ice or water and mixed phase although the final index over an image has an almost continuous range of values from pure liquid to pure ice.
Finally, when none of the three algorithms is able to pro-vide an indication of cloud phase (ie. all three initial indices
are Unknown), the final phase index will remainUnknown
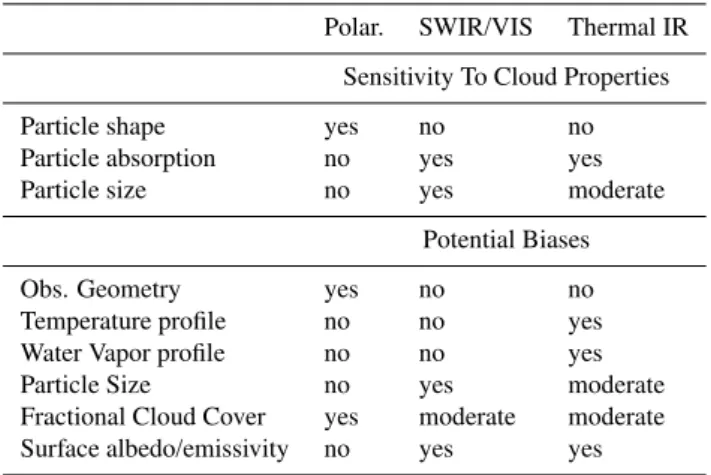
Table 1.Summary of phase algorithm capabilities and limitation.
Polar. SWIR/VIS Thermal IR
Sensitivity To Cloud Properties
Particle shape yes no no
Particle absorption no yes yes
Particle size no yes moderate
Potential Biases
Obs. Geometry yes no no
Temperature profile no no yes
Water Vapor profile no no yes
Particle Size no yes moderate
Fractional Cloud Cover yes moderate moderate
Surface albedo/emissivity no yes yes
4 Theoretical performance consideration
Before considering the case study, we discuss a number of
theoretical scenarios to understand how the algorithm per
-forms in particular situations. To help in understanding this theoretical discussion, we have summarized in Table 1 the basic principles and potential biases for each of the three methods used to develop the joint algorithm.
4.1 Single-layered cirrus
The inference of phase for optically thin ice clouds (i.e., cir-rus) can be problematic because both surface spectral proper-ties and emissivity can bias the SWIR and thermal IR meth-ods.
For the SWIR test, the thresholds have values such that in case of thin clouds, the ratio could be in the undeter-mined range. One exception is in the sunglint region over ocean where the ratio can be high enough to lead to liquid phase. Over ocean in the sunglint region of MODIS, we use the POLDER data to evaluate the “out of glint” cloud re-flectance. If the minimum reflectance at 0.865 µm observed by POLDER out of the glint region is lower than 0.1, the SWIR test is switched off to prevent false detection of liquid phase.
The thermal IR test is very sensitive to thin cirrus due to the strong signal of the BTD[8.5–11]. However, when the cirrus optical thickness is less than approximately 0.5 over oceans and warm, vegetated surfaces (where the sur-face emissivity is high in both IR bands), a false inference of liquid phase can occur (Baum et al., 2003). The misin-terpretation of phase can occur at slightly higher values of cirrus optical thicknesses over non-vegetated surfaces such as deserts.
Fortunately, the problem is reversed for polarization mea-surements since clear skies yield a similar angular signature to ice clouds or very broken low liquid clouds. Hence, by
de-fault the polarization will tend to identify correctly thin cirrus clouds as ice clouds.
Overall, the thin cirrus may be partially misclassified as liquid by the SWIR and IR tests but the polarization tests will reduce this bias.
4.2 Thick ice/liquid clouds
For optically thick clouds, the SWIR/VIS signal is insensi-tive to surface spectral properties but the potential particle size bias remains. The SWIR reflectance will saturate more rapidly than the VIS reflectance as cloud optical thickness increases. Subsequently, the SWIR/VIS ratio will decrease accordingly for both ice and liquid clouds and for all particle effective sizes.
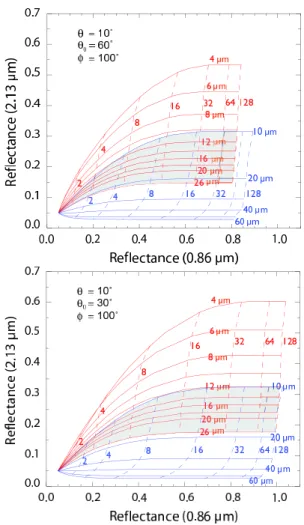
Consequently, the probability that the SWIR/VIS ratio for liquid clouds decreases below a given threshold will increase as cloud optical thickness increases. This tendency occurs regardless of particle size. In this asymptotic regime, we can determine from theoretical values of the SWIR and VIS re-flectances (computed for different values of effective radius and optical thickness), that there exists an extended range of (τc,Reff) combinations where ice and liquid phase clouds are indistinguishable using a simple SWIR/VIS ratio. Figure 5 illustrates the overlap between ice and liquid phase solution spaces in a 2.1–0.865 µm reflectance diagram. Reflectances here were computed using the microphysical properties and radiative transfer models used for the operational MODIS cloud optical properties retrievals (Platnick et al., 2003).
The situation may not be as dramatic as it appears in Fig. 5 because as liquid cloud optical thickness increases, the prob-ability of having larger droplets increases. The reverse is not necessarily true for ice clouds as thick ice clouds could present both large and small particles at cloud top. It remains that the SWIR/VIS ratio metric will provide unambiguous information only for liquid clouds withReff less than 10.0 micrometer or ice clouds withReffgreater than 30 microme-ter.
As can be seen from inspection of Fig. 3, this implies that the potential exists for numerous pixels to remain unclassi-fied using the SWIR/VIS metric. For all these cases, the ad-ditional information from the IR bispectral and polarization techniques will be necessary to provide reliable phase deter-mination.
The BTD[8.5–11] signal is affected by smaller particle sizes because of the increased scattering, but the information provided becomes ambiguous in case of supercooled liquid clouds when cloud top temperature is in the 238 K–270 K range. As with the SWIR test, one could make a case for either water or ice in this range based on a range of simu-lated conditions. A significant number ofundetermined or
mixedcases for these clouds would benefit from additional
information from SWIR/VIS and polarization tests.
Fig. 5. Simulation for two solar and viewing geometries of the 2.1 µm against 865 nm reflectances for an ice (blue) and liquid (red) cloud of varying optical thickness and effective radius. Overlapping zone between the ice and liquid retrieval spaces (shaded region) cor -responds to situation where a SWIR vs. VIS/NIR reflectance metric can not provide unambiguous phase information.
is not broken and the angular range available is sufficient. The main limitation remaining is that polarization provides information for the top of the cloud and will not be sensitive to anything below an optical depth of 3.
4.3 Thin ice cloud over liquid water cloud
Multilayered clouds, and in particular the case where an ice cloud overlies a lower-level liquid cloud, are problematic for any passive retrieval of cloud properties because for practi-cal purposes, current operational algorithms have to assume a single-layered cloud of homogeneous phase. For multilay-ered clouds, a single phase obviously cannot represent the sit-uation. As a consequence, an obvious problem occurs when a cloud optical property model has to be chosen from a static look-up table for the subsequent retrieval of optical thickness and particle effective size.
-0.02 0.00 0.02 0.04
Lp
865
60o 80o 100o 120o 140o 160o 180o Scattering Angle
δ =0
δ =0.25
δ =0.5
δ =1
δ =2
δ =3
δ =4
Liquid cloud alone
δ=0 Cirrus optical thickness
Fig. 6. Simulation of polarized reflectance at 865 nm as a
func-tion of scattering angle for an ice cloud of varying optical thickness overlaying a lower liquid water cloud of optical thickness 10.
In the case of relatively thin cirrus, the different sensitiv-ities of the three phase discrimination methods can provide useful information depending on the cirrus optical thickness. To evaluate our ability to detect a multilayered cloud situ-ation, we have simulated the different metrics used in our algorithm for an ice cloud of varying optical thickness (be-tween 0 and 10) overlying a lower-level liquid cloud layer of constant optical thickness (10). Figures 6, 7, 8 and 9 present respectively the simulated metrics used for polar-ization, shortwave infrared and thermal infrared based re-trievals.
Anadding-doubling code was used to compute polarized reflectances (De Haan et al., 1987) whereas an accurate Fast Discrete Ordinate Method (Dubuisson et al., 1996, 2005), which accounts for absorption and scattering, has been used for cloud radiance computations in all visible, shortwave in-frared and thermal inin-frared bands.
Polarized reflectances tend to saturate for optical thick-nesses greater than 2. For cirrus optical thickthick-nesses less than 2, the liquid cloud signature is still present in the polarized reflectances in the rainbow scattering angle region (around 140◦) as can be seen from Fig. 6.
For a cirrus optical thickness less than 1, the polarization signature will be classified as “liquid” by the POLDER stan-dalone algorithm. Between 1 and 2, the polarization signa-ture will be interpreted as a “mixed” or “undetermined” case; an optical thickness greater than 2 will yield “ice” phase. If the rainbow region is not sampled by the measurements, the “mixed” case can not be identified.
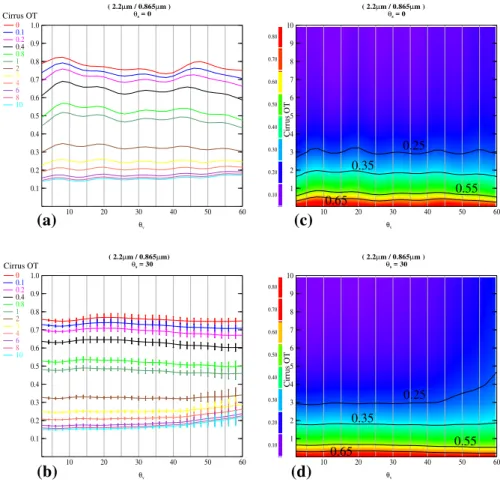
The situation is more complex with the SWIR/VIS metric since the respective contribution from absorption and scatter-ing will build up differently dependscatter-ing on the particle size of both the liquid and ice clouds. However, we can still evaluate approximate upper and lower limits of this metric by looking at an asymptotic regime of this ratio. Simulations are per-formed for two solar zenith angles (nadir and 30◦), 10 view zenith and 20 relative azimuth angles.
On Figs. 7a and b, the SWIR/VIS theoretical ratios are plotted for each cirrus optical thickness, as a function of viewing angle by averaging over relative azimuth angle. This was done to provide a crude estimate for the magnitude of variation one could expect from a set of realistic cloud con-ditions. If we consider the average ratio for pure liquid cloud (0.75 for cirrus optical thickness=0.) and allow a 0.1 (0.2) variation from this initial value, then we can see that when thin cirrusτ is less than 0.2 (0.5), the phase will be returned as liquid. Conversely, considering the thick ice cloud limit (0.15) and allowing an equivalent 0.1 (0.2) increase for the ratio would lead to a limit of cirrusτ of about 3.0 (2.0) above which a single-layered ice cloud can not be distinguished from a multilayered cloud scenario.
Another way to consider the problem is to consider the thresholds used for intermediate phase retrieval based on SWIR/VIS ratio. The thresholds have been set experimen-tally and result partially from the analysis of a large number of MODIS scenes during the validation and quality assess-ment phase of MODIS cloud optical properties collection 5 products. The PDF of the ratio values is divided into 5 re-gions using thresholds at 0.65, 0.55, 0.35 and 0.25, which correspond respectively to confident liquid, probably liquid, unknown, probably ice, and confident ice. These thresholds are demonstrated in Fig. 7c and d, where the SWIR/VIS the-oretical ratios are plotted on a surface as a function of both cirrusτ and viewing geometry. It can be seen from this that confident liquid (ice) will be assessed only if the overlaying cirrusτ is lower (greater) than 0.2 (3.0).
The reduced confidence thresholds occur respectively for liquid and ice at cirrus optical thicknesses of about 0.5 and 2. With this single criterion, a multilayered cloud situation consisting of ice over water clouds, in which the cirrus opti-cal thickness lies between 0.5 and 3, will most probably lead to a low confidence or undetermined phase. Note that these threshold values, derived from statistical analysis of real ob-servations, are consistent with those derived by allowing a 0.1 departure from pure liquid or ice theoretical ratio values. An important observation also is that this metric seems to present very limited dependance on viewing or solar geome-tries, which justify the applicability of fixed thresholds with respect to the observation geometry, and in consideration of other uncertainties linked to particle size, for example.
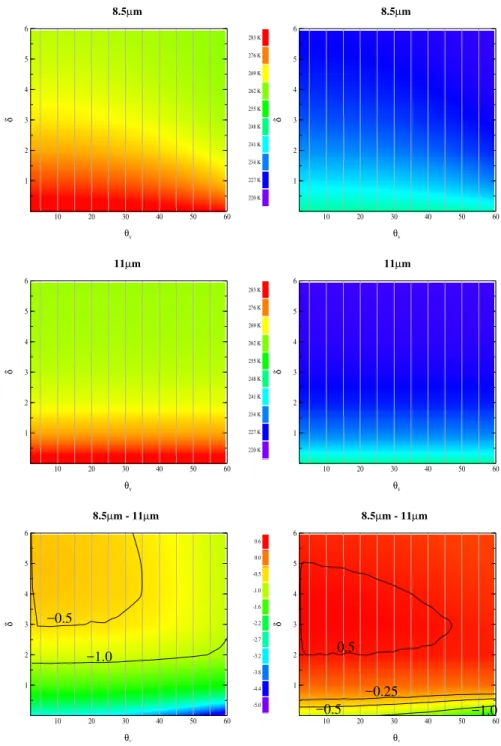
When the 11 µm brightness temperature is in the range of 238 K to 268 K where ice and supercooled liquid water can coexist, the bispectral IR algorithm is basically selecting the phase based on BTD[8.5–11] values using a set of thresh-olds at 0.5,−0.25 and−1.0 K, delimiting the regions ofIce,
Unknown,MixedandLiquid.
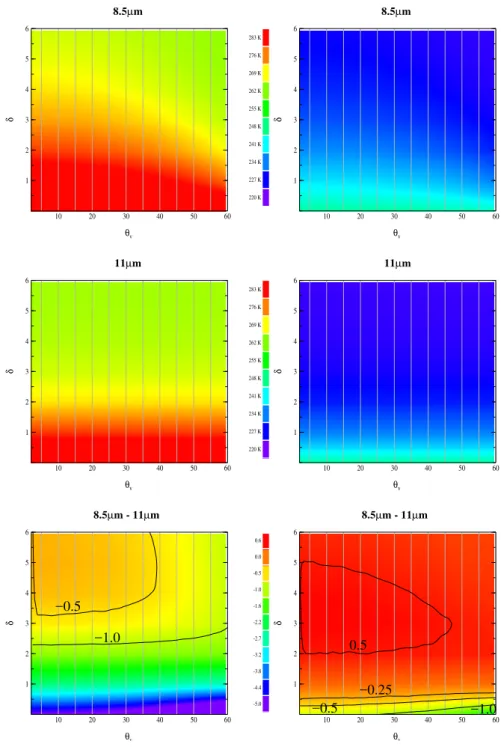
Figures 8 and 9 illustrate the sensitivity of BTD[8.5–11] to cirrus optical thickness and to atmospheric profile. Bright-ness temperatures at 8.5 and 11 µm depend strongly on each cloud layer altitude (temperature), particle size, water vapor profile, and surface emissivity. It is difficult to evaluate all possible combinations of atmospheric profile, cirrus altitude and optical thickness, and liquid cloud altitude. We have chosen to illustrate only a few problems using simulations performed with four distinct scenarios.
Two cases are considered in which the liquid cloud layer is located at either 5 km (Fig. 8) or 2 km (Fig. 9), with the cirrus cloud being kept at 10 km. For each case, two very different atmospheric profiles are considered (MidLatitude Summer, humid and warm; SubArctic Winter, dry and cold). Finally, the thresholds used for the IR phase retrieval are indicated on each of the BTD[8.5–11] figures.
A first observation is that the location of the lower liquid cloud has a moderate influence on the observed BTD[8.5– 11], but this influence is more pronounced (as expected) for the warm/humid profile. For the MidLatitude Summer pro-file, the cirrus temperature is set at about 248 K. From the corresponding BTD[8.5–11] diagrams on Figs. 8 and 9, it seems that all situations will be declared Liquid for cirrus
τ up to about 2.0 and will then be declaredMixed or
Un-knowndepending on the value of the cirrusτ. This clearly
( 2.2µm / 0.865µm )
θs = 0
0.1 0.2 0.3 0.4 0.5 0.6 0.7 0.8 0.9 1.0
10 20 30 40 50 60
θv 0
0.1 0.2
0.4 0.8
1
2
3
4 6
8
10
( 2.2µm / 0.865µm)
θs = 30
0.1 0.2 0.3 0.4 0.5 0.6 0.7 0.8 0.9 1.0
10 20 30 40 50 60
θv 0
0.1 0.2
0.4 0.8
1
2
3
4 6
8
10
0.10 0.20 0.30 0.40 0.50 0.60 0.70 0.80
( 2.2µm / 0.865µm )
θs = 0
1 2 3 4 5 6 7 8 9 10
10 20 30 40 50 60
θv
0.10 0.20 0.30 0.40 0.50 0.60 0.70 0.80
( 2.2µm / 0.865µm )
θs = 30
1 2 3 4 5 6 7 8 9 10
10 20 30 40 50 60
θv 0.25
0.35
0.65 0.35
0.65 0.55
0.55 0.25
Cirrus OT
Cirrus OT
Cirrus OT Cirrus OT
(b)
(d)
(a)
(c)
Fig. 7.Simulation for different geometries of the 2.1 µm to 865 nm reflectance ratio for an ice cloud of varying optical thickness overlaying
a lower liquid water cloud of optical thickness 10. Panels(a)and(b)present the simulated ratio for different cirrus optical thickness as a function of viewing angle. Results are averaged over relative azimuth and standard deviations are indicated using error bars. Panels(c) and(d)present the same results as a surface contour of simulated ratio, function of viewing angle and cirrus optical thickness. The latter representation is used to better illustrate the different regions defined by the SWIR vs. VIS/NIR reflectance thresholds used in our algorithm.
For additional discussion about the sensitivity of BT11 and BTD[8.5–11] we suggest reading, among others, the studies from Baum et al. (2000), Strabala et al. (1994) and Baum et al. (2003).
This sensitivity study is obviously limited but clearly illus-trates again the difficulty of dealing with supercooled and/or multilayer clouds. However, we have shown that the polar-ization, SWIR/VIS and TIR metrics will behave quite differ-ently in these situations, providing potential information to identify multilayer situations as shown by Nasiri and Baum (2004) using MODIS data only. The identification of multi-layer situations in case ofMixedphase (as determined by our multisensors algorithm) will be done a posteriori by combin-ing the phase index with other information such as different cloud pressure retrievals or observations from active sensors.
4.4 Mixed phase
Mixed phase clouds are obviously problematic and therefore of primary interest for our current investigation. When liq-uid spherical droplets coexist with ice particles, we anticipate that high absorption by ice will show up in the SWIR band and also that BTD[8.5–11] may indicate eithermixedor
un-determinedphase.
However, spherical particles can produce a rainbow fea-ture that will toggle aliquidphase detection in the polariza-tion test. Opposing decisions from the SWIR/VIS and polar-ization tests, withmixedorundeterminedphase from the IR test, will lead to confidentmixedphase in the final index.
8.5µm
1 2 3 4 5 6
δ
10 20 30 40 50 60
θv
11µm
1 2 3 4 5 6
δ
10 20 30 40 50 60
θv
8.5µm - 11µm
1 2 3 4 5 6
δ
10 20 30 40 50 60
θv
220 K 227 K 234 K 241 K 248 K 255 K 262 K 269 K 276 K 283 K
8.5µm
1 2 3 4 5 6
δ
10 20 30 40 50 60
θv
220 K 227 K 234 K 241 K 248 K 255 K 262 K 269 K 276 K 283 K
11µm
1 2 3 4 5 6
δ
10 20 30 40 50 60
θv
-5.0 -4.4 -3.8 -3.2 -2.7 -2.2 -1.6 -1.0 -0.5 0.0 0.6
8.5µm - 11µm
1 2 3 4 5 6
δ
10 20 30 40 50 60
θv −0.5
−1.0 0.5
−0.25
−0.5 −1.0
Fig. 8. Simulation for aMid-Latitude Summer (left) and a Sub-Arctic Winter (right) atmospheric profile of the brightness temperature
differences (in Kelvin) between channel at 8.5 and 11 µm as a function of view angle for an ice cloud of varying optical thickness at 10 km overlaying a lower liquid water cloud of optical thickness 10, located at 5 km. Isolines correspond to the thresholds used in the bispectral IR phase determination.
and MODIS to help detect the presence of multilayer clouds. Also, the multilayer flag product available from MODIS MYD06 cloud product can provide some information and is under investigation, being a new product. Both will obvi-ously require validation from the active lidar in the A-Train.
4.5 Snow and sea ice
8.5µm
1 2 3 4 5 6
δ
10 20 30 40 50 60
θv
11µm
1 2 3 4 5 6
δ
10 20 30 40 50 60
θv
8.5µm - 11µm
1 2 3 4 5 6
δ
10 20 30 40 50 60
θv
220 K 227 K 234 K 241 K 248 K 255 K 262 K 269 K 276 K 283 K
8.5µm
1 2 3 4 5 6
δ
10 20 30 40 50 60
θv
220 K 227 K 234 K 241 K 248 K 255 K 262 K 269 K 276 K 283 K
11µm
1 2 3 4 5 6
δ
10 20 30 40 50 60
θv
-5.0 -4.4 -3.8 -3.2 -2.7 -2.2 -1.6 -1.0 -0.5 0.0 0.6
8.5µm - 11µm
1 2 3 4 5 6
δ
10 20 30 40 50 60
θv −0.5
−1.0 0.5
−0.25
−0.5 −1.0
Fig. 9.Same as Fig. 8 but liquid cloud is located at 2 km.
identification of relatively thin clouds by these two
tech-niques.
For the SWIR technique, the situation will be mostly prob-lematic in case of thin liquid clouds. The strong absorption by the surface tend to bias the SWIR/VIS ratio toward ice signature for all cases and results in either ambiguous or er-roneous phase detection only for liquid clouds.
Regarding the bispectral IR technique, the situation is more complex as it depends on both surface temperature and temperature and water vapor profiles. However, snow
sur-faces under clear sky conditions tend to present large nega-tive values of BTD[8.5–11] and therefore would be declared as liquid by the current IR algorithm. In this case, an erro-neous or ambiguous phase decision could be made for thin cirrus with optical thickness smaller than 0.5.
Overall, the merged phase index will depend primarily on whether or not the rainbow can be observed and detected by POLDER which would be the case if observation geometry permits and cloud optical thickness is greater than 0.5.
Thin clouds with optical thickness smaller than 0.5 will therefore constitute a challenge for the phase detection if
the cloud can be detected in a first place. The problem
of snow/sea ice will require further analysis using CALIOP observation to evaluate thin clouds detection skills over snow/sea ice and the associated phase decisions.
5 Case study analysis and discussion
The case study selected to illustrate the present approach in-cludes Typhoon Nabi on 2 September 2005 (Fig. 1). This portion of a PARASOL orbit was selected due to the pres-ence of a typhoon over ocean and a large cloud system over land. Both scenes contain both optically thin and thick clouds at different levels, thus providing an a priori complex case for which individual phase retrieval methods might provide am-biguous information.
We discuss hereafter particular cloud situations available from this case study. For each, results for individual phase discrimination tests are discussed, as well as how each test contributes to the final decision. The final decision takes into account the limitations and advantages of each method. 5.1 Midlevel clouds
The cloud system in the northern part of Fig. 1 provides a very good example of a midlevel cloud layer as can been observed from the Oxygen cloud apparent pressure retrieval (Vanbauce et al., 1998, 2003) on Fig. 10b. Most of these clouds have temperatures between 238 K and 268 K where ice and supercooled liquid water can coexist. Figure 3 shows that a significant portion of the cloud system indicates an am-biguous signal for the SWIR/VIS metric that is thought to be associated with large liquid particles since both polarization and TIR tests agree onLiquidphase. The ice cloud part of the cloud system is retrieved fairly coherently in all three meth-ods leading to high confidence ice in the final retrieval shown in Fig. 10a.
Finally, the pixels declared as Mixed phase by the TIR method are given a lower confidenceLiquidflag in the polar-ization test and theUnknownflag from the SWIR/VIS test. As can be seen from the O2A-band pressure retrieval, those
Mixedphase pixels have a slightly higher altitude than some
surrounding high confidenceIce pixels, perhaps indicating a multilayer cloud situation. This will be further evaluated using active sensors in future work.
5.2 Typhoon scene
Investigation of a portion of Typhoon Nabi in the southern part of Fig. 1 provides further insight as to how the three
Unknown
(a) (b)
LIQUID MIXED ICE
1050 hPa 750 hPa 450 hPa 150 hPa
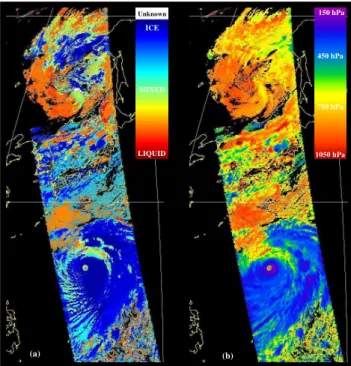
Fig. 10. (a)Results of the final cloud phase index retrieved from a
combination of POLDER and MODIS data.(b)Cloud top pressure derived from POLDER oxygen A-Band method.
methods can provide a very different perspective of a given situation.
The top of the typhoon is located very high in the atmo-sphere and whether it is optically thick or not does not make much difference in the TIR retrieval, indicating a large extent of the cirrus cloud layer (Fig. 3c). The situation is more am-biguous again with the SWIR/VIS metric (Fig. 3b), which turns rapidly from confident Ice about the center of Nabi
toUnknownwithout seeing very many lower confidenceIce
pixels.
5.3 Final phase index
Figure 10a presents the final results of our joint
POLDER/MODIS algorithm together with the cloud
pressure derived from OxygenA-Band (Fig. 10b). At this
stage, we can comment on two facts. First, the cloud phase index presents fairly smooth variation indicating that the logical decision tree does not yield unstable situations where we would randomly switch between confident ice and confident liquid. Secondly, the phase index behaves fairly coherently compared to cloud O2pressure even if this information is not involved in the phase retrieval process. Overall, and before a thorough validation is performed using active sensors, we conclude from this case study (and others, not shown/discussed here) that our proposed method provides new and relevant information on cloud thermodynamic phase and to a lesser extent on the vertical structure of cloud layers.
6 Conclusions
With the use of coincident data available from POLDER3/Parasol and MODIS/Aqua, three indepen-dent methods for deriving cloud phase have been applied singly and in combination. It is shown that these methods can provide different information for a single-layered cloud due to their respective sensitivity to different parameters. For unambiguous cases where all three methods provide the same answer individually, the combination is still useful since it can be used to assess the confidence level of the phase retrieval. For cases where the three methods disagree, an attempt is made to interpret the differences in terms of multilayer clouds and/or single-layered mixed phase clouds. Validation of the retrieved joint product is outside the scope of this paper but we can expect the combination of well evaluated methods to provide at least an equally accu-rate product. The value added by the synergy of POLDER and MODIS relies mainly in (i) the semi continuous phase in-dex which values can be interpreted in terms of confidence in the retrieval, (ii) the potential to clearly identify mixed phase cases and (iii) to a lesser extent, the possibility of determin-ing an index for almost every pixel that uses the strengths of each method.
In future research, a thorough analysis of the full joint dataset provided by POLDER3/Parasol and MODIS/Aqua will provide statistics of this new product. Obviously, with the availability of CloudSat and CALIPSO, it is expected that a large validation dataset containing vertical profile informa-tion will help us in evaluating the statistical meaningfulness of each class of the decision look-up table.
If a reasonable correlation between radar/lidar data and the phase index can be demonstrated in case of multilayer or mixed phase clouds, the POLDER/MODIS combination will prove extremely useful to extend the vertical
informa-tion from the active instruments to the full swath covered by the passive instruments of the A-Train.
Finally, this work demonstrates the interest for a sensor which could provide both multiangle, polarization and ex-tended multispectral observations. In a near future, this method could be adapted to observations from the Glory mis-sion before a next generation spectropolarimeter can be de-veloped and launched.
Acknowledgements. The authors are very grateful to CNES and
NASA for providing the POLDER and MODIS data. Cecile Oudard and Francois Thieuleux were supported by University of Lille, region Nord-Pas-de-Calais, CNRS and CNES, in the frame-work of the ICARE project. This research project was supported by CNES and the Programme National de Teledetection Spatial. Finally, the authors would like to acknowledge the two reviewers for their numerous comments and help in improving the manuscript.
Edited by: T. Garrett
The publication of this article is financed by CNRS-INSU.
References
Baran, A. J. and C.-Labonnote, L. : On the reflection and polariza-tion properties of ice cloud, J. Quant. Spectrosc. Ra., 100, 41–54, 2006.
Baum, B. A., Soulen, P. F., Strabala, K. I., King, M. D., Ack-erman, S. A., Menzel, W. P., and Yang, P.: Remote sensing of cloud properties using MODIS airborne simulator imagery during SUCCESS: 2. Cloud thermodynamic phase, J. Geophys. Res., 105, 11781–11792, 2000.
Baum, B. A., Frey, R. A., Mace, G. G., Harkey, M. K., and Yang, P.: Nighttime multilayered cloud detection using MODIS and ARM data, J. Appl. Meteor., 42, 905–919, 2003.
Baum, B. A., Heymsfield, A. J., Yang, P., and Bedka, S. T.: Bulk scattering models for the remote sensing of ice clouds. Part 1: Microphysical data and models, J. Appl. Meteor., 44, 1885– 1895, 2005a.
Baum, B. A., Yang, P., Heymsfield, A. J., Platnick, S., King, M. D., Hu, Y.-X., and Bedka, S. T.: Bulk scattering models for the re-mote sensing of ice clouds. Part 2: Narrowband models, J. Appl. Meteor., 44, 1896–1911, 2005b.
Br´eon, F. M. and Goloub, P.: Cloud droplet effective radius from spaceborne polarization measurements, Geophys. Res. Lett., 25, 1879–1882, 1998.
De Haan, J. F., Bosma, P. B., and Hovenier, J. W.: The adding method for multiple scattering calculations of polarized light, Astron. Astrophys., 183, 371–391, 1987.
Dubuisson, P., Buriez,J.-C., and Fouquart, Y.: High spectral reso-lution solar radiative transfer in absorbing and scattering media application to the Satellite Simulation, J. Quant. Spectrosc. Ra., 55, 103–126, 1996.
Dubuisson, P., Giraud, V., Chomette, O., Chepfer, H., and Pelon, J.: Fast radiative transfer modeling for infrared imaging radiometry, J. Quant. Spectrosc. Ra., 95, 201–220, 2005.
Goloub, P., Herman, M., Chepfer, H., Riedi, J., Brogniez, G., Cou-vert, P., and S´eze, G.: Cloud Thermodynamical Phase Classifi-cation from the POLDER Spaceborne instrument, J. Geophys. Res., 105, 14747–14759, 2000.
Hahn, C. J., Warren, S. G., London, J., Chervin, R. M., and Jenne, R.: Atlas of simultaneous occurrence of different cloud types over the ocean, NCAR Tech. Note TN-201 STR, 212 pp., 1982. Hahn, C. J., Warren, S. G., London, J., Chervin, R. M., and Jenne,
R.: Atlas of simultaneous occurrence of different cloud types over land, NCAR Tech. Note TN-241 STR, 209 pp., 1984. Hutchison, K. D., Etherton, B. J., Topping, P. C., and Huang, H. L.:
Cloud top phase determination from the fusion of signatures in daytime AVHRR imagery and HIRS data, Int. J. Remote Sens., 18, 3245–3262, 1997.
Key, J. and Intrieri, J.: Cloud particle phase determination with the AVHRR, J. Appl. Meteorol., 39, 1797–1805, 2000.
King, M. D., Platnick, S., Yang, P., Arnold, G. T., Gray, M. A., Riedi, J. C., Ackerman, S. A., and Liou, K. N.: Remote sens-ing of liquid water and ice cloud optical thickness, and effective radius in the arctic: Application of airborne multispectral MAS data, J. Atmos. Ocean. Tech., 21, 857–875, 2004.
Knap, W., Stammes, P., and Koelemeijer, R. B. A.: Cloud ther-modynamic phase determination from near-infrared spectra of reflected sunlight, J. Atmos. Sci., 59, 83–96, 2002.
C.-Labonnote, L., Brogniez, G., Buriez, J. C., Doutriaux-Boucher, M., Gayet, J. F., and Macke, A.: Polarized light scattering by in-homogeneous hexagonal monocrystals. Validation with ADEOS-POLDER measurements, J. Geophys. Res., 106, 12139–12153, 2001.
Lee, J., Yang, P., Dessler, A. E., Baum, B. A., and Platnick, S.: The influence of thermodynamic phase on the retrieval of mixed-phase cloud microphysical and optical properties in the visible and near-infrared region, IEEE Trans. Geoscience and Remote Sensing Letters, 3, 287–291, 2006.
Moody, E. G., King, M. D., Platnick, S., Schaaf, C. B., and Gao, F.: Spatially complete global spectral surface albedos: Value-added datasets derived from Terra MODIS land products, IEEE T. Geosci. Remote, 43, 144–158, 2005.
Nasiri, S. L. and Baum, B. A.: Daytime multilayered cloud detec-tion using multispectral imager data, J. Atmos. Ocean. Tech., 21, 1145–1155, 2004.
Parol, P., Buriez, J. C., Vanbauce, C., Riedi, J., Labonnote, L. C., Doutriaux-Boucher, M., Vesperini, M., S`eze, G., Couvert, P., Vi-ollier, M., and Br’eon, F. M.: Capabilities of multi-angle po-larization cloud measurements from satellite: POLDER results, Adv. Space Res., 33, 1080–1088, 2004.
Pavolonis, M. J. and Heidinger, A. K. Daytime cloud overlap detec-tion from AVHRR and VIIRS, J. Appl. Meteorol., 43, 762–778, 2004.
Pavolonis, M. J., Heidinger, A. K., and Uttal, T.: Daytime global cloud typing from AVHRR and VIIRS: Algorithm description, validation, and comparisons, J. Appl. Meteorol., 44, 804–826, 2005.
Pilewskie, P. and Twomey, S.: Cloud phase discrimination by re-flectance measurements near 1.6 and 2.2 µm, J. Atmos. Sci., 44, 3410–3420, 1987.
Platnick, S., King, M. D., Ackerman, S. A., Menzel, W. P., Baum, B. A., Riedi, J., and Frey, R. A.: The MODIS Cloud Products : Algorithms and Examples from Terra, IEEE T. Geosci. Remote, 41, 459–473, 2003.
Riedi, J.: Analysis of cloud thermodynamic phase at global scale using polarimetric multiangle measurements from the POLDER1/ADEOS1, Ph.D. thesis, Laboratoire d’Optique At-mosph´erique, Universit´e des Sciences et Technologies de Lille, 2001.
Riedi, J., Goloub, P., and Marchand, R. T.: Comparison of POLDER cloud phase retrievals to active remote sensors mea-surements at the ARM SGP site, Geophys. Res. Lett., 28, 2185– 2188, 2001.
Seemann, S. W., Borbas, E. E., Knuteson, R. O., Stephenson, G. R., and Huang, H.-L.: Development of a Global Infrared Land Sur-face Emissivity Database for Application to Clear Sky Sounding Retrievals from Multi-spectral Satellite Radiance Measurements, J. Appl. Meteor. Climatol., 47, 108–123, 2008.
Strabala, K. I., Ackerman, S. A., and Menzel, W. P.: Cloud Proper-ties inferred from 8–12-µm Data, J. Appl. Meteor., 33, 212–229, 1994.
Takano, Y., Liou, K. N., and Minnis, P.: The Effects of Small Ice Crystals on Cirrus Infrared Radiative Properties, J. Atmos. Sci., 49, 1487–1493, 1992.
Tian, L. and Curry, J. A.: Cloud overlap statistics, J. Geophys. Res., 94, 9925–9935, 1989.
Tremblay, A. and Glazer, A.: An Improved Modeling Scheme for Freezing Precipitation Forecasts, Mon. Weather Rev., 128(5), 1289–1308, 2000.
Vanbauce, C., Buriez, J. C., Parol, F., Bonnel, B., S`eze, G., and Couvert, P.: Apparent pressure derived from ADEOS-POLDER observations in the oxygen A-band over ocean, Geophys. Res. Lett., 25, 3159–3162, 1998.
Vanbauce, C., Cadet, B., and Marchand, R. T.: Compari-son of POLDER apparent and corrected oxygen pressure to ARM/MMCR cloud boundary pressures, Geophys. Res. Lett., 30, 16.1–16.4, 2003.