Synthesis of Carbon Nanostructures by Using
Thermal Plasma Torch
M. Pacheco
1J. Pacheco
1,2,∗, M. Valdivia
2, L. Bernal
2, R. Valdivia
2,
A. Huczko
3, H. Lange
3, A. Cruz
1, and R. L´opez-Callejas
1 ,21
Instituto Nacional de Investigaciones Nucleares, Apartado Postal 18-1027, Col. Escand ´on,
C.P. 11801, M´exico D.F., M´exico
2
Instituto Tecnol´ogico de Toluca, Apartado Postal 890, Toluca, M´exico
3
Department of Chemistry, Warsaw University, Pasteur 1, 02-093 Warsaw, Poland
Received on 30 January, 2004; revised version received on 6 May, 2004
Some recent results concerning the synthesis of carbon nanostructures in a thermal plasma generating by a plasma torch are presented. Several tests were carried out in different operational conditions. The plasma was formed with argon and different gas mixtures of argon-acetylene or argon-methane to which some catalyst materials (ferrocene and cerium oxide) were added. These catalysts were introduced into the plasma in a solid (powder) or/and a gaseous state. Their feeding rate into the plasma jet was fixed along with some other operating conditions such as plasma power, gas flow rate and reactor pressure. The principal main feature observed was a short reaction time so that each test lasted for no longer than 5 minutes. The solid products obtained were collected and prepared for following analyses. The products were examined using XRD and TEM techniques in order to characterize the morphological structure of their samples. The spatial distribution of temperature in the plasma was evaluated by in-situ emission spectroscopy. The self-absorption was taken into account by simulating an integrated radiation in relation to the Swan bandd3
Πg−→a3Πu(0,0), emitted by the C2radical.
Also, the exhaust gases were characterized by gas chromatography during each test.
1
Introduction
Since their discovery in 1991 [1], carbon nanotubes (CNTs) have been immediately recognized by the whole scientific community as a new material with unique mechanical and electronic properties. The controlled production of CNTs could open the way to vast applications. In fact, the uses of carbon nanostructures are numerous and increase day after day. Among their potential applications, one can mention hydrogen storage, the reinforcement of composites with ce-ramic and polymer matrices, the development of specialized lamps and flat panels, etc. [2-5].
There exist several techniques of nanocarbon produc-tion, and particularly of carbon nanotubes. The laser abla-tion [6-10] and the electric arc [11-13] are considered to be among the best, due to a relatively high yield of nanotubes with few defects in their structure, in comparison with the product synthesized by, for instance, the catalytic vapor de-position (CVD) technique [14]. However, the cost of pro-ducing carbon nanostructures still remains high, mostly be-cause the first two processes mentioned above are neither continuous nor scalable. Thus, new methods to synthe-size different nanocarbons are urgently sought after. The aim of this work has been to produce carbon nanostructures in a thermal plasma jet using a plasma torch, where gases (methane, acetylene) or liquids (benzene) rich in carbon, as well as some catalysts (ferrocene, nickel, yttrium) necessary
for the nanostructure growth are continuously fed.
D. Harbec et al [15,16] use a plasma torch technique withC2Cl4 as a carbon precursor and a very high power
supply (100kW). Nevertheless, the nanotube production ra-tes remain low. H. Takikawa et al [17] have proposed a torch arc in open air in order to produce carbon nanotubes and na-nohorns. The carbon yield in the deposit seems to be consi-derably lower than that in the soot, prepared in a conventio-nal low-pressure arc.
In the present paper we report a study on the plasma torch parameters, the nature of catalysts and the characte-rization (XRD, TEM) and formation of carbon nanostruc-tures. The knowledge of the basic plasma phenomena and their effect on the nanostructure formation has been rather limited so far. Thus, we have also decided to characte-rize the plasma by emission spectroscopy in order to deter-mine whether the results could be related to the variations in plasma characteristics such as temperature and their effect on the type of nanostructure.
2
Experimental
TABLE 1. Characteristics of reactants and process features
Gas Catalist(s) Observations
None (C5H5)2F e(2.93g) Only ferrocene was introduced into the plasma
CH4(0.941) (C5H5)2F e(1.96g) A great quantity of soot obtained, but the powder feeding was not
continuous
C2H2(0.51) (C5H5)2F e(1.16g) More soot was obtained vis--vis the conditions mentioned before;
powder feeding still presents the same problem
C2H2(0.121) N i+CeO2(0.07g) The mixture of nickel and cerium oxide promotes the carbon
nano-tubes production in the electric arc technique
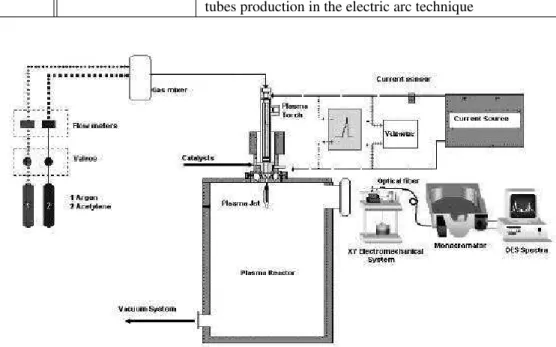
Figure 1. Plasma reactor
Figure 1. Plasma reactor.
and a special valve. The DC current can be adjusted from 60 up to 150 A. The plasma reactor (Fig. 1) was also provided with a special port intended for OES measurements. The ra-diation emitted by the plasma was focused by a convergent lens towards the entry slit of the 320 mm focal length mo-nochromator endowed with a 1800 grooves/mm holographic grating and a CCD detector (122 x 1024 pixels). The gene-ral spatial resolution turned out to be 0.06nm. The spectra for different intensity ranges and wavelengths could be ob-tained by means of somead hocsoftware [18]. The optical signal of the plasma was guided by an optic fiber mounted on a XY electromechanical system [19] so to achieve a ver-tical and horizontal scanning of the plasma with very precise incremental steps (0.1mm).
All the experiments were performed under stable opera-tional conditions at an 80 A arc current. Argon was used as a plasma gas with 100 kPa pressure and a 15 l/min flow rate. Different mixtures of reactants (as shown in Table 1) containing gases (methane or acetylene) and catalysts (fer-rocene, cerium oxide and nickel) were introduced into the argon plasma. Feed rates of catalysts and hydrocarbon gas were maintained constant at about 0.1g/min and 0.1 l/min respectively.
3
Results and discussion
Optical emission spectroscopy (OES) technique was used to determine the excitation and rotation temperatures in terms of atomic lines (ArI) and rotational lines (C2 Swan band).
These temperatures have already been discussed within the frame of nanocarbon morphology. The solid products were analyzed by high resolution transmission electron (HTEM), and scanning electron microscopy (SEM). The XRD techni-que completed this study by determining whether the struc-ture of the product was either amorphous or crystalline. In order to measure the quantity of carbon leaving the reac-tor, the exhaust gases were characterized by gas chromato-graphy during each test.
3.1
OES Measurements
were carried out within a 640ms integration time of the de-tection system.
3.2
Rotational temperature
The optical radiation from a plasma containing carbon is mainly associated with the Swan band system,d3
Πg −→ a3
Πu(0,0), emitted by C2radicals. The band is often
af-fected by the self absorption phenomenon, particularly un-der conditions favoring carbon nanostructures (dense carbon vapors). The self-absorption influencing the intensity dis-tribution in the rotational structure has often been used for temperature evaluation. The method is explained in detail elsewhere [20-22]. The C2Swan band is located from 513.1
to 516.3nm wavelengths. The maximal values are obtained at the central axis. The radial scan of the 5mm diameter plasma jet was obtained during the catalyst injection. This scan was performed at 10mm from the torch nozzle, where the maximal intensities of C2radicals were located.
3.3
Temperature of excitation
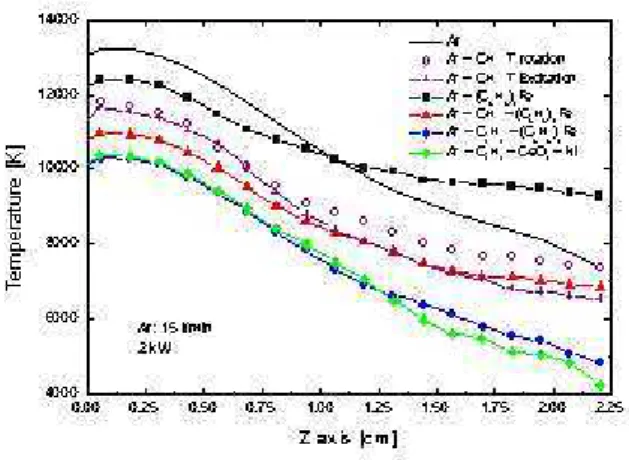
When pure argon is used as a plasma gas, the Boltzmann diagram method can be applied in order to calculate the temperature, based on several lines (430.01nm, 675.28nm, 696.5nm, 706.72nm, 727.29nm). We report in figure 2, both the rotational (for hydrocarbons-catalysts mixtures) and the excitation (for pureArandAr−CH4) temperatures found
in thezaxis plasma jet. Such temperatures were obtained for a mixture ofAr−CH4. We can assume the existence
of a local thermodynamic equilibrium atz < 1cm (figure 2) as the temperatures of rotation and excitation remain very close (less than 3%).
In Fig. 2, we can observe that temperature gradients are smaller when ferrocene and methane/ferrocene are present in the plasma. A temperature decrease and drastic tempe-rature profiles are observed whenC2H2are introduced. In
this case, higher quantities of soot are produced (for equal experimental times) while the amount of nanostructures is almost non existent. Instead, amorphous carbon (AC) and poorly organized polyaromatic amorphous carbon (POPAC) are the predominant structures, as we will see below.
3.4
XRD and TEM analysis
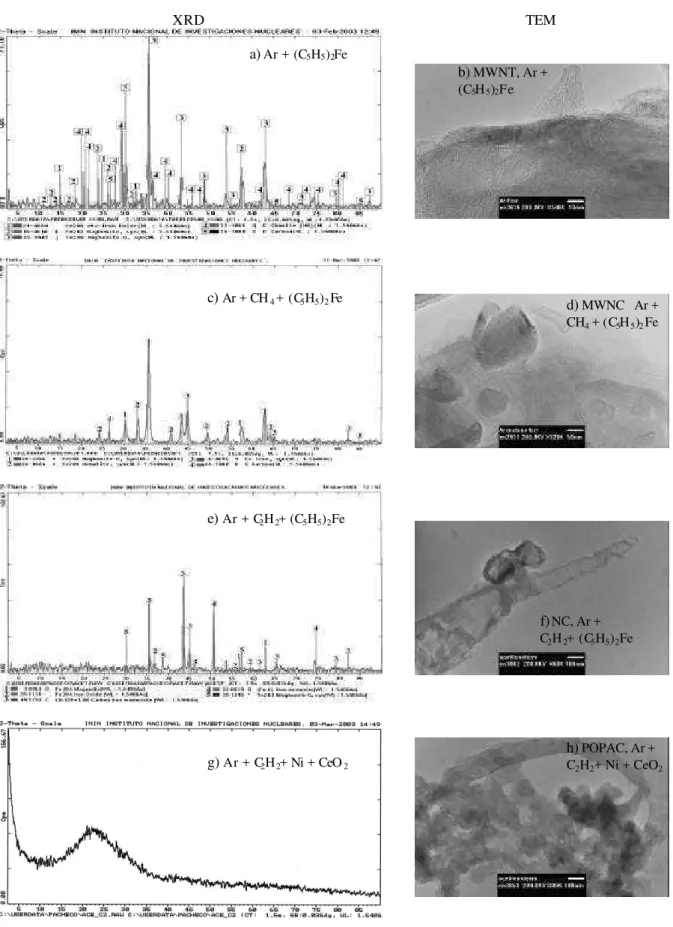
The XRD analysis was performed to determine whether crystalline phases exist in the samples. By comparing re-sults from XRD and TEM (Fig. 3) we can observe that an XRD rich spectra correspond to a well organized carbon na-nostructure (Figs. 3a, 3c, 3e), whereas a spectra with no lines signifies that carbon nanostructures are almost absent in the sample (Fig. 3g).
Results from TEM (Figs. 3d, 3f, 3h) show that synthe-sis of multiwalled nanotubes becomes characteristic when only ferrocene is added (Fig. 3b). When ferrocene and methane are used, the formation of multiwalled nanocap-sules is enhanced (Fig. 3d). When acetylene and ferrocene are added, only a few nanocapsules are obtained (Fig. 3f) and, in the case of acetylene and nickel with cerium oxide, no nanostructures were found.
Figure 2. Temperature profiles.
3.5
Gas Chromatography analysis
Exhaust gas chromatography analyses were performed for each experimental condition in order to determine the quan-tity and composition of these gases. The results provided valuable information about the mass balance and helped ve-rify the quantity of C that remained in the reactor (Table 2). By correlating these results with the nanostructures obtai-ned, we can show that the nanostructures have been prefera-bly formed when the ratio carbon/catalysts was about 91.5% at / 8.5% at.
TABLE 2. Carbon and catalysts concentration in the produced soot
Mixture Carbon % at Catalyst % at
Ar+ (C5H5)2F e 91.3 8.7
Ar+CH4+ (C5H5)2F e 91.7 8.3
Ar+C2H2+ (C5H5)2F e 93.04 6.96
Ar+C2H2+CeO2+N i 97.62 2.38
4
Conclusions
It is found that carbon nanostructures were best formed when the atomic ratio carbon/catalysts was about 91.5%at / 8.5%at. Also the plasma, under such conditions, became more uniform. Apparently by diminishing temperature gra-dients in the plasma and using the above mentioned ratio carbon/catalysts, the synthesis of carbon nanostructures tur-ned to be more efficient (Ar + (C5H5)Fe and Ar + CH4 +
(C5H5)Fe). Similar results were obtained by using an
XRD TEM a) Ar + (C5H5)2Fe
b) MWNT, Ar + (C5H5)2Fe
c) Ar + CH4 + (C5H5)2Fe d) MWNC Ar +
CH4 + (C5H5)2Fe
e) Ar + C2H2+ (C5H5)2Fe
f) NC, Ar + C2H2+ (C5H5)2Fe
g) Ar + C2H2+ Ni + CeO2
h) POPAC, Ar + C2H2+ Ni + CeO2
Figure 3. XRD and TEM results: a) and b) Ar + (C5H5)2Fe; c) and d) Ar + CH4+ (C5H5)2Fe; e) and f) Ar + C2H2+ (C5H5)2Fe; g) and h)
Ar + C2H2+ Ni + CeO2. Abbreviations: MWNT -multiwalled nanotube; MWNC -multiwalled nanocapsule; POPAC -poorly organized
Acknowledgements
The supports obtained from CONACyT (contract 33424-U), ECOS/ANUIES (contract MOO-P04), and COSNET (contracts 619.02PR and 630.03) are gratefully acknowledged. The study was partially supported by the Committee for Scientific Research (KBN) through the Department of Chemistry, Warsaw University, under contract 4 T08D 021 23.
References
[1] S. Iijima, Nature354, 54 (1991).
[2] L. Allemand, La Recherche332, 55 (2000).
[3] A. Chatelain, J. M Bonnard, Le Temps strat´egique 81, Gen`eve, (mai-juin 1998).
[4] P. Collins, P. Avouris, Pour la Science280, 76 (2001). [5] P. Poncharal et al. Science,283, 1513 (1999). cit´e ´a La
re-cherche320, 19 (1999).
[6] T. Guo, P. Nikolaev, A. G. Rinzler, D. Tomanek, D.T. Colbert, and R. E. Smalley, J. Phys. Chem.99, 10694 (1995). [7] T. Guo, P. Nikolaev, A. Thess, D. T. Colbert, and R. E.
Smal-ley, Chem. Phys. Lett.243, 49 (1995).
[8] A. Thess, R. Lee, P. Nicolaev, H . Dai, P. Petit, J. Robert, C. Xu, Y. H. Lee, S. G. Kim, D. T. Colbert, G. Scuseria, D. Tomanek, J. E. Fischer, and R. E. Smalley, Science273, 487 (1996).
[9] W. K. Masser, E. Munoz, A. M. Benito, M. T. Martinez, G. F. de la Fuente, A. Righi, and J. L. Sauvagol, Chem. Phys. Lett, 292, 587 (1998).
[10] A. G. Rinzler, J. Liu, H. Dai, P. Nikolaev, C. B. Huffman, F. J. Rodriguez-Macias. P. J. Boul, A. H. Lu, D. Heymann, D. T. Colbert, R. E. Smalley, S. J. Tans, and C. Dekker, Nature 385, 781 (1997).
[11] C. Journet, W. K. Maser, P. Bernier, A. Loiseau M. Lamy de la Chapelle, S. Lefrant, P. Deniard, R. Lee, and J. E. Fisher, Nature,388, 756 (1997).
[12] M. Pacheco, M. Monthioux, M. Caprais, H. Allouche, M. Ra-zafinimanana, and A. Gleizes “New data about the formation of SWNTs by the electric arc method” XVIth International Winterschool on Electronic Properties of Novel Materials, 2-9 mars 2002, Kirchberg.
[13] M. Pacheco, M. Monthioux, H. Allouche, M. Razafinima-nana, A. Gleizes, and N. Caprais, “New factors control-ling the formation of single-wall carbon nanotubes by arc plasma”, CARBON 2002, 15-20, September 2002, Beijing.
[14] M. J. Yacaman, M. M. Yoshida, L. Rendon, and J. G. Santi-esteban, Appl. Phys. Lett.62, 202 (1993).
[15] D. Harbec, J.-L. Meunier, L. Guo, and R. Gauvin, 15th Inter-national Symposium on Plasma Chemistry, Orleans France, pp 2757-2762, (9-13 July 2001).
[16] D. Harbec, J.-L. Meunier, and U. S. Patent Appl. Number 60/426, 407 (2002).
[17] H. Takikawa,, M. Ikeda, K. Hirahara, Y. Hibi, Y. Tao, P. A. Ruiz Jr., T. Sakakibara, S. Itoh, and S. Iijima, Physica B323, 277 (2002).
[18] SA1400, Hamamatsu software for card and program SA1400, Version 3.0 (1999).
[19] Joel Mart´ınez Adame, “Determination of spectral lines of H2
and C by using CCD detector”, Electronic Engineering The-sis, Instituto Tecnol´ogico de Toluca, Mexico, (2002).
[20] H. Lange, A. Huczko, M. Sioda, M. Pacheco, M. Razafini-manana, and A. Gleizes “On self absorption method for de-termination of C2 in carbon ac plasma”. Progress in Plasma
Processing of Materials, P. Fauchais editeur, Begell House Inc. (2002).
[21] M. Pacheco, M. Monthioux, M. Caprais, H. Allouche, M. Razafinimanana, and A. Gleizes, (2002) “New data about the formation of SWNTs by the electric arc method” XVIth In-ternational Winterschool on Electronic Properties of Novel Materials, Kirchberg, (2-9 mars 2002).
[22] M. Razafinimanana, M. Pacheco, M. Monthioux, H. Allou-che, H. Lange, A. Huczko, and A. Gleizes, (2001) “Spectros-copic study of an electric arc with Gd and Fe doped anodes for the carbon nanotube formation”. 25th International Con-ference on Phenomena in Ionized Gases, Extend. Abstr. 3, pp. 297-298, Nagoya, Japan (17-22 July, 2001).