Determination of Stress Concentration factor in Linearly Elastic
Structures with Different Stress-Raisers Using FEM
Dheeraj Gunwant
1, Rahul Kshetri
2,Kamal Singh Rawat
3 1(Department of Mechanical Engineering ,G. B. Pant University of Agriculture and Technology, Pantnagar, Udham Singh Nagar, Uttarakhand-263145
Email:[email protected], 2
( Department of Industrial and Production Engineering ,G. B. Pant University of Agriculture and Technology, Pantnagar, Udham Singh Nagar, Uttarakhand-263145
Email: [email protected]) 3
(Department of Mechanical Engineering,G. B. Pant University of Agriculture and Technology, Pantnagar, Udham Singh Nagar, Uttarakhand-263145
Email:[email protected])
ABSTRACT
Stress concentration is the localization of stress around stress raisers. Sudden changes in the geometry of structures give rise to stress values that are higher than those obtained by elementary equations of solid mechanics. Therefore the evaluation of stress state at such locations needs specialized techniques such as Finite Element Method (FEM).The finite element method is a numerical procedure that can be used to obtain solution to a large variety of engineering problems such as structural, thermal, heat transfer, electromagnetism and fluid flow.
In the present investigation, focus has been kept on the finite element modeling and determination of stress concentration factor (SCF) in linearly elastic structures with different stress-raisers such as circular and elliptical holes and double semicircular notch at different locations in a finite plate. The results obtained from FEM are compared with those obtained by analytical relations as given in literature. A commercially available finite element solver ANSYS has been used for the modeling and analysis in the investigation. Throughout the investigation, plane82, which is an eight node two-dimensional element is used for the discretization.
Keywords
–Stress concentration, ANSYS, FEM, Plane82.
I. INTRODUCTION
Rectangular finite width plates find wide application in various fields such as aerospace, automobiles etc. Due to the different design considerations and fastening requirements, it becomes imperative for the designer to provide holes and other geometries or sudden changes in the structure. These discontinuities in the structure tend to raise the stress values at locations in the proximity of them. The stresses in such locations attain values that are beyond the scope of the elementary equations of solid mechanics. It becomes equally important for the design engineer to know these stresses and stress concentration factor (SCF)due to the stress raisers. The knowledge of these SCFs a-priori forms the basis for the selection of materials. Such stresses can be approximated with special techniques such as the FEM and Boundary Element Method (BEM) etc.
The analysis of stress concentration has attracted researchers from as early as 1960s. Researchers have analyzed different stress raising Geometries such as circular, elliptical holes, U and V Notches in a plate with different loadings and
materials. Earlier the main focus of the researchers
was to determine SCFs experimentally or
analytically. With the advent of finite element method, the scenario has changed and focus has shifted on the finite element analysis of such problems.
Significant contribution in the study of stress
concentration analysis has been made by
Peterson[1], who compiled the work of many researchers for rectangular plates with holes and notches under bending, torsion and axial loads. Patil et al. [2] determined Stresses in a rectangular plate with two elliptical holes. Young et al. [3] compiled analytical formulae for determining stress concentration factor obtained by R. J. Roark. Li et al. [4] studied the effect of thickness on the SCF in aluminum alloy (LY12-CZ) plate under axial and transverse tensile load using 3D FEM. Mittal et al. [5] analyzed stress concentration and deflection in isotropic and orthotropic plates with circular holes in rectangular plates under transverse static loads using FEM. Growney [6] presented the method of using FEA results to obtain SCF for central circular hole and shoulder fillet structures.Snowberger [7] studied
the convergence behavior of SCF in rectangular plate with elliptical hole using FEM. Patle et al. [8] determined SCF in plate with oblique hole. Zuxing et al. [9] performed
s
tress analysis of a finite plate with a rectangular hole subjected to uniaxial tension.II.
M
ATERIALS AND METHODSValues of Stress concentration factors can be determined experimentally by photo-elastic method, direct strain gage measurements and through analytical relations provided by researchers.
In the present investigation, Finite Element Method (ANSYS) has been employed to determine stress concentration factor in linearly elastic rectangular structures under tensile loading with following stress-raisers:
Figure 1.Rectangular plate with central circular hole.
Figure 2. Rectangular plate with central elliptical hole.
Figure 3. Rectangular plate with eccentric circular hole
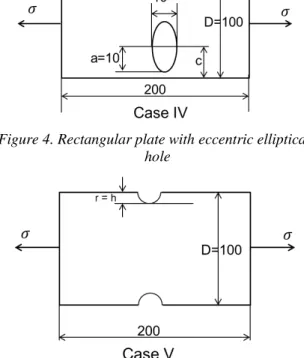
Figure 4. Rectangular plate with eccentric elliptical hole
Figure 5. Rectangular plate with two semi-circular notches
The geometries have been generated in ANSYS using its modeling and meshing capabilities. The results obtained using FEA are compared with those obtained by analytical relations given in [3].
The geometry, boundary conditions and material properties are as given in the table below.
Case Size ( ×
× )
Material Properties Loading
(�) ( ��)
E �� �
�,��,
���,��,
� 200 × 100 × 1 200 × 10
3 0.3 5
2.1 Selection of element type and sizing
Plane82 has been used for the discretization or meshing of the structures. Plane82 is an 8-node element with 2 degrees of freedom at each node. It is a higher order version of 4-node element Plane42. It provides more accurate results for complicated geometries and hence can be used for obtaining stresses accurately in the vicinity of stress-raisers.
After initial coarser mesh sizes, it was observed that results improved and were more and more close to the analytical results when the mesh size was refined to level 3 in the vicinity of the stress-raiser. Therefore this level was adapted for all stress-raisers. Quadrilateral mesh was chosen in order to obtain better visualization of results.
Figure 7. Level 3 mesh refinement near Stress-raiser
2.2 Notations Used
The notations used are as follow:
� = Nominal Stress ( 2) determined using
elementary equations of solid mechanics for minimum cross-sectional area.
� �ℎ= Theoretical maximum Stress in
x-direction ( 2).
� � � �= = Maximum Stress in x-direction obtained
using ANSYS( 2).
��ℎ= Theoretical Stress Concentration Factor
obtained using Roark’s (Analytical) formulae.
�� � �= Stress Concentration Factor obtained using
ANSYS.
The SCF is obtained using the following relation:
�= �
�
Where,
�= Maximum stress in the direction of loading.
�= Stress concentration factor.
To make calculations faster and accurate, programs were written in MATLAB for the implementation of analytical formulae for determining SCF.
III.
RESULTS AND DISCUSSIONIn this section, the above discussed cases are analyzed and the value of resulting SCF is obtained for them. The results are presented through tables, graphs and contours obtained from ANSYS. 3.1 Case I: Rectangular plate with central circular hole.
Effect of hole diameter on the SCF was studied in the structure.
SCF was obtained for different hole diameters viz. (10, 20, 30, 40, 50, 60)mm.
Figure 8. Stress distribution around the central circular hole (d=30mm)
Figure 9. Variation of x-direction stress for central circular hole (d=30mm)
As expected, the stress value is maximum near the hole circumference and it decreases as one moves towards the free edges. The maximum stress reaches about 16.5 2 near the hole.
Figure 10.Variation of ��ℎ and �� � � with /� for central circular hole
The value of SCF reduces from 2.75 for
�= 0.1 to
2.14 for�= 0.6. This explains that the stress concentration effects are less devastating as the diameter of the hole is increased for this case.
Figure 11. Percentage variation between ��ℎ and
Curve above represents that ANSYS can very much approximate the analytical results. The error between analytical and ANSYS SCF are less than about 2% for all the hole diameters considered.
3.2 Case II:Rectangular plate with central elliptical hole.
Effect of the major diameter of elliptical hole on the SCF was studied in the structure.
SCF was obtained for different hole diameters viz. (10, 20, 30, 40, 50, 60) mm.
Figure 12.Stress distribution around the central elliptical hole (d=40mm)
Figure 13. Variation of x-direction stress for central elliptical hole (d=40mm)
Fig. above shows the distribution of x-direction stress around the central elliptical hole. It is clear from the fig. that the rise in stress in the vicinity of the hole is quite sharp as compared to the circular hole. This can be attributed to the sharp edge of the elliptical hole. It can also be observed from fig. that the maximum x-direction stress reaches a value of about 95 2 which is very high as compared to
the circular hole discussed above.
Figure 14.Variation of ��ℎ and �� � � with /� for central elliptical notch
The fig. above indicates that the SCF for a central elliptical notch increases with the major diameter of the hole. It ranges between 4.57 for �= 0.1 and
15.83 for
�= 0.6. This can be attributed to the fact
that as the major diameter of the hole is increased; it reaches near the free edges.
Figure 15. Percentage variation between ��ℎ and
�� � � for central elliptical hole
Fig. above shows the percentage variation between
��ℎ and �� � �for the central elliptical hole. As
indicated in the figure, the percentage variation is lower for small /� ratios which indicate that ANSYS gives better approximation of SCF when the major diameter of the hole is small. But as the diameter is increased, the deviation of ANSYS results from the analytical one is higher and is equal to 12.04%.
3.3 Case III: Rectangular plate with eccentric circular hole
Effect of distance from nearest free surface on the SCF was studied in the structure.
SCF was obtained for different values of distance from nearest free surface viz. (15, 20, 25, 30, 35, 40, 45, 50)mm. The hole diameter was kept unchanged to see only the effect of location of hole along the central vertical axis of the rectangular plate.
Figure 17. Variation of x-direction stress for eccentric circular hole (c=30mm)
It is observed from the fig. above that the maximum stress occurs in the portion of circular hole which is nearer to the free surface. It reaches about 17
2 for c=30mm.
Figure 18. Variation of ��ℎ and �� � � with �/ for central elliptical notch
It can be observed from the fig. above that as � ratio decreases, or the hole approaches the central position, the SCF values increase for both ANSYS and analytical results. The highest value of SCF is obtained for a centrally located circular hole (�= 0.2).
Figure 19. Percentage variation between ��ℎ and
�� � � for central elliptical hole
Fig. above shows the percentage variation between
��ℎ and �� � � for an eccentric circular hole. It is
observed that ANSYS gives better approximation of SCF when the hole is located near to the longitudinal axis of the rectangular plate i.e. lower � ratios. For
higher � ratios, the percentage variation between ��ℎ
and �� � � is around 7% indicating higher degree of
disagreement between the two.
3.3 Case IV:Rectangular plate with eccentric elliptical hole
Effect of distance from nearest free surface on the SCF was studied in the structure.
SCF was obtained for different values of distance from nearest free surface viz. (15, 20, 25, 30, 35, 40, 45, and 50) mm.
Figure 20. Stress distribution around the eccentric elliptical hole (c=30mm)
Figure 21.Variation of x-direction stress for eccentric elliptical hole (c=30mm)
Figure 22. Variation of ��ℎ and �� � � with �/ for eccentric elliptical hole
As is clear from the variation of SCF with �/
shown above, the SCF increases as the hole is shifted towards the central longitudinal axis. For a central elliptical hole (�= 0.2) the SCF is maximum and is equal to 4.16 while it is minimum for �= 0.67 and is equal to 3.16.
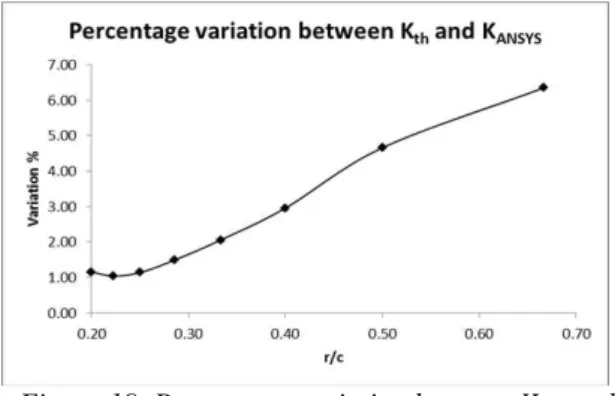
Figure 23. Percentage variation between ��ℎ and
�� � � for eccentric elliptical hole
As discussed in the case III above, it is again noticed that ANSYS results deviates from the analytical for a hole located near the free edge of the structure. The error between ��ℎand�� � � is around 8.5% while it is around 1% for a hole located near the central horizontal axis of the plate.
3.5 Case V: Rectangular plate with two semi-circular notches
Effect of the depth of semicircular notches on the SCF was studied in the structure
SCF was obtained for different values of depth or the radius of the two semicircular notches viz. (1, 2.5, 5, 7.5, 10, 12.5 and 15) mm.
Figure 24. Stress distribution around the double semicircular notches (h=10mm)
Figure 25. Variation of x-direction stress for double semicircular notches (h=10mm)
Fig. above shows the ‘bucket’ shaped stress
distribution near the semicircular notches which is self-explanatory. The middle portion of the rectangular plate is free from any stress concentration effect.
Fig. above shows the variation of SCF with depth of notch. For a smaller depth notch, the value of SCF is higher (2.85 for a depth of 1mm) and smaller (2.12 for a depth of 15mm). The SCF decreases as the depth of notches increases.
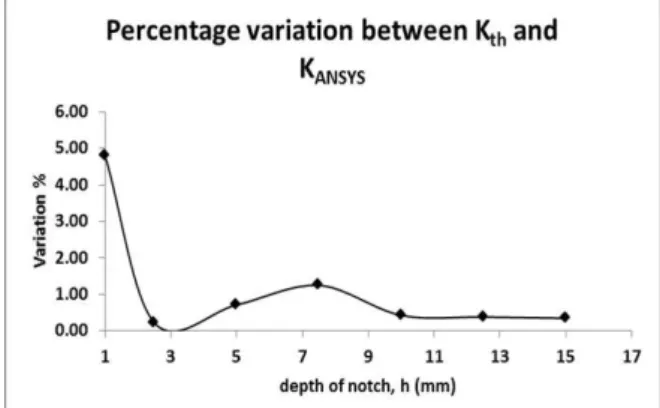
Figure 27. Percentage variation between ��ℎ and
�� � � for double semicircular notches
Fig above shows the percentage variation between
��ℎand �� � �with the depth of notches. It is
observed from the fig. that ANSYS results are in good agreement with analytical results for a deeper notch. The degree of disagreement between these two is higher for smaller depth of notches. For most of the depths, the error between ANSYS and analytical results is within 2%.
IV.
CONCLUSIONIn the present investigation, FEM using ANSYS has been used for the modeling and analysis of rectangular finite width plates with different stress raisers such as circular and elliptical holes and double semicircular notches. The values of SCF obtained using FEM are compared with those obtained using analytical relations given in [3]. From the results obtained it can be concluded that ANSYS can be used for the finite element analysis of simple as well as complicated stress raisers in the design. Further it can also be concluded that ANSYS provides a more intuitive feel to the designer by displaying contours of stresses and strains so that he can design more efficient and robust designs.
The work can be extended for studying the effect of some other stress raisers under multi-axial loading conditions. Stress mitigation studies of the structures discussed above can be obtained using Structural Optimization capabilities of ANSYS.
R
EFERENCES[1] R. E. Peterson, Stress concentration design factors (New York: John Wiley and sons, 1966). [2] D. B. Patil, V.G. Ukadgaonker, Stress analysis of a plate containing two elliptical holes subjected to uniform pressure and tangential stresses at the boundaries, ASME Journal of Engineering for Industry 115, 1993, pp. 93-101.
[3] W. C. Young, R. G. Budynas, Roark’s formula for stress and strain 7th edition,(McGraw Hill publication, 2002 ).
[4] F. Li, Y. He, C. Fan, H. Li, and H. Zhang,
Investigation on three-dimensional stress
concentration of LY12-CZ plate with two equal circular holes under tension,Materials Science and Engineering A, 2007.
[5] N. D. Mittal, N. K. Jain, The optimized design of a square simply supported isotropic plate with central circular hole for reduction of stress concentration subjected to transverse static loading,Proc. of ICTACEM, 2007.
[6] W. D. Growney, Using FEA results to determine
Stress Concentration Factors. Int. ANSYS
conference, California, 2008.
[7] D. Snowberger, Stress concentration factor convergence study of a flat plate with an elliptical hole under elastic loading conditions. Masters diss., Rensselaer Polytechnic Institute Hartford, Connecticut, 2008.
[8] B. C. Patle, D. V.Bhope, Evaluation of stress concentration factors in plate with oblique hole,IOSRJMCE, ISSN: 2278-1684, Vol. 2, Issue 2, 2012 pp. 28-32.
[9] P. Zuxing,C. Yuansheng, L. Jun, Stress analysis of a finite plate with a rectangular hole subjected to uniaxial tension using modified stress functions. International Journal of Mechanical Sciences 75, 2013, pp. 265–27.
[10] D. Gunwant, J. P. Singh, Stress and displacement analysis of a rectangular plate with central elliptical hole, IJEIT, ISSN: 2277-3754, Vol. 3, Issue 3, 2013, pp. 387-392.