TCD
4, 1593–1606, 2010The sea level fingerprint of 21st
century ice mass fluxes
J. Bamber and R. Riva
Title Page
Abstract Introduction
Conclusions References
Tables Figures
◭ ◮
◭ ◮
Back Close
Full Screen / Esc
Printer-friendly Version Interactive Discussion
Discussion
P
a
per
|
Dis
cussion
P
a
per
|
Discussion
P
a
per
|
Discussio
n
P
a
per
|
The Cryosphere Discuss., 4, 1593–1606, 2010 www.the-cryosphere-discuss.net/4/1593/2010/ doi:10.5194/tcd-4-1593-2010
© Author(s) 2010. CC Attribution 3.0 License.
The Cryosphere Discussions
This discussion paper is/has been under review for the journal The Cryosphere (TC). Please refer to the corresponding final paper in TC if available.
The sea level fingerprint of 21st century
ice mass fluxes
J. Bamber1and R. Riva2
1
Bristol Glaciology Centre, University of Bristol, UK
2
Delft Institute of Earth Observation and Space Systems, Delft University of Technology, The Netherlands
Received: 30 July 2010 – Accepted: 2 August 2010 – Published: 3 September 2010
Correspondence to: J. Bamber ([email protected])
TCD
4, 1593–1606, 2010The sea level fingerprint of 21st
century ice mass fluxes
J. Bamber and R. Riva
Title Page
Abstract Introduction
Conclusions References
Tables Figures
◭ ◮
◭ ◮
Back Close
Full Screen / Esc
Printer-friendly Version Interactive Discussion
Discussion
P
a
per
|
Dis
cussion
P
a
per
|
Discussion
P
a
per
|
Discussio
n
P
a
per
|
Abstract
The sea level contribution from glacial sources has been accelerating during the 21st century (Meier et al., 2007; Velicogna, 2009). This contribution is not distributed uni-formly across the world’s oceans due to both oceanographic and gravitational effects. We compute the sea level signature of 21st century ice mass fluxes due to changes
5
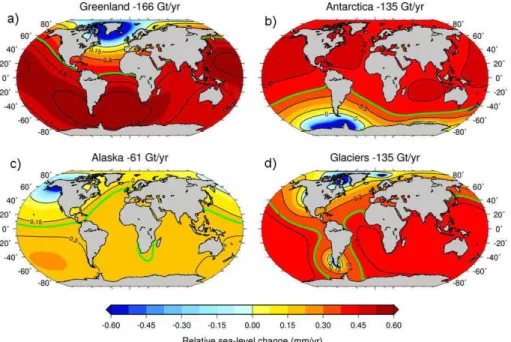
in the gravity field, Earth’s rotation and related effects. Mass loss from Greenland re-sults in a relative sea level (RSL) reduction for much of North Western Europe and Eastern Canada. RSL rise from this source is concentrated around South America. Losses in West Antarctica marginally compensate for this and produce maxima along the coastlines of North America, Australia and Oceania. The combined far-field pattern
10
of wastage from all ice melt sources, is dominated by losses from the ice sheets and results in maxima at latitudes between 20◦N and 40◦S across the Pacific and Indian Oceans, affecting particularly vulnerable land masses in Oceania. The spatial pattern of RSL variations due to the observed ice mass loss is temporally invariant. Thus, sea level rise, based on the land ice losses considered here, will be amplified for this
15
sensitive region.
1 Introduction
It has been suggested that the ocean dynamic response to future climate change will result in enhanced sea level rise for the northeast coastline of the United States (Yin et al., 2009) and that steric anomalies, due to increased melt from the ice sheets,
20
will result in long-lived local RSL variations (Stammer, 2008). The geodetic effects of regional ice melt and ongoing glacio isostatic adjustment (GIA) are, however, also not uniformly distributed across the World’s oceans and have a markedly different and, importantly, time-invariant, spatial signature. The non-uniform effect on RSL of the melting of large ice masses, such as the Antarctic and Greenland ice sheets, due to
TCD
4, 1593–1606, 2010The sea level fingerprint of 21st
century ice mass fluxes
J. Bamber and R. Riva
Title Page
Abstract Introduction
Conclusions References
Tables Figures
◭ ◮
◭ ◮
Back Close
Full Screen / Esc
Printer-friendly Version Interactive Discussion
Discussion
P
a
per
|
Dis
cussion
P
a
per
|
Discussion
P
a
per
|
Discussio
n
P
a
per
|
changes in the Earth’s gravity field was recognised over 30 years ago (Clark and Lingle, 1977). The original theory has been updated to include the effects of changes in Earth rotation, also known as true polar wander (TPW), and shoreline migration (Milne and Mitrovica, 1998). This updated theory has been used to examine the spatial pattern in relative sea level for a hypothetical wastage of large ice masses and to infer the mean
5
rate of loss from Greenland over the 20th century (Mitrovica et al., 2001).
Up until recently, however, there has been limited quantitative information on the spatial pattern of mass loss from the ice sheets. Recent satellite observations, in par-ticular from GRACE and synthetic radar aperture interferometry (InSAR), have, how-ever, provided unprecedented insights into both the magnitude and pattern of ice loss
10
from the three largest sources of mass to the oceans: the Greenland and Antarctic ice sheets and Alaskan glaciers (Berthier et al., 2010; Luthcke et al., 2008; Rignot et al., 2008b; van den Broeke et al., 2009). Furthermore, consistency between different ap-proaches is now being achieved, providing greater confidence in the results (van den Broeke et al., 2009). Here, we use these detailed observations of the spatial pattern
15
of mass loss to examine the signature of relative sea level resulting from changes to the gravity field, TPW and shoreline migration. Mountain glacier and ice cap (MG&IC) sources from elsewhere are, individually, considerably smaller than the three regions mentioned, and combined they contribute about 27% of the total for the period 2000– 2009 (Meier et al., 2007; Hock et al., 2009; Chen et al., 2009; Wouters et al., 2008;
20
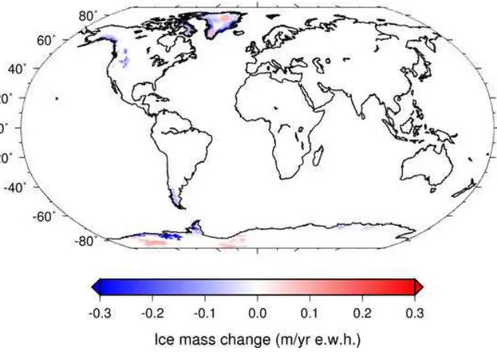
Chen et al., 2007). We include, therefore, estimates of these smaller sources when considering the integrated pattern of SLR from ice melt (Fig. 1). We stress, however, that we consider, here, only the gravitationally consistent signature of ice melt. We do not include the response of ocean dynamics to the additional influx of freshwater nor other changes in ocean dynamics due to predicted climate change, which can have a
25
TCD
4, 1593–1606, 2010The sea level fingerprint of 21st
century ice mass fluxes
J. Bamber and R. Riva
Title Page
Abstract Introduction
Conclusions References
Tables Figures
◭ ◮
◭ ◮
Back Close
Full Screen / Esc
Printer-friendly Version Interactive Discussion
Discussion
P
a
per
|
Dis
cussion
P
a
per
|
Discussion
P
a
per
|
Discussio
n
P
a
per
|
effects have a transient, time-evolving spatial distribution and ocean circulation is not cumulative: it has no effect on eustatic1sea level.
2 Methods
In this study we consider mass trends for the 21st century (January 2000– January 2009), which requires extrapolation or interpolation of some of the time series
5
available by 2–3 years at the beginning or the end of the epoch as explained below. What is also important for determining the gravitationally consistent pattern of RSL is knowledge of the spatial distribution of mass loss for the major sources considered (Fig. 1). For Antarctica we used a recent compilation of basin-scale mass budget cal-culations obtained from surface velocity, ice thickness and regional climate modelling
10
data to derive the spatial distribution of losses (Rignot et al., 2008a). Results from GRACE suggest, however, a smaller average loss for the coincident period (Horwath and Dietrich, 2009; Velicogna, 2009) and, based on the analysis of elevation rates from radar altimetry (Zwally et al., 2005), we have assumed that the Abbots/Ferrigno ice shelf region along the Bellinghausen Sea sector (HH’ in Rignot et al., 2008) of West
15
Antarctica is in balance. The 2 sigma uncertainty in the mass budget estimate for this region is larger than the signal (49±54 Gt yr−1). Taking this into account we obtain a mean rate for 2000–2009 of 135 Gt yr−1. For Greenland, we use a recent estimate of annually resolved, basin-scale, mass balance that combines mass budget and gravity-derived results (van den Broeke et al., 2009). Mass budget estimates are available
20
for years 1996, 2000, 2004–2008, while the continuous GRACE time series begins in 2003. In this case extrapolation was not required and the mean loss for the epoch we consider here is 166 Gt yr−1 (van den Broeke et al., 2009). For Alaska we used our
own GRACE-derived mass trends for 2003–2009 (−61 Gt yr−1) and assumed the same
1
TCD
4, 1593–1606, 2010The sea level fingerprint of 21st
century ice mass fluxes
J. Bamber and R. Riva
Title Page
Abstract Introduction
Conclusions References
Tables Figures
◭ ◮
◭ ◮
Back Close
Full Screen / Esc
Printer-friendly Version Interactive Discussion
Discussion
P
a
per
|
Dis
cussion
P
a
per
|
Discussion
P
a
per
|
Discussio
n
P
a
per
|
values for 2000–2003. There is considerable inter-annual variability in mass balance and no clear trend for this region so we consider this to be a reasonable approximation (Luthcke et al., 2008). For smaller regional sources we used recent estimates for the magnitudes and temporal trends (Dyurgerov and Meier, 2005; Hock et al., 2009; Kaser et al., 2006; Meier et al., 2007; Chen et al., 2007; Wouters et al., 2008). Table 1
indi-5
cates the mass trends assumed for the eight regions considered here. The total mean flux over the period 2000–2009 is 497 Gt yr−1, which is equivalent to 1.4 mm/yr eustatic SLR. The Himalayas were excluded for reasons explained elsewhere (supplementary information).
3 Results and discussion
10
The distribution of mass loss/gain is not uniform over the three major source areas (Fig. 1) and this has important consequences for the pattern of sea level variations due to these sources. Mass loss in Greenland is dominated by dynamic thinning in the south east and enhanced ablation around the margins (Fig. 1), especially along the southern half of the ice sheet (Ettema et al., 2009; van den Broeke et al., 2009). This
15
pattern of mass loss results in a RSL lowering for the whole of the UK, Scandinavia Ice-land, Quebec, the Hudson Bay and Nunavut (Fig. 2a). There is a negligible impact on the rest of northern Europe including the Netherlands, Atlantic coastline of Germany and along the Arctic coastline of Russia (Fig. 2a). The spatial pattern differs signifi-cantly from an earlier result that assumed uniform wastage across the ice sheet, which
20
has the effect of pushing the zero RSL contour further north (Mitrovica et al., 2001). The far-field peak increase is less dependent on the precise pattern of mass loss and occurs in the South Atlantic and around the southern tip of Chile and Argentina, in broad agreement with an earlier study (Mitrovica et al., 2001). Mass loss from Antarc-tica is concentrated in key sectors of West AntarcAntarc-tica and the Peninsula (Fig. 1) (Rignot
25
TCD
4, 1593–1606, 2010The sea level fingerprint of 21st
century ice mass fluxes
J. Bamber and R. Riva
Title Page
Abstract Introduction
Conclusions References
Tables Figures
◭ ◮
◭ ◮
Back Close
Full Screen / Esc
Printer-friendly Version Interactive Discussion
Discussion
P
a
per
|
Dis
cussion
P
a
per
|
Discussion
P
a
per
|
Discussio
n
P
a
per
|
the increase is about 30% higher than the eustatic value (Bamber et al., 2009; Mitrovica et al., 2009).
Mass loss from the Gulf of Alaska results in RSL lowering over the northern Pacific Ocean and over most of the northern coastline of Canada (Fig. 2c). Sea level rise in the southern hemisphere is modest from this source (∼0.2 mm/yr) as the mass loss
5
rate is less than half that of either ice sheet and does not appear to be accelerating (Luthcke et al., 2008). MG&IC losses are concentrated, primarily, in the high Arctic and Patagonia (Fig. 1) with the largest RSL effects close to these regions (Fig. 2d). Losses from MG&IC appear to be increasing (Meier et al., 2007) but at a more mod-est rate compared with the ice sheets, which are now the dominant source of mass to
10
the oceans (van den Broeke et al., 2009; Velicogna, 2009). There is a large relative uncertainty in the individual MG&IC contributions (Dyurgerov and Meier, 2005) but in absolute terms, the errors are small (in the range 10–20 Gt/yr) compared with the con-tributions from the three major sources (61–166 Gt/yr). If the present-day distribution of ice loss is maintained, then the patterns of RSL in Fig. 2 will be the same but the
15
scale will increase linearly with time.
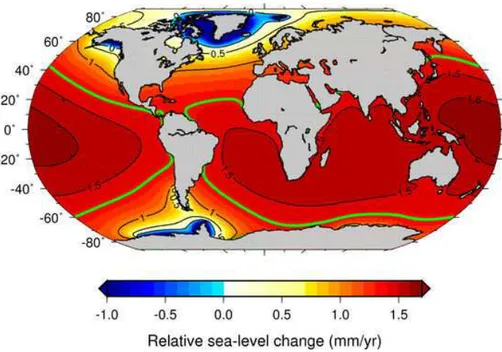
It is important to consider the separate fingerprints of RSL from the major sources to understand their individual gravitationally-consistent “fingerprints”, but for present-day and future trends in sea level, it is, perhaps, the combined signal that is important. This is shown in Fig. 3. In this case the maxima in RSL (∼1.23 times eustatic) are
20
concentrated in a zonal band from about 20◦N to 40◦S in the Western Pacific and In-dian Oceans, encompassing a number of islands that are particularly vulnerable to sea level rise (Nicholls and Tol, 2006), while Northern Europe experiences a RSL rise that is∼45% less than eustatic. This is equivalent to rates of 1.6 and 0.8 mm yr−1, respec-tively, for the ice losses considered here. Thus, the present-day, gravitationally
consis-25
TCD
4, 1593–1606, 2010The sea level fingerprint of 21st
century ice mass fluxes
J. Bamber and R. Riva
Title Page
Abstract Introduction
Conclusions References
Tables Figures
◭ ◮
◭ ◮
Back Close
Full Screen / Esc
Printer-friendly Version Interactive Discussion
Discussion
P
a
per
|
Dis
cussion
P
a
per
|
Discussion
P
a
per
|
Discussio
n
P
a
per
|
gravity field, and TPW. GIA is largest for those land masses that have experienced the greatest changes in ice loading and, in particular, for North America and Fennoscandia (Fig. S1). The low-latitude impact, where the ice melt signature peaks in Fig. 3a, is negligible over the deep ocean. Close to the coast, continental uplift results in a small negative RSL signal (Fig. S1). Overall, GIA, and uncertainties in estimating it, have
5
little impact on the regions of maximum RSL shown in Fig. 3.
In addition to GIA and mass exchanges, there are two processes within the oceans that affect relative sea level. Steric increases (density changes due to salt and heat content variations) were responsible for about a quarter of the total SLR rise over the last 50 years increasing to almost a half since 1993 but with large regional variations
10
(Lombard et al., 2005; Nerem et al., 2006). Steric increases are, thus, both spatially and temporally highly variable. Some of this variability can be explained by major cli-mate oscillations such as the El Nino Southern Oscillation and ocean currents (Nerem et al., 2006; Church et al., 2004). Not surprisingly, over multi-decadal time scales the spatial variations become less pronounced and almost an order of magnitude smaller
15
in rate (Church et al., 2004). A further, transient signal is the effect that freshwater fluxes from ice melt have on ocean circulation (Stammer, 2008) and related dynamic effects due to predicted climate change (Yin et al., 2009). Locally, these can be sig-nificant (tens of centimetres deviation from the mean) but a critical difference between these effects and those due to self-gravitation and TPW is that they are transient and
20
have a mean of zero. In this case, the ocean circulation response is not a rate (i.e. it is not cumulative) but an absolute sea surface height anomaly that is related to the magnitude of the freshwater flux entering the ocean (Stammer, 2008) and the reduc-tion in the strength, for example, of the Atlantic meridional overturning circulareduc-tion (Yin et al., 2009). The contribution from ice melt is, however, cumulative and the regional
25
amplification is stationary in time for a given distribution of melt.
TCD
4, 1593–1606, 2010The sea level fingerprint of 21st
century ice mass fluxes
J. Bamber and R. Riva
Title Page
Abstract Introduction
Conclusions References
Tables Figures
◭ ◮
◭ ◮
Back Close
Full Screen / Esc
Printer-friendly Version Interactive Discussion
Discussion
P
a
per
|
Dis
cussion
P
a
per
|
Discussion
P
a
per
|
Discussio
n
P
a
per
|
smaller RSL increase for Northern Europe and the Baltic coastline and, comparatively, about twice the RSL increase for an area that includes Micronesia, the Solomon and Marshal Islands, French Polynesia, the Maldives, South Asia and many small Atolls (Nicholls and Tol, 2006). This is a region where steric SLR has also been significantly above the global mean value for the last∼15 years and where the predicted sea
sur-5
face height anomaly due to ocean dynamics is close to the global mean (Lombard et al., 2005;Nerem et al., 2006;Yin et al., 2009). It is a region that is particularly vulnerable but also particularly ill equipped to adapt to SLR.
Supplementary material related to this article is available online at:
http://www.the-cryosphere-discuss.net/4/1593/2010/tcd-4-1593-2010-supplement.
10
pdf.
Acknowledgements. JLB was funded by UK Natural Environment Research Council grant
NE/E004032/1 and a Colorado University Cooperative Institute for Research in Environmen-tal Sciences (CIRES) fellowship.
References
15
Bamber, J. L., Riva, R. E. M., Vermeersen, B. L. A., and LeBrocq, A. M.: Reassessment of the Potential Sea-Level Rise from a Collapse of the West Antarctic Ice Sheet, Science, 324, 901–903, doi:10.1126/science.1169335, 2009.
Berthier, E., Schiefer, E., Clarke, G. K. C., Menounos, B., and Remy, F.: Contribution of Alaskan glaciers to sea-level rise derived from satellite imagery, Nat. Geosci., 3, 92–95,
20
doi:10.1038/ngeo737, 2010.
Chen, J. L., Wilson, C. R., Tapley, B. D., Blankenship, D. D., and Ivins, E. R.: Patagonia icefield melting observed by gravity recovery and climate experiment (GRACE), Geophys. Res. Lett., 34, L22501, doi:10.1029/2007gl031871, 2007.
Chen, J. L., Wilson, C. R., Blankenship, D., and Tapley, B. D.: Accelerated Antarctic ice loss
25
TCD
4, 1593–1606, 2010The sea level fingerprint of 21st
century ice mass fluxes
J. Bamber and R. Riva
Title Page
Abstract Introduction
Conclusions References
Tables Figures
◭ ◮
◭ ◮
Back Close
Full Screen / Esc
Printer-friendly Version Interactive Discussion
Discussion
P
a
per
|
Dis
cussion
P
a
per
|
Discussion
P
a
per
|
Discussio
n
P
a
per
|
Church, J. A., White, N. J., Coleman, R., Lambeck, K., and Mitrovica, J. X.: Estimates of the regional distribution of sea level rise over the 1950–2000 period, J. Clim., 17, 2609–2625, 2004.
Clark, J. A. and Lingle, C. S.: Future Sea-Level Changes Due to West Antarctic Ice Sheet Fluctuations, Nature, 269, 206–209, 1977.
5
Dyurgerov, M. and Meier, M. F.: Glaciers and the changing Earth System: A 2004 snapshot, INSTAAR, University of Colorado at Boulder, Boulder, 118, 2005.
Ettema, J., van den Broeke, M., van Meijgaard, E., van de Berg, W., Bamber, J. L., Box, J. E., and Bales, R. C.: Higher surface mass balance of the Greenland ice sheet revealed by high-resolution climate modeling, Geophys. Res. Lett., 36, L12501, doi:10.1029/2009GL038110,
10
2009.
Hock, R., de Woul, M., Radic, V., and Dyurgerov, M.: Mountain glaciers and ice caps around Antarctica make a large sea-level rise contribution, Geophys. Res. Lett., 36, L07501, doi:10.1029/2008gl037020, 2009.
Horwath, M. and Dietrich, R.: Signal and error in mass change inferences from GRACE: the
15
case of Antarctica, Geophys. J. Int., 177, 849–864, doi:10.1111/j.1365-246X.2009.04139.x, 2009.
Kaser, G., Cogley, J. G., Dyurgerov, M. B., Meier, M. F., and Ohmura, A.: Mass balance of glaciers and ice caps: Consensus estimates for 1961–2004, Geophys. Res. Lett., 33, L19501, doi:10.1029/2006GL027511, 2006.
20
Lombard, A., Cazenave, A., Le Traon, P. Y., and Ishii, M.: Contribution of thermal ex-pansion to present-day sea-level change revisited, Global Planet. Change, 47, 1–16, doi:10.1016/j.gloplacha.2004.11.016, 2005.
Luthcke, S. B., Arendt, A. A., Rowlands, D. D., McCarthy, J. J., and Larsen, C. F.: Recent glacier mass changes in the Gulf of Alaska region from GRACE mascon solutions, J. Glaciol., 54,
25
767–777, 2008.
Meier, M. F., Dyurgerov, M. B., Rick, U. K., O’Neel, S., Pfeffer, W. T., Anderson, R. S., Anderson, S. P., and Glazovsky, A. F.: Glaciers dominate Eustatic sea-level rise in the 21st century, Science, 317, 1064–1067, doi:10.1126/science.1143906, 2007.
Milne, G. A. and Mitrovica, J. X.: Postglacial sea-level change on a rotating Earth, Geophys. J.
30
Int., 133, 1–19, 1998.
TCD
4, 1593–1606, 2010The sea level fingerprint of 21st
century ice mass fluxes
J. Bamber and R. Riva
Title Page
Abstract Introduction
Conclusions References
Tables Figures
◭ ◮
◭ ◮
Back Close
Full Screen / Esc
Printer-friendly Version Interactive Discussion
Discussion
P
a
per
|
Dis
cussion
P
a
per
|
Discussion
P
a
per
|
Discussio
n
P
a
per
|
Mitrovica, J. X., Gomez, N., and Clark, P. U.: The Sea-Level Fingerprint of West Antarctic Collapse, Science, 323, 753–753, doi:10.1126/science.1166510, 2009.
Nerem, R. S., Leuliette, E., and Cazenave, A.: Present-day sea-level change: A review, C. R. Geosci., 338, 1077–1083, doi:10.1016/j.crte.2006.09.001, 2006.
Nicholls, R. J. and Tol, R. S. J.: Impacts and responses to sea-level rise: a global analysis
5
of the SRES scenarios over the twenty-first century, Philos. T. R. Soc. A, 364, 1073–1095, 2006.
Rignot, E., Bamber, J. L., van den Broeke, M. R., Davis, C., Li, Y., van de Berg, W. J., and van Meijgaard, E.: Recent Antarctic ice mass loss from radar interferometry and regional climate modelling, Nature Geosci., 1, 106–110, doi:10.1038/ngeo102, 2008a.
10
Rignot, E., Box, J. E., Burgess, E., and Hanna, E.: Mass balance of the Greenland ice sheet from 1958 to 2007, Geophys. Res. Lett., 35, L20502, doi:10.1029/2008gl035417, 2008b. Stammer, D.: Response of the global ocean to Greenland and Antarctic ice melting, J. Geophys.
Res.-Oceans, 113, 16, C06022, doi:10.1029/2006jc004079, 2008.
van den Broeke, M., Bamber, J., Ettema, J., Rignot, E., Schrama, E., van de Berg, W. J., van
15
Meijgaard, E., Velicogna, I., and Wouters, B.: Partitioning Recent Greenland Mass Loss, Science, 326, 984–986, doi:10.1126/science.1178176, 2009.
Velicogna, I.: Increasing rates of ice mass loss from the Greenland and Antarctic ice sheets revealed by GRACE, Geophys. Res. Lett., 36, L19503, doi:10.1029/2009gl040222, 2009. Wouters, B., Chambers, D., and Schrama, E. J. O.: GRACE observes small-scale mass loss in
20
Greenland, Geophys. Res. Lett., 35, L20501, doi:10.1029/2008gl034816, 2008.
Yin, J. J., Schlesinger, M. E., and Stouffer, R. J.: Model projections of rapid sea-level rise on the northeast coast of the United States, Nat. Geosci., 2, 262–266, doi:10.1038/ngeo462, 2009.
Zwally, H. J., Giovinetto, M. B., Li, J., Cornejo, H. G., Beckley, M. A., Brenner, A. C., Saba, J.
25
TCD
4, 1593–1606, 2010The sea level fingerprint of 21st
century ice mass fluxes
J. Bamber and R. Riva
Title Page
Abstract Introduction
Conclusions References
Tables Figures
◭ ◮
◭ ◮
Back Close
Full Screen / Esc
Printer-friendly Version Interactive Discussion
Discussion
P
a
per
|
Dis
cussion
P
a
per
|
Discussion
P
a
per
|
Discussio
n
P
a
per
|
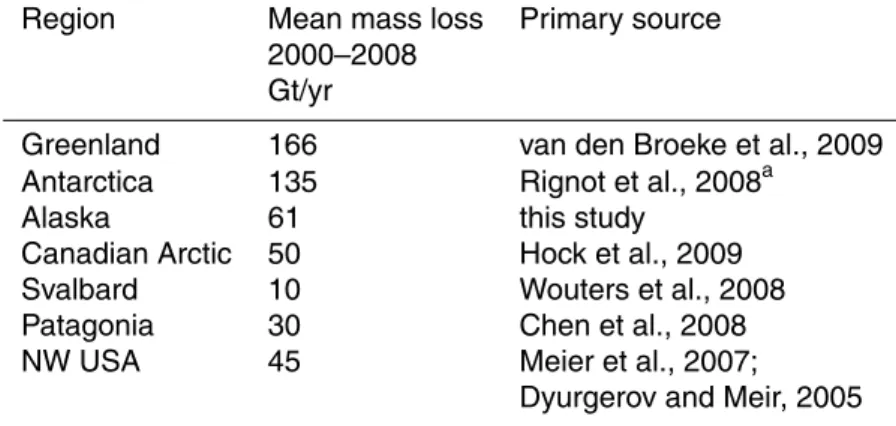
Table 1. Regional distribution of ice mass losses. Column three refers to the primary source for relative spatial distribution of losses. For mountain glaciers and ice cap regions the source references were not always explicit about the relative contributions. For NW USA we referred to Dyurgerov and Meier to determine the relative contributions but ensured that the total for non-ice sheet contributions agreed with Meier et al., 2007 and Dyurgerov and Meier, 2005. Our estimates for Greenland and Antarctica include MG&IC not connected to the ice sheets.
Region Mean mass loss Primary source 2000–2008
Gt/yr
Greenland 166 van den Broeke et al., 2009 Antarctica 135 Rignot et al., 2008a
Alaska 61 this study Canadian Arctic 50 Hock et al., 2009 Svalbard 10 Wouters et al., 2008 Patagonia 30 Chen et al., 2008 NW USA 45 Meier et al., 2007;
Dyurgerov and Meir, 2005
aTwo estimates are provided: a net flux and net
TCD
4, 1593–1606, 2010The sea level fingerprint of 21st
century ice mass fluxes
J. Bamber and R. Riva
Title Page
Abstract Introduction
Conclusions References
Tables Figures
◭ ◮
◭ ◮
Back Close
Full Screen / Esc
Printer-friendly Version Interactive Discussion
Discussion
P
a
per
|
Dis
cussion
P
a
per
|
Discussion
P
a
per
|
Discussio
n
P
a
per
|
Fig. 2.Relative sea level variations due the gravitational and Earth rotational effects of recent (2000–2008) ice mass losses from different sources;(a)Greenland,(b)Antarctica,(c)Alaska,
TCD
4, 1593–1606, 2010The sea level fingerprint of 21st
century ice mass fluxes
J. Bamber and R. Riva
Title Page
Abstract Introduction
Conclusions References
Tables Figures
◭ ◮
◭ ◮
Back Close
Full Screen / Esc
Printer-friendly Version Interactive Discussion
Discussion
P
a
per
|
Dis
cussion
P
a
per
|
Discussion
P
a
per
|
Discussio
n
P
a
per
|