Magnetic resonance imaging of ankle impingement
syndrome: iconographic essay*
Síndrome do impacto do tornozelo na ressonância magnética: ensaio iconográfico
Claudio Marcio Amaral de Oliveira Lima1, Erica Barreiros Ribeiro2, Elisa Pompeu Dias Coutinho3, Evandro Miguelote Vianna4, Rômulo Côrtes Domingues4, Antonio Carlos Coutinho Júnior3
Ankle impingement syndrome is a painful condition resulting from friction of joint tissues that is both cause and effect of an altered joint biomechanics. The leading causes of such condition are post-traumatic lesions, particularly the ligamentous ones, resulting in chronic ankle pain. From an anatomic and clinical point of view, these syndromes may be classified as anterolateral, anterior, anteromedial, posteromedial, and posterior. Magnetic resonance imaging is an excellent diagnostic method for demonstrating bone and soft tissue abnormalities resulting from different types of ankle impingement, providing useful data to confirm the diagnosis as well as to rule out other possible causes of joint pain. The present essay is aimed at illustrating the main magnetic resonance imaging findings in ankle impingement syndrome.
Keywords: Magnetic resonance imaging; Syndrome; Impingement; Ankle.
A síndrome do impacto do tornozelo é uma condição dolorosa causada por atrito de tecidos articulares, que é tanto causa quanto consequência de uma biomecânica alterada desta articulação. A sua principal causa são as lesões pós-traumáticas, principalmente lesões ligamentares, resultando em dor crônica no tornozelo. Do ponto de vista anatômico e clínico, estas síndromes são classificadas em: lateral, anterior, ântero--medial, póstero-medial e posterior. A ressonância magnética é um ótimo método diagnóstico para demons-trar as alterações ósseas e as partes moles dos vários tipos de impacto do tornozelo, fornecendo dados que auxiliam não só na comprovação desse diagnóstico, como na diferenciação com outras causas de dor arti-cular. Os autores objetivam ilustrar os principais achados de ressonância magnética na síndrome do impacto do tornozelo.
Unitermos: Imagem por ressonância magnética; Síndrome; Impacto; Tornozelo.
Abstract
Resumo
* Study developed at Clínicas de Diagnóstico Por Imagem (CDPI)/Multi-Imagem, Rio de Janeiro, RJ, and Centro de Diag-nóstico por Imagem Fátima Digittal, Nova Iguaçu, RJ, Brazil.
1. MD, Radiologist, Centro de Diagnóstico por Imagem Fátima Digittal, Nova Iguaçu, RJ, Brazil.
2. MD, Radiologist, Unit of Magnetic Resonance Imaging – Hospital São José, Criciúma, SC, Brazil.
3. MDs, Radiologists, Clínicas de Diagnóstico Por Imagem (CDPI)/Multi-Imagem, Rio de Janeiro, RJ, and Centro de Diag-nóstico por Imagem Fátima Digittal, Nova Iguaçu, RJ, Brazil.
4. MDs, Radiologists, Clínicas de Diagnóstico Por Imagem (CDPI)/Multi-Imagem, Rio de Janeiro, RJ, Brazil.
Mailing address: Dr. Antonio Carlos Coutinho Júnior. CDPI – Clínica de Diagnóstico Por Imagem. Avenida das Américas, 4666, sala 325, Barra da Tijuca. Rio de Janeiro, RJ, Brazil, 22649-900. E-mail: [email protected] / [email protected]
Received October 12, 2009. Accepted after revision January 25, 2010.
previous history of surgery, endocrinopa-thy or rheumatologic diseases, either in as-sociation or not, and type of physical activ-ity, if any.
The sequences utilized in the protocol for study of the ankle, both with a 1.5 T unit (Magnetom Avanto; Siemens Medical Sys-tems, Erlangen, Germany) and with a 3 T unit (Magnetom Trio; Siemens Medical Systems; Erlangen, Germany) are respec-tively: sagittal, T1-weighted (Avanto – FOV: 170; slice thickness: 4/25; matrix: 512 × 282; NEX: 1; acquisition time: 1.55 min; TR: 400; TE: 20. Trio – FOV: 160; thickness: 3/0.6; matrix: 384 × 307; NEX: 2; acquisition time: 1.16 min; TR: 641; TE: 11) and axial (Avanto – FOV: 160; thick-ness: 3/30; matrix: 384 × 214; NEX: 1; ac-quisition time: 1.21 min; TR: 552; TE: 24. Trio – FOV: 160; thickness: 3/0.3; matrix: 384 × 307; NEX: 2; acquisition time: 1.45
Lima CMAO, Ribeiro EB, Coutinho EPD, Vianna EM, Domingues RC, Coutinho Jr AC. Magnetic resonance imaging of ankle impingement syndrome: iconographic essay. Radiol Bras. 2010;43(1):53–57.
ligament lesions, resulting in chronic ankle pain. From the clinical and anatomical point of view, such syndrome is classified into anterolateral, anterior, anteromedial, posteromedial and posterior(1–3).
The present study is aimed at illustrat-ing, as an iconographic essay, the main magnetic resonance imaging (MRI) find-ings of ankle impingement syndrome.
MRI PROTOCOLS
The patients are previously instructed to not utilize any type of substance (oint-ments, gel or cream) on the ankle, and be-fore being submitted to MRI, they are in-terviewed by the clinical team on the pres-ence, intensity and localization of the pain, type of trauma and respective dynamics (inversion, eversion, hyperextension or flexion, if either direct or indirect, etc.) INTRODUCTION
min; TR: 500; TE: 11), STIR sequences or proton density with fat suppression at sag-ittal plane (Avanto – FOV: 170; thickness: 4/25; matrix: 320 × 208; NEX: 1; acqui-sition time: 2.04 min; TR: 3000; TE: 33. Trio – FOV: 160; thickness: 3/0.6; matrix: 320 × 256; NEX: 2; acquisition time: 1.53 min; TR: 2500; TE: 44), sequences at pro-ton density, coronal plane (Avanto – FOV: 170; thickness: 3/30; matrix: 320 × 146; NEX: 1; acquisition time: 2.29 min; TR: 4810; TE: 33. Trio – FOV: 160; thickness: 3/0.6; matrix: 320 × 256; NEX: 2;
acqui-cant mechanical instability. Microtraumas continuity results in inflammation, synovial hypertrophy and fibrosis, causing pain and mechanical instability. In the most ad-vanced forms, an organized meniscal le-sion develops with hypertrophic synovial tissue and fibrosis(1,4), as described by Wolin et al.(5).
The anterior talofibular ligament and the tibiofibular ligament were implied as causes for such impingement(4). The pres-ence of anterior or anterolateral bone im-pingement caused by osteophytes may
ex-acerbate this condition. The accessory fas-cicle of the anterior tibiofibular ligament (Bassett’s ligament)(6), that is a common anatomic variation, may present hypertro-phy after repeated trauma, resulting in an-terolateral impingement, particularly if other supporting structures of the region are involved(1,4).
At MRI, the presence of soft tissue mass or fibrotic band in the anterolateral ankle gutter, different from the anterior talofibu-lar ligament, suggests the diagnosis(1,4) (Figures 1 and 2). Conventional MRI
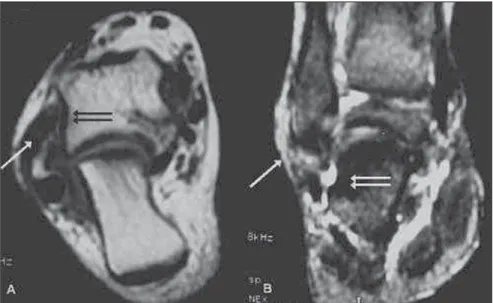
accu-Figure 2. T1-weighted axial (A) and coronal, proton density with fat suppression (B) demonstrating isointense tissue in the anterolateral gutter (arrows) and minimal corresponding sclerosis on the lateral talar surface (double arrows) characterizing the impingement.
sition time: 1.45 min; TR: 2690; TE: 42) and axial plane (Avanto – FOV: 160; thick-ness: 3/30; matrix: 320 × 179; NEX: 1; ac-quisition time: 1.36 min; TR: 2600; TE: 25. Trio – FOV: 160; thickness: 3/0.3; matrix: 320 × 256; NEX: 2; acquisition time: 2.01 min; TR: 3100; TE: 42).
CLASSIFICATION
Anterolateral ankle impingement
Anterolateral ankle impingement is a common cause of chronic lateral pain in the ankle produced by hypertrophic synovial tissue entrapment in the anterolateral gut-ter of the ankle. It is estimated that approxi-mately 3% of ankle sprains lead to antero-lateral impingement(1–4).
The etiology is related to small repeated inversion traumas, initially with no
Figure 3. Lateral ankle radiography (A), sagittal T1-weighted (B), and sagittal proton density with fat suppression (C) images demonstrating anterior tibial and talar osteophytes (black arrows) with subtle bone marrow edema (double white arrows), besides anterior capsular thickening (long white arrow) characterizing anterior ankle impingement.
racy still remains controversial, and many authors advocate the utilization of MRI only in the presence of a significant joint effusion. Magnetic resonance arthrography represents an excellent tool for diagnostic elucidation before arthroscopy, and a rel-evant finding is the absence of fluid in the recess between the soft tissues of the ante-rolateral region and the anterior fibular surface, because of the presence of adhe-sions and cicatricial tissue between the fibula and the joint capsule, preventing the fluid to enter the recess(1,4).
Anterior ankle impingement
Anterior ankle impingement is well es-tablished and relatively common cause of chronic ankle pain, and may affect any ath-lete who is subjected to stress resulting from repeated dorsiflexion, especially soc-cer players and ballet dansoc-cers(1,3).
It is widely recognized that dorsiflexion or supination injuries can cause damages to the anterior and medial edges of the joint cartilage, and it is believed that repair of such lesion with cicatricial tissue and pro-liferative fibrosis leads to the development of osteophytes and joint capsule avulsion. Also, another theory suggests that forced dorsiflexion results in repeated micro-traumas on the tibia and talus, with conse-quential microfractures of the trabecular bone/periosteal hemorrhage, stimulating the formation of a new bone tissue. Ante-rior tibial and talar osteophytes impinge on each other, particularly at dorsiflexion, determining an impingement on the inter-posed soft tissues(1,3) (Figure 3).
Remarkably in soccer players, at the moment of the kick, the Ball causes a di-rect trauma on the anterior tibiotalar joint,
since at this moment the joint cartilage is covered only by the subcutaneous fat(1).
A study has demonstrated that a signifi-cant percentage of professional athletes (45–59%) presented osteophytes at con-ventional radiography, with no symptom of previous impingement, which leads to the conclusion that the association of cicatri-zation and synovial thickening is more sig-nificant than simply the presence of osteophytes to produce the clinical syn-drome(1,3).
Conventional radiography demonstrates osteophytes and the conventional MRI al-lows the evaluation of soft tissues, visual-ization of tibiotalar osteophytes position-ing in relation to the capsule, the synovitis in the anterior capsular recess, and the pres-ence, although rare, of bone marrow edema. Synovial thickening usually pre-sents hypointense signal on T1-weighted sequences, and low to intermediate signal intensity on T2-weighted sequences, more clearly outlined in the presence of joint effusion(1,3).
Anteromedial ankle impingement
Anteromedial ankle impingement is a clinical entity increasingly recognized in the orthopedic literature as an uncommon cause of chronic ankle pain(1).
The exact mechanism of the antero-medial ankle impingement is still to be un-derstood, however it is believed that it may be a result, initially, of a forced supination with a rotational component, leading to an injury of the anteromedial joint capsule. The repeated anterolateral impingement and subsequent microtrauma produce synovitis and joint capsule thickening. Additionally, bone and joint cartilage
le-sion may result in osteophytes formation, besides joint and synovial capsule thicken-ing on the anteromedial surface. The result is a meniscal lesion represented by thick-ening of soft tissues anterior to the tibiotalar ligaments that may appear isolatedly or be secondary to a partial in-jury of the deltoid ligament(1,3). Another cause of impingement is thickening of the anterior tibiotalar ligament. Such thicken-ing or the meniscal lesion determine im-pingement on the region corresponding to the anteromedial corner during ankle dor-siflexion, resulting in development of osteophytes, chondral lesion or both, com-monly associated with an inversion mecha-nism with injury of lateral or medial liga-ment(1,3).
Magnetic resonance imaging demon-strates the meniscal mass, chondral or os-teochondral lesions, ligament thickening, besides osteophytes(1,3) (Figure 4), and con-ventional radiography demonstrates osteophytes, but, considering the uncom-mon nature of this condition, no extensive study reporting such imaging findings is available in the literature(4).
Posteromedial ankle impingement
fect” where the posterior portion of the ta-lus and adjacent soft tissues are com-pressed between the tibia and the calcaneus during the feet plantar flexion(1,3,7).
The anatomy of the posterior region of the ankle is a key factor in the development of this type of impingement whose causes are divided into osseous and soft tissue causes. The most frequent cause is osseous in nature and is represented by the os
trigo-num that is an accessory ossicle of the
pos-terior talar tubercle that may remain unfused in up to 7% of the general popu-lation, or by the Stiedas’s process that is a prominent lateral talar tubercle. Among the causes originating in soft tissues, synovi-tis involving the flexor hallucis longus ten-don sheath, the posterior intermalleolar ligament and the posterior synovial recess of the tibiotalar and subtalar joints(1,3,7).
Such type of impingement may present as soft tissues inflammation in the poste-rior ankle, accessory ossicles injury or both. Bone lesions include fracture, fragmenta-tion and pseudoarthrosis of accessory os-sicles or lateral talar tubercle. Soft tissue lesions include posterior and subtalar syno-vitis, as well as tenosynovitis of the flexor hallucis longus(1).
The hallucis longus flexor runs deeply in the gutter between the medial and lateral talar tubercles, and stenosing tenosynovi-tis may develop as it is involved in the pos-terior ankle impingement(1).
MRI demonstrates findings such as os
trigonum, prominent posterior talar process Figure 5. Axial T1-weighted (A) and coronal, fat-suppressed proton-density weighted (B) images
demon-strating isointense tissue in the posteromedial region of the ankle (short arrows) and irregularity on the posteromedial talar surface, with subtle corresponding bone marrow edema (long arrow), characterizing posteromedial ankle impingement.
ligament leads to chronic inflammation, hypertrophic fibrosis and metaplasia.
In many cases, such disorganized fi-brotic tissue may lead to impingement be-tween the medial wall of the talus and the posterior rim of the medial malleolus(1,3).
Magnetic resonance imaging demon-strates the soft tissues thickening and the bone marrow edema of the medial talus and malleolus(1,3) (Figure 5).
Posterior ankle impingement
Posterior ankle impingement corre-sponds to a set of abnormalities resulting from forced repeated or acute plantar
flex-ion. This syndrome is also called os
trigo-num syndrome, talar compression
syn-drome or posterior block of the ankle(1,3,7), and has been extensively described in pro-fessional soccer players as well as in clas-sical ballet dancers(1,3). Such type of im-pingement develops as a result of signifi-cant acute injury, such as avulsion of the posterior talofibular ligament, talar fracture or accessory ossicles injury, but, in most of cases the syndrome onset is insidious in predisposed athletes. It is believed that re-peated forced foot flexion results in chronic bone and soft tissue lesions. The injury mechanism is similar to a “nutcracker
formation not only for confirming the di-agnosis but also to differentiate from other causes of joint pain.
REFERENCES
1. Cerezal L, Abascal F, Canga A, et al. MR imag-ing of ankle impimag-ingement syndromes. AJR Am J Roentgenol. 2003;181:551–9.
2. Hauger O, Moinard M, Lasalarie JC, et al. Ante-rolateral compartment of the ankle in the lateral impingement syndrome: appearance on CT ar-thrography. AJR Am J Roentgenol. 1999;173: 685–90.
3. Robinson P, White LM. Soft-tissue and osseous impingement syndromes of the ankle: role of im-aging in diagnosis and management. Radiograph-ics. 2002;22:1457–71.
4. Rosenberg ZS, Beltran J, Bencardino JT. MR im-aging of the ankle and foot. Radiographics. 2000; 20:S153–79.
5. Wolin I, Glassman F, Sideman S, et al. Internal derangement of the talofibular component of the ankle. Surg Gynecol Obstet. 1950;91:193–200. 6. Bassett FH 3rd, Gates HS 3rd, Billys JB, et al. Talar impingement by the anteroinferior tibiofibu-lar ligament. A cause of chronic pain in the ankle after inversion sprain. J Bone Joint Surg Am. 1990;72:55–9.
7. Karasick D, Schweitzer ME. The os trigonum syn-drome: imaging features. AJR Am J Roentgenol. 1996;166:125–9.
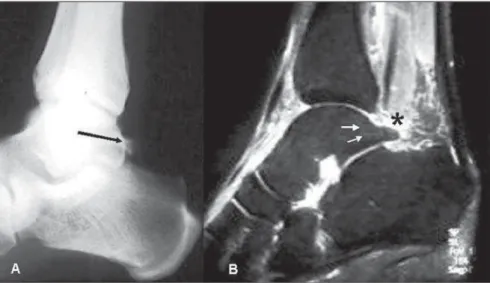
Figure 7. Lateral ankle radiography (A) and sagittal MRI fat-suppressed proton-density-weighted (B) images demonstrate prominent posterior talar process, Stieda’s process (long arrow) with subtle bone marrow edema (short arrows). Additionally, soft-tissue edema is observed between the posterior rim of the tibial epiphysis and the posterior talar process (asterisk).
(Stieda) in association with bone marrow edema, as well as edema or synovitis in the posterior joint recess and adjacent soft tis-sues(1,3,7) (Figures 6 and 7).
Finally, MRI is an excellent method for demonstrating bone and soft tissues abnor-malities in the different types of ankle im-pingement syndrome, providing useful
in-Figure 6. Lateral ankle radiography (A), sagittal STIR MRI sequence (B), and T1-weighted (C) images demonstrating the presence of os trigonum (double arrows) with bone marrow edema. Additionally, bone marrow and soft tissues edema is observed in the posterior portion of the talus (long arrows), between the posterior rim of the tibial epiphysis (double arrows) and the os trigonum (asterisk).