Direct numerical simulation of fixed-bed reactors:
Effect of random packing
Master's Dissertation
by
Carlos André de Moura Teixeira
Developed within the scope of Dissertation subject
Performed at
IFP Energies Nouvelles
FEUP Supervisor: Prof. José Carlos Brito Lopes IFPEN Supervisor: Eng. Matthieu Rolland
Chemical Engineering Department
Research is to see what everybody else sees, and
to think what nobody else has thought.
Acknowledgements/Agradecimentos
I would like to express here my gratitude to all those who provided me, directly or indirectly, the possibility to perform the present work. I am deeply grateful to:
Prof. José Carlos Brito Lopes for his vote of confidence. Without it I wouldn't be part of this project.
My supervisor at IFPEN, Eng. Matthieu Rolland, for his guidance, motivation and knowledge. But mostly for his trust on my work and his enthusiasm for this project Dr. Anthony Wachs for providing me the necessary tools to accomplish this work, for
all the advices on how to use them and for everything he taught me about CFD, Numerical Methods, Programing and Supercomputers.
Dr. Cláudio Fonte for his wise advices. For his company during these five months. But above everything for his friendship.
The PhD student Ferdaous Dorai for the help in integrating me in the project and for teaching me the very first steps on PeliGRIFF.
My dear friends, José Oliveira, Ludovic João, Carlos Silva, and Tiago Soares that always accompanied me during this journey at FEUP. I will never forget you.
I also want to express my gratitude to FEUP and to IFPEN. I owe much to those institutions. To FEUP because of the good professors I had there and for the commitment of
everyone who works there in making our faculty a top-level engineering school.
To IFPEN for offering me the means to accomplish this work that wouldn’t be possible without the cluster ENER110.
Finalmente quero agradecer às pessoas que mais amo:
Aos meus pais e ao meu irmão, Pedro, por todo o amor e apoio que sempre me deram. Estarão sempre no meu coração e no meu pensamento.
À minha namorada, Susana, pelo seu amor. Por toda a paciência que teve durante este difícil período. Por ser a minha fonte de inspiração. Por me fazer mais feliz.
Abstract
Many refining and petrochemical processes involve chemical reaction between a fluid and solid phase in a fixed-bed reactor. The solid phase consists in catalyst particles with a size of a few millimeters and its performance is assessed at lab and pilot scale units. Due to safety and economic reasons, the trend is to reduce the testing unit’s size while the catalyst’s size remains constant. This leads to reactors with a low tube-to-particle diameter ratio
)
5
/
1
(
D
d
p
. In those reactors, the local phenomena are dominant and the homogeneityassumption is no longer valid. For instance the wall effect phenomenon has an important role in the reactor hydrodynamics. Other example of local phenomenon is the packing effect that has a big influence in the transport phenomena and potentially in the reactor performance. In this work, the flow through fixed-bed reactors at low particle Reynolds number is investigated by means of Discrete Element Method (DEM) for packing generation and Direct Numerical Simulation (DNS) for fluid flow.
The aim of the first part of this work is the CFD code’s validation by comparing simulated results with data from well-established cases in the literature. The unit cell approach is employed to simulate flow through structured packed beds of spheres and of cylinders. Grid refinement studies are performed using the Grid Convergence Index (GCI) methodology. In the second part of this work, the more complicated beds where the packing structures vary along the axial and radial directions are simulated. The single phase fluid flow through randomly packed beds of cylinders is studied. Good agreement between Ergun’s pressure drop predictions and simulated results is found.
Velocity distributions were analyzed and three different zones were identified: recirculation zones in the packing's top and bottom and in the wake of the particles, high velocity zones where the void fraction is small and finally, low velocity zones near the particles surfaces. A quantitative analysis of the flow is done by means of probability density functions of the velocity components. This analysis shows that the length to establish the flow through a randomly packed bed is the same as for porosity. The flow’s features found in the present work are similar to those reported in the experimental work of Lebon et al. (1996) and in the numerical study of Rong et al. (2013).
Keywords: Fixed-bed Reactors, Velocity Distribution, Computational Fluid Dynamics, Random
Resumo
Muitos processos petroquímicos e de refinação envolvem reação química entre fluido e sólido num reator de leito fixo. A fase sólida corresponde a partículas de catalisador com alguns milímetros de comprimentos e a sua performance é avaliada em unidades de escala laboratorial ou piloto. Por razões económicas e de segurança, a tendência é reduzir a dimensão destas unidades, enquanto que a dimensão do catalisador permanece inalterada. Esta tendência leva a que a razão entre diâmetro do reator e diâmetro de partícula seja muito baixa
(
1
D
/
d
p
5
)
. Nestes reatores, os fenómenos locais são dominantes e portantoos modelos pseudo homogêneos não são válidos. Por exemplo, o efeito da parede é determinante na hidrodinâmica do reator. Outro exemplo de fenómeno local é o efeito da estrutura do empacotamento, que tem grande influência nos fenómenos de transporte e, consequentemente, no desempenho do reactor.
No presente trabalho, a hidrodinâmica de reatores de leito fixo em números de Reynolds baixo é estudada, combinando o método dos Elementos Discretos para simular o empacotamento com a Simulação Numérica Directa para simular o escoamento.
Na primeira parte do trabalho é validado o código de CFD utilizado, comparando os resultados das simulações com a literatura. Leitos de esferas e de cilindros com empacotamento estruturado são simulados usando a abordagem da célula unitária. Estudos de convergência são efectuados usando a metodologia Grid Convergence Index (GCI).
Na segunda parte deste trabalho, são simulados leitos mais complexos, onde as estruturas variam na direção axial e radial. O escoamento através de leitos de cilindros empacotados aleatoriamente é estudado. A queda de pressão obtida nas simulações está de acordo com as previsões da equação de Ergun.
Com a análise das distribuições de velocidade são identificadas três zonas distintas: zonas de recirculação, nas extremidades do empacotamento e na esteira das partículas; zonas de alta velocidade onde a fração de vazios é reduzida; e finalmente zonas de baixa velocidade, perto da superfície das partículas.
Uma análise quantitativa do escoamento é realizada através da função densidade de probabilidade das componentes da velocidade. Os resultados da análise mostram que o comprimento para estabelecer o escoamento através de leitos aleatórios de cilindros é o mesmo que para a porosidade. As características do escoamento verificadas no presente trabalho são semelhantes às reportadas por Lebon et al. (1996) e por Rong et al. (2013).
Palavras-Chave: Reatores de leito fixo, Distribuição de velocidades, Computação em Fluidos
Declaration of honour
I declare, under honour commitment, that the present work is original and I also confirm that I have used no resources other than those declared.
____________________________________________________ (Carlos André de Moura Teixeira)
i
Table of Contents
1 Introduction ... 1
1.1 Project Description and Objectives ... 3
1.2 Contribution of the Present Work ... 3
1.3 Dissertation outline ... 3
2 State of the Art ... 5
2.1 Correlations for Pressure Drop ... 5
2.2 CFD Simulation of Fixed-bed Reactors ... 6
2.2.1 Flow Hydrodynamics ...6
2.2.2 Flow Hydrodynamics, Heat Transfer and Chemical Reaction Coupling ...7
2.3 Discussion ... 8
3 Methodology of the Present Work ... 9
3.1 The Solver: Governing Equations and Numerical Methods ... 9
3.2 Grid Refinement Studies ... 10
3.3 The Dimensionless Pressure Drop Model ... 11
4 Flow through Structured Packed Beds ... 12
4.1 Simulation Methodology ... 12
4.2 Flow through Structured Packed Beds of Spheres ... 13
4.2.1 Grid Refinement Studies ... 13
4.2.2 Results and Discussion ... 15
4.3 Flow through Structured Packed Beds of Cylinders ... 16
4.3.1 Grid Refinement Studies ... 16
4.3.2 Results and Discussion ... 18
4.4 Remarks ... 19
5 Flow through randomly packed beds of cylinders ... 20
5.1 Simulation Methodology ... 20
5.2 Results and Discussion ... 21
ii
5.2.2 Velocity Distribution ... 24
6 Conclusions ... 31
6.1 Accomplished Objectives ... 31
6.2 Limitations and Future Work ... 32
6.3 Final appreciation ... 32
7 References ... 33
Appendices ... 36
iii
Nomenclature
W
A Ergun semi-empirical coefficient
W
B Ergun semi-empirical coefficient
C Richardson extrapolation constant
D Bed confining tube diameter m
p
d
Particle diameter m E Relative errorF
Force N f Problem solution S F Safety factorg
Gravitational acceleration vector m∙s-2h Grid spacing m K Empirical coefficient 1
k
Coefficient (Reichelt ,1972) 2k
Coefficient (Reichelt ,1972)L Packed bed length m
l Particle lengh m p n Number of particles P Pressure Pa p Order of convergence P Pressure drop Pa ) (x
P Probability density function
r Grid refinement ratio
dp
Re
Particle Reynolds numbert
Time s t Time step su
Velocity vector m∙s-1 U Fluid velocity m∙s-1 SU
Fluid superficial velocity m∙s-1V Volume m3
Greek letters
Porosity
Rate parameter
Fluid dynamic viscosity Pa∙s
Fluid density kg∙m-3
Standard deviationiv
Subscripts and superscripts
p Particle z y x, , Spatial indices Abbreviations CFL Courant–Friedrichs–Lewy number
DEM Discrete Element Method
DLM Distributed Lagrange Multipliers
DNS Direct Numerical Simulation
FD Fictitious Domain
GCI Grid-Convergence Index
HOT High Order Terms
MPI Message Passing Interface
Introduction 1
1 Introduction
Many refining and petrochemical processes involve chemical reaction between a fluid and a solid phase in a fixed-bed reactor. The solid phase consists in catalyst particles with a size of a few millimeters and can have different shapes (sphere, cylinder, pellet, bi-lobular, etc.) (Ancheyta, 2005). The catalyst particles have an important role in the adsorption, chemical reaction and desorption steps (Fogler, 2005). However, a catalytic reaction is not always controlled by those steps but rather by the rate of transport phenomena in the fluid phase which are manly affected by the flow pattern. Therefore, fluid dynamics plays a major role in the overall fixed-bed reactor performance.
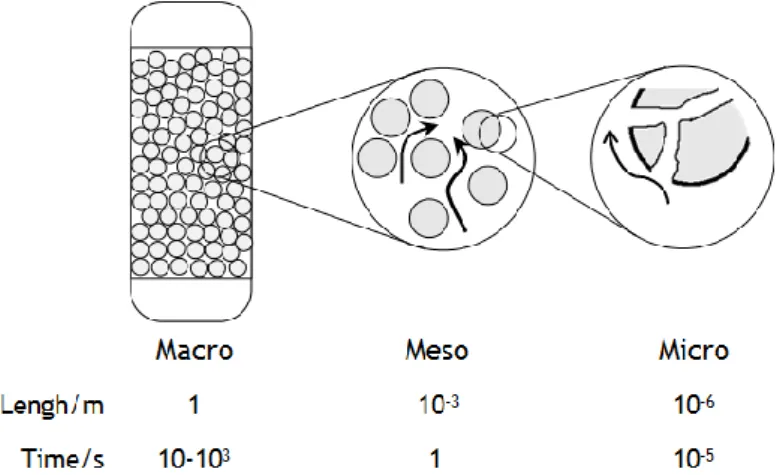
Due to the exponential growth of computer power in the last years, it is possible nowadays to simulate single phase fluid flow in fixed-bed reactors at the lab and pilot scale. Computational Fluid Dynamics (CFD) applied to fixed-bed reactors allow us to gain an insight about the complex phenomena of fluid flow at different length and time scales i.e. micro, meso and macro scale. Figure 1.1 shows the characteristic time and length scales in a fixed-bed reactor (Chakraborty & Balakotaiah, 2005).
Figure 1.1 - Different time and length scales in a fixed-bed reactor.
The knowledge of the three-dimensional (3D) velocity field in packed beds allows the detection of low-velocity zones where the mass exchange is likely to occur through diffusion (Lebon et al., 1996). Such information is of major relevance in performance evaluation of different catalysts (Santos-Moreau et al., 2012). Catalyst evaluation is usually performed at lab and pilot scale. In order to use the lab and pilot unit results directly for up scaling it is mandatory to ensure the same hydrodynamic conditions as in the industrial scale.
Introduction 2
Due to economic and safety reasons, the trend in catalysts performance evaluation is to reduce the size of pilot and lab units (Gierman, 1988; Sie, 1991). Figure 1.2 shows two examples of fixed-bed reactors used at IFPEN to test catalysts.
a) b)
Figure 1.2 - Examples of IFPEN pilot scale reactors. a) D19 mm b) D2.1 mm
In this kind of reactor where the tube-to-particle diameter is low
(
1
D
/
d
p
5
)
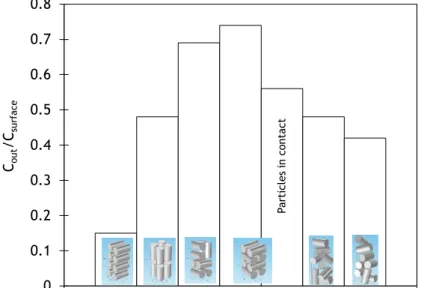
, the localphenomena are dominant and the homogeneity assumption is no longer valid. For instance the wall effect phenomenon has an important role in the reactor hydrodynamics by increasing the porosity near the reactor wall (Eisfeld and Schnitzleinb, 2001). Other example of local phenomena is the packing effect. So far, little information on how the packing structures influence the reactor performance has been published. Rolland (2013) performed a study in a packing of eight cylinders with seven different arrangements where a fluid with zero concentration at the inlet flows through the packed bed in laminar regime. The cylinders with constant concentration in their surface transfer solute to the fluid. Figure 1.3 shows the simulation results for the different arrangements as normalized outlet concentration.
0 0.1 0.2 0.3 0.4 0.5 0.6 0.7 0.8 Cou t /C su rfac e Pa rti cl es in co nt act
Figure 1.3 – Normalized outlet concentration for the different arrangements. Adapted from Rolland (2013).
Introduction 3
The difference in the outlet concentration for each arrangements is a strong evidence that the packing structure has a big influence in the transport phenomena and therefore in the reactor performance.
Compared to an experimental study, a numerical approach to flow through fixed-bed reactors has many advantages. In the particular case of the packing effect on reactor performance it allows to study more parameters then in an experimental study. For instance, it is possible to change the packing structure locally (add or delete particles, expand the bed keeping the same relative position etc.) and analyse its effect on the reactor performance.
1.1 Project Description and Objectives
The present dissertation is part of a project that involves Dorai's PhD thesis "Numerical study
of packing, hydrodynamic and reactivity in fixed-bed pilot rectors" which is currently under
development.
In this work we are interested in the phenomena of single phase fluid flow through fixed-bed reactors at low particle Reynolds number and how the packing structure affects the flow. In addition, we are interested in the techniques and methodologies by which this can be achieved with accuracy and precision in order to be a viable alternative to empirical techniques.
1.2 Contribution of the Present Work
The present works provides detailed information about single phase fluid flow through random packed beds of cylinders using a numerical approach. The amount of information on literature about this kind of packings is scarce as it focuses mostly on packing of spheres. During the internship period, many tools for CFD simulation results analyses were developed. Finally, a contribution in the implementation of the species transport and chemical reaction module on the IFPEN’s code PeliGRIFF was given.
1.3 Dissertation outline
This dissertation is organized as follows:
In Section 2, the state of the art on numerical simulation of fixed-bed reactors and on correlations for pressure drop is presented.
Section 3 describes the general methodology employed in the present work. The CFD solver and the procedure for grid refinement studies are presented.
Introduction 4
Section 4 focuses on flow through structured packed beds of spheres and cylinders using the unit cell approach whereas Section 5 focuses on flow through randomly packed beds of cylinders. Specific aspects of the simulation methodology of each case are described in the respective section.
Finally, on Section 6 conclusions based on the obtained results are drawn. Constrains and recommendations for future work are discussed.
State of the Art 5
2 State of the Art
In this section, a representative list of the current knowledge about numerical simulation of fixed-bed reactors available on literature is presented. Theoretical and experimental correlations for parameters estimation are also presented.
2.1 Correlations for Pressure Drop
Pressure drop in a packed bed is the most important parameter in many industrial applications. Due to its importance, many theoretical and experimental correlations have been proposed during the last century. Even if the most accurate way to determine the pressure drop in a specific packed bed is experimentally, some correlations are accurate enough to predict pressure drop in many engineering applications. They are less time consuming then numerical and experimental methods. However, until now there is no general correlation valid in every case.
The most well know and used correlation for pressure drop is the empirical derived equation proposed by Ergun (1952). This equation states that the pressure drop in a packed bed of spheres arises from a viscous and an inertial energy loss and is given by
2 3 2 3 2
)
1
(
75
.
1
)
1
(
150
S P S PU
d
U
d
L
P
(2.1)where
is the fluid viscosity,
the fluid density,U
S the superficial velocity, dp theparticle diameter and
the bed porosity. Despite its reliable pressure drop predictions in high aspect ratio beds, Ergun equation fails in packed beds where the ratio of tube-to-particle diameter is low (D/dp 10)(Foumeny et al. 1993). This is explained by Foumeny et al.(1993) by fact that Ergun correlation was derived from experiments carried out in packed beds of large diameter ratios where there is no wall effect. In order to fill this gap many correlations that take into account the container walls effect have been proposed.
Reichelt (1972) proposed a semi-empirical correlation based on Ergun correlation to predict dimensionless pressure drop (Baker, 2011). This Ergun-type equation takes into account the wall effect by means of two coefficients and is based in the hydraulic radius theory (Eisfeld and Schnitzlein, 2001). 3 3 2
)
1
(
)
1
(
Re
W W dp WB
A
KA
(2.2)State of the Art 6
whereKis an empirical coefficient and AWandBWare the wall correction terms and are given
by,
)
1
)(
/
(
3
2
1
p Wd
D
A
(2.3) and 2 2 2 1 k D d k BW p (2.4)where
k
1 andk
2are two empirical parameters. There are many more available correlations in the literature. However, the two correlations mentioned above are representative. Actually, most of them are an Ergun type equation with only a few modifications in the fitting parameters. It's important to remark that in some cases the predictions from different correlations for the same conditions differ in 50%.2.2 CFD Simulation of Fixed-bed Reactors
In the past decades the use of CFD to simulate single phase flow through fixed-bed reactors has been reported in the literature. Results of simulations done under a wide range of operating conditions with different geometries and using several numerical approaches are available.
2.2.1 Flow Hydrodynamics
The amount of experimental and empirical correlations available in the literature and its ease experimental measurement made the pressure drop one of the most important parameters in the CFD study of fixed-bed reactors.
Zeiser et al. (2002) analysed the flow field through packed beds using the Lattice Boltzmann method with a parabolic velocity profile in the inlet and constant pressure at the outlet as boundary conditions. Several low aspect ratio (D/dp 3) packed beds were analysed by
showing that the actual length of the flow paths change considerably with the radial position. Reddy and Joshi (2008) study low aspect ratio (D/dp 5) fixed-beds of 151 spherical
particles arranged in 8 layers. Drag coefficients and pressure drop through the packing to a particle Reynolds numbers range (Redp)from 0.1 to 10,000 were monitored. In their study,
the fluid domain is restricted to the packing zone, in other words, no flow distributor at the inlet and no bed limiter at the outlet were simulated. This model could be unreliable, as the
State of the Art 7
boundary condition imposed in the inlet is a flat velocity profile that has no time to “deform” before it arrives to the packing zone.
Bai et al. (2009) coupled the discrete element method (DEM) with CFD to model a fixed-bed reactor with low tube-to-particle diameter ratios(D/dp 4). Simulations with spherical and
cylindrical particles packed randomly and structured were performed in cylindrical and square ducts. Numerical data was compared with both laboratory and pilot-scale experiments. The packed bed steady-state hydrodynamics was simulated by solving the Reynolds-averaged Navier–Stokes and mass conservation equations.
Baker et al. (2011) used image based meshing software to create geometries from 3D Magnetic Resonance Imaging scans of packed beds of cylinders for use with CFD. Their computations show that the Finite Volume method is a viable alternative to Lattice Boltzmann method and the numerical results for pressure drop are in good agreement when compared with experimental data of the exact geometry.
Eppinger et al. (2011) performed 3D CFD simulations in laminar, transitional and turbulent flow regime for tube-to-particle diameter ratios of 3D/dp 10. The packing was generated
using a DEM code. A new meshing method that uses a low number of cells per particle (~104) was validated, verifying if the results obtained were in agreement with results from literature.
Rong et al. (2013) studied the effect of porosity in flow through packed beds of uniform spheres using the Lattice Boltzmann method. In their study, they concluded that the porosity affects significantly the velocity distribution especially for flows at low Reynolds numbers.
2.2.2 Flow Hydrodynamics, Heat Transfer and Chemical Reaction Coupling
Due to the limited success in coupling Navier-Stokes equations with species and energy conservation equations, the number of works published with chemical reaction is smaller. Dixon and Nijemeisland (2001) proposed CFD as a design tool for fixed-bed reactors with low tube-to-particle diameter ratio (D/dp 2andD/dp 4) and discussed some challenges such
as the generation of representative bed geometries and formulation of models for laminar and turbulent flows. Some simplified 3D models of fluid flow, heat transfer, and chemical reaction were presented but no results were compared with theoretical predictions or experimental data. In their next work, Nijemeisland and Dixon (2001) simulated fluid flow and heat transfer in a low tube-to-particle diameter ratio cylindrical bed with 44 spheres. Simulated and experimental results were compared and good agreement was obtained in laminar and turbulent regimes.
State of the Art 8
Freund et al. (2003) developed a 3D model using Monte-Carlo method to simulate the packing of spheres inside a cylindrical tube and Lattice Boltzmann method to simulate fluid flow, heat transfer and chemical reaction. Direct simulations were performed in low tube-to-particle beds and local inhomogeneities were found. Radial velocity profiles were compared with experimental data found in literature and good agreement was observed.
Recently, Zhou et al. (2013) simulated the acetone hydrogenation in a fixed-bed reactor
packed with a few dozens of spherical catalyst particles using the Finite Volume method.The effects of inlet gas velocity and particle diameter on hydrogenation reaction were studied. Navier-Stokes equations were coupled with energy and mass equations in the gas phase and with energy equation in the solid phase.
2.3 Discussion
Computational Fluid Dynamics predictions for pressure drop are in better agreement with experimental data then empirical and theoretical correlations.
In most of the published works, the ratio of tube-to-particle diameter is low (D/dp 10).
This has to do with the complex geometries of high aspect ratio beds and the big number of cells needed to represent the flow domain. A bigger number of cells means more computer power to solved the problem in a reasonable time frame. In fixed-beds with low tube-to-particle diameter ratios is also where the pseudo-homogeneous models limitations are bigger due to the local phenomena (Tang et al., 2004).
Regarding the CFD method employed, the Lattice Boltzmann method is considered the benchmark for simulations of single phase fluid flow through packed beds. However, many authors have been employed the Finite Volume method successfully.
The coupling of flow Hydrodynamics, Heat Transfer and Chemical Reaction on CFD was been applied with limited success in very small cases (dozens of spheres) when compared with works where only the flow hydrodynamics is simulated.
Methodology of the Present Work 9
3 Methodology of the Present Work
In this section is done a brief description of the CFD solver and the followed strategy to choose the required grid resolution is explained. The way the results are presented is described as well. Further details about specific methodologies employed in each case are described in the respective section.
It’s important to remark here that by Direct Numerical Simulation (DNS) should be understood as the numerical solution of the exact initial value problem of fluid flow through fixed-bed reactors.
3.1 The Solver: Governing Equations and Numerical Methods
The three dimensional, unsteady and incompressible fluid flow is simulated by solving the Navier-Stokes equations using the IFPEN’s code PeliGRIFF (Parallel Efficient LIbrary for GRains in Fluid Flows). The governing equations are given by
0 u (3.1) F g u u u u
2 ) ( P t (3.2)where
u
is the velocity vector, Pthe pressure,g
the gravitational acceleration and F is apseudo body force that accounts for solid/fluid interaction as described below (Bird et al., 2006). At the particle level, PeliGRIFF uses a DLM/FD method (Distributed Lagrange Multiplier/Fictitious Domain) to simulate the fluid-solid interactions (Wachs, 2010). With the fictitious domain method the Navier-Stokes equations for fluid are solved in the entire domain (fluid and solid). The interior domain of the immersed particles are filled with the same Newtonian fluid as the surroundings and a pseudo body forceFis introduced by the Lagrange
multiplier to constrain the fluid inside particles (fictitious) to rigid body motion (Yu et al., 2006). In other words, a forceF determined by the Distributed Lagrange Multipliers, is added
to the right hand side of equation 3.2 in order to force the velocity and pressure to be zero inside the solid domain. Inside the fluid domain the body force is zero. The DLM/FD method is implemented with the Finite Volume method on structured cartesian grids.
To ease convergence, PeliGRIFF solves all problems as unsteady. The steady-state solution corresponds to the time-converged solution with steady boundary conditions. A constant time step is employed and if it isn't small enough to fulfill the CFL condition (Courant–Friedrichs– Lewy), the solver uses adaptative time step algorithms.
Methodology of the Present Work 10
All the codes implemented on PeliGRIFF are fully-parallel using MPI (Message Passing Interface) standard and are able to run on supercomputers (Wachs, 2013).
3.2 Grid Refinement Studies
In the absence of an analytic solution, it is important to be able to estimate the uncertainty associated with a CFD calculation. The goal of the grid refinement studies performed in the present work is estimate the relative error associated with a given grid spacing in order to choose a resolution that gives acceptable solutions in a particular problem. The solution relative error is defined as
ref ref f f f E (3.3)
where f represents the solution for a given refinement level and fref is a reference solution
that can be either the analytic (exact) solution or either a solution obtained with a very fine mesh. To perform this kind of analysis it is necessary to compute the solution of a particular case in two or more grids differing in the refinement level. The methodology followed was the Grid Convergence Index (GCI) proposed by Roache (1997) which is based on the Richardson extrapolation. For an arbitrary order of convergencepand using a grid refinement
ratio
r
h
2/ h
1 the exact solution of a particular problem is given by . . . 1 2 1 1 HOT r f f f fexact p (3.4)where h is the grid spacing, H.O.T stands for high order terms and the indexes 1 and 2
represent the fine and the course grid respectively (Roache, 1997).
Every CFD code has a theoretical order of convergence however, due to several reasons such as the boundary conditions, meshing method and geometry this order can be reduced to an
observed order of convergence (Roache, 1997). For that reason is important to compute
several solutions with different refinement levels in order to observe the behavior of the solution error. The error as a function of grid spacing is given by the Richardson extrapolation,
.
.
. T
O
H
Ch
E
p
(3.5)whereCis a constant. Neglecting the high order terms and applying log to equation 3.5 the
order of convergencepcan be obtained from the slope of the curve log( E)versus log( h) ) log( ) log( ) log(E C p h (3.6)
Methodology of the Present Work 11
Using the observed order of convergence, the GCI of the fine grid solution is then computed as 1 S p r E F GCI (3.7)
where
F
S is a safety factor and is generally taken to be 1.25 (Roache, 1997). The GCI is ameasure of how far the computed value is away from the value of the asymptotic numerical value and it indicates how much the solution would change with a further refinement of the grid (Roache, 1997).
Due to the computational cost grid convergence studies were only performed in the cases with only one particle. However, it is possible to extrapolate the information obtained from the small cases i.e. flow through a cubic packing of particles to randomly packed beds of hundreds of particles. For instance, the grid resolution dp/h should be the same in the case
of flow through a cubic packing of spheres and in the case of flow through a random packed bed of spheres in order to have the same accuracy.
3.3 The Dimensionless Pressure Drop Model
To compare results from different experiments and simulations is useful to represent the pressure drop across the bed in its dimensionless form (Baker, 2011). Applying the Buckingham Pi Theorem to the steady flow of an incompressible Newtonian fluid through a packed bed the following relationship is found
)
(Re
dpf
(3.8)where
is the dimensionless pressure drop and is given by2
U
L
Pd
p
(3.9)and Redpthe particle Reynolds number
p dp Ud Re (3.10)This relationship is valid for any combination of packed bed and incompressible Newtonian fluid and is also independent of the system scale (Munson et al. 2012). Although it includes the particle diameter and the tube length it doesn’t take into account the effect of the bed’s porosity which is a measure of how big is the resistance to the fluid flow through the porous media.
Flow through Structured Packed Beds 12
4 Flow through Structured Packed Beds
The aim of this part of the work is to validate the CFD code by comparing our results with the data published by Hill et al. (2001). The unit cell approach employed here also provides insight about large packed beds. However, some issues related with this approach must be considered namely the fact that the flow symmetry around a particle is only verified in low and moderate Reynolds numbers (Gunjal et al., 2005).
4.1 Simulation Methodology
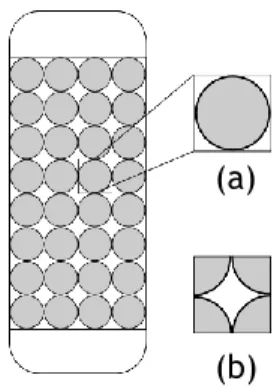
The fixed-beds reactors considered in the first part of this work were structured packed beds. In this packing regime, the entire bed can be represented by a unit cell. For each case, the unit cell was created by placing a particle in the center of a cube with periodic boundary conditions implemented in all directions. A packed bed formed by the simple cubic arrangement and its unit cells is represented in figure 4.1.
Figure 4.1 - A packed bed of simple cubic arrangement of spheres. a) Unit cell b) Alternative representation of a simple cubic unit cell.
The porosity of the unit cell is given by
cell p p
V
V
n
1
(4.1)where np is the number of particles inside the unit cell (one particle for simple cubic
arrangement),Vp and
V
cell are the particle and unit cell volumes respectively.As the pressure is not periodic, a constant pressure gradient was applied over the unit cell in the flow direction. The applied constant pressure drop forces the fluid, initially at zero velocity, to flow. The inlet velocity increases until it becomes constant (i.e. steady state). The steady state solution was used to compute the dimensionless pressure drop as a function of the particle Reynolds number. For the arrays of cylinders, the orientation effect was
(a)
Flow through Structured Packed Beds 13
investigated in three different arrangements classified according the angle between the flow direction and the cylinder longitudinal axis.
Studies on the influence of time step on the solutions relative error were performed by others project collaborators. Based on those studies a time step of 2
10 2
t s was employed with
the conditionCFL0.5 in both cases (arrays of spheres and cylinders).
Each computation took from 2 to 3 hours of CPU time in one processor (Intel Sandy Bridge, 3.5 GB RAM)
4.2 Flow through Structured Packed Beds of Spheres
To validate the PeliGRIFF code and the employed simulation methodology in single phase flow through packed beds, simulations in ordered arrays of spheres at low-to-moderate Reynolds numbers were performed. The predicted values for the dimensionless pressure drop across a simple cubic array of spheres were compared with the Lattice Boltzmann simulations results of Hill et al. (2001).
4.2.1 Grid Refinement Studies
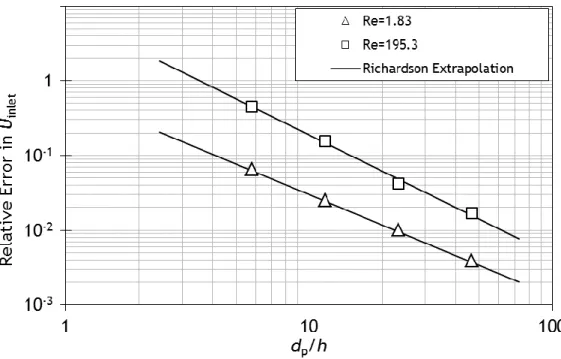
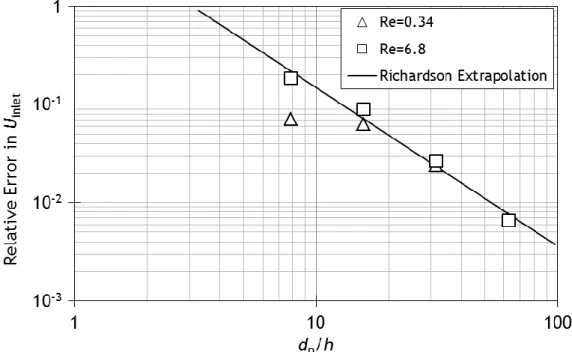
To estimate the solution error, convergence studies were performed at particle Reynolds numbers in the range of interest (1 to 250) of the present work. Figure 4.2 shows the relative errors in the inlet velocity for different particle Reynolds numbers as a function of the grid resolution(dp /h).
Figure 4.2 - Relative error in the inlet velocity as a function of the grid resolution(
0.799).Flow through Structured Packed Beds 14
The lower particle Reynolds number requires less grid resolution to get converged solution than the higher one. To describe the flow at Redp 195.3 with a relative error in pressure
drop less than 5% it is necessary a resolution of about 23 cells per particle. Even if for the smaller Redpthe required resolution to have the same error is less than 23, this value was
used in all simulations once the computational cost is small in this particular case.
In low porosity packed beds, the solution is constrained by the maximum resolution available in the void space between particles (Kanarska et al., 2011). Figure 4.3 shows relative errors in the inlet velocity in a more densely packed bed(
0.507).Figure 4.3 - Relative error in the inlet velocity as a function of the grid resolution
(
0
.
507
)
.A comparison between Figures 4.2 and 4.3 shows that for a particle Reynolds number of the same order of magnitude, the bed more densely packed needs a higher grid resolution to have the same relative error. A grid resolution of 30 cells per particle would be necessary to describe the flow with a relative error in pressure drop less than 5%.
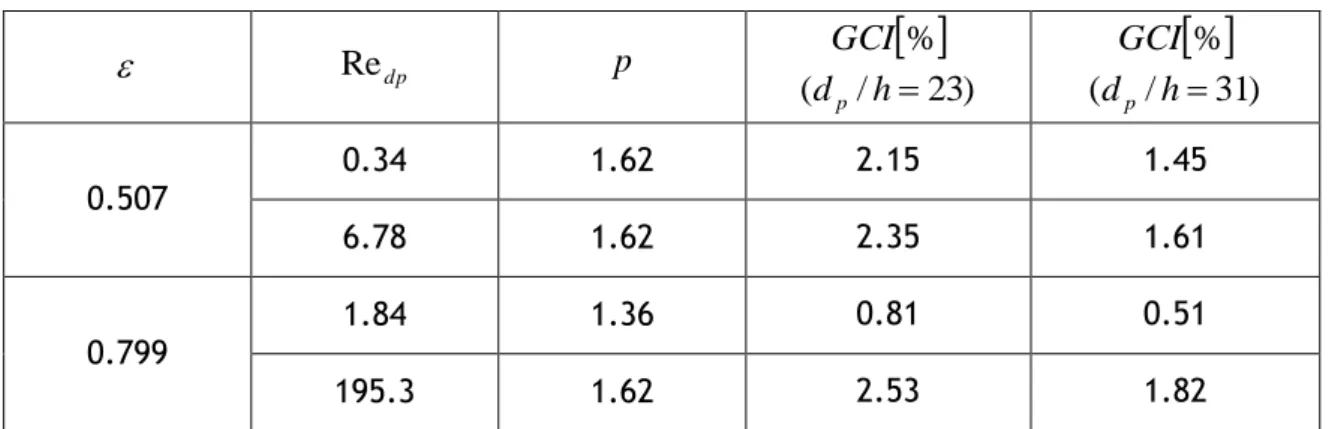
The grid convergence results are summarized in table 4.1. The analysis of the GCI shows
that the level of uncertainty is less than 5% with a grid resolution of 23 or 31 cells per particle in both cases.
Flow through Structured Packed Beds 15
Table 4.1 - Grid convergence results for flow through the simple cubic array of spheres.
Redp p
%
GCI
) 23 / (dp h
%
GCI
) 31 / (dp h 0.507 0.34 1.62 2.15 1.45 6.78 1.62 2.35 1.61 0.799 1.84 1.36 0.81 0.51 195.3 1.62 2.53 1.82Note: The observed orders of convergence p are the slopes of Richardson extrapolations on
figures 4.2 and 4.3.
4.2.2 Results and Discussion
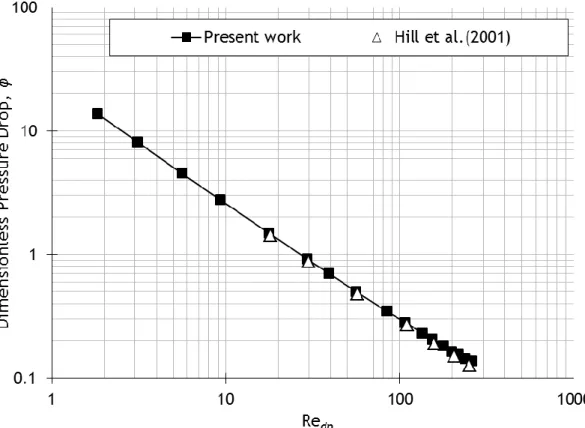
In this section are presented the predicted values for the dimensionless pressure drop across a structured packed bed of spheres as a function of particle Reynolds number and compared with the results from Hill et al. (2001). The data from Hill et al. (2001) is presented here as dimensionless pressure drop however, it was originally in terms of drag force. Figure 4.4 shows the spatial distribution of x-velocity normalized with the inlet velocity. The flow is in the
x
direction.Figure 4.4 - Spatial distribution of x-velocity normalized with the inlet velocity at the unit cell central plane(
0.799 and Redp 4.65).Flow through Structured Packed Beds 16
Figure 4.4 shows a comparison between the present work results and the Lattice Boltzmann simulations (Hill et al., 2001).
Figure 4.5 - Comparison between the simulated dimensionless pressure drop and results from Hill et al. (2001) for a dilute array of spheres (
0.799).Besides a small discrepancy in the higher Reynolds number (Redp 250), the overall results of
the present work are in good agreement with the results from Hill et al. (2001).
4.3 Flow through Structured Packed Beds of Cylinders
In packed beds of cylinders, the number of parameters that affects the flow is larger than in packed beds of spheres. For instance, the cylinder aspect ratio (l/dp) and its orientation
relative to the flow direction have an important role in important flow parameters such as pressure drop.
4.3.1 Grid Refinement Studies
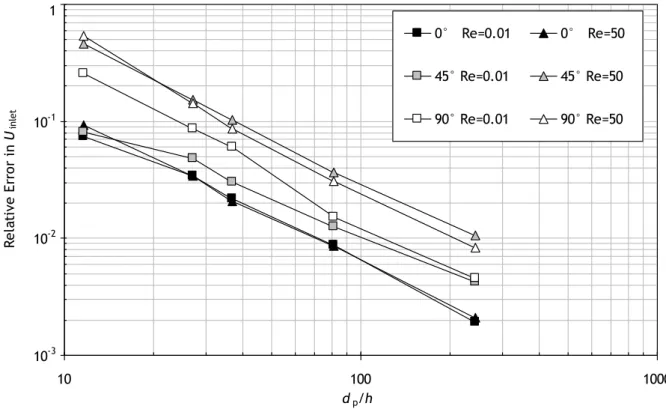
For the reasons mentioned above, grid refinement studies were performed in different configurations. Figure 4.6 shows the relative error in the inlet velocity as a function of the grid resolution for three different orientations, 0°, 45°, and 90° between the flow direction and the cylinder longitudinal axis.
Flow through Structured Packed Beds 17 1 10-1 10-2 10-3 10 100 1000 dp/h Re la ti ve E rr or i n Uinl et 0° Re=0.01 0° Re=50 45° Re=0.01 45° Re=50 90° Re=0.01 90° Re=50
Figure 4.6 -Relative error in the inlet velocity as a function of the grid resolution
799 . 0
(
and l/d 1).As shown in figure 4.6, the solution error depends on the cylinder orientation. To describe the flow in every case it is necessary a minimum resolution of about 40 cells per particle.
The grid convergence results are summarised in table 4.2. The analysis of the GCI shows
that the level of uncertainty is less than 10% with a grid resolution of 25 or 40 cells per particle in both cases. The convergence rate is smaller for arrays of cylinders than for spheres.
Table 4.2 - Grid convergence results for flow through the simple cubic array of cylinders.
Cylinder Orientation Redp p [%] GCI
25
/
h
d
p [%] GCI40
/
h
d
p 0° 10 -2 1.30 1.9 0.8 50 1.22 2.0 0.8 45° 10 -2 1.09 3.4 1.4 50 1.22 9.7 3.5 90° 10 -2 1.37 4.8 1.2 50 1.28 7.6 2.7Flow through Structured Packed Beds 18
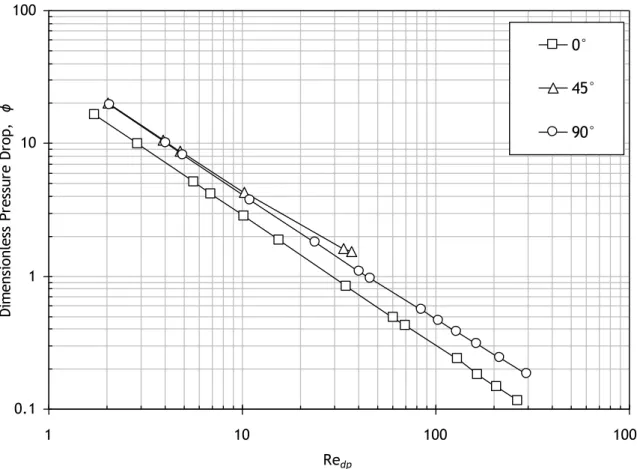
4.3.2 Results and Discussion
No published results of three dimensional simulations of fluid flow through ordered arrays of cylinders were found in the literature in order to compare with the present work results. Figure 4.7 shows the dimensionless pressure drop as a function of the particle Reynolds number for three different orientation angles between the flow direction and the cylinder longitudinal axis. 0.1 1 10 100 1 10 100 1000 Redp D im en si on le ss P re ss ur e D ro p, ϕ 0° 45° 90°
Figure 4.7 - Effect of cylinders orientation on Dimensionless Pressure Drop.
799 . 0
(
and l/d 1).The pressure drop in a cubic array of cylinders is dependent on its relative orientation to the flow direction by a factor lower than 2 (depending on the Reynolds number). In this study, the cylinder aspect ratio (l/dp) is equal to one which means that the projected areas in the
0° and 90° cases are equal. So, the dependency of pressure drop on the orientation should be higher in packings of cylinders with aspect ratio l/d 1 once the projected area is different
in each orientation.
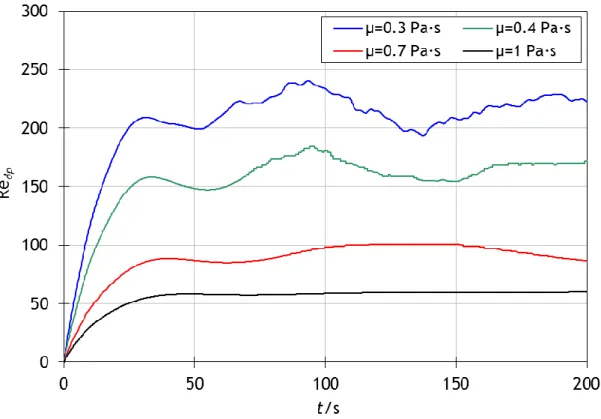
Figure 4.8 shows the particle Reynolds number time evolution for different fluid viscosities when a constant pressure gradient is applied for the 45°orientation case.
Flow through Structured Packed Beds 19
Figure 4.8 -Particle Reynolds number as a function of time
(
P
10
Pa)
.As shown by the figure 4.8 transition to time oscillatory and chaotic flow was verified at
60 Redp .
4.4 Remarks
Important remarks for the next part of the work should be done.
The validation case considered above is well established. The good agreement between the present work results and literature confirms that the methodology used and the CFD code are valid. In addition, PeliGRIFF was validated with two other cases from the literature (Zick and Homsy, 2006; Kanarska et al., 2011) by Dorai (2013).
In order to achieve an uncertainty less than 10%, a grid resolution of 40 cells per particle will be used in next section to simulate single phase fluid flow through randomly packed beds of cylinders.
Flow through randomly packed beds of cylinders 20
5 Flow through randomly packed beds of cylinders
In this section, the method was used to study the fluid flow in more complicated beds where the packing structures vary along the axial and radial directions.
5.1 Simulation Methodology
The methodology followed to simulate the flow through randomly packed beds of particles is described below. The first step was the DEM simulation using the IFPEN code GRAINS3D to create a random packed bed of cylinders (Wachs et al., 2012). In the packing simulation, a certain number of particles are dropped inside a container from a specified height. Then the DEM code simulates the dynamic and static behaviour of the particles falling due the gravity until they reach the steady state i.e. the velocity of each particle is zero. The container’s bottom is defined by a solid plane and periodic boundary conditions were implemented in its side walls. Appendix A shows snapshots of a DEM simulation. Once the packed beds were simulated using DEM by applying Newton’s laws to each particle, they are all mechanically stable. PeliGRIFF imports directly the generated geometries for the CFD simulations. A fluid domain containing the packing is defined and then discretized in the three directions with the same grid spacing. The created cartesian grid is fine enough so that the resolution is
40 /h
dp . This value was defined based on the convergence studies performed on the flow
through a simple cubic packing of cylinders (see section 4.3.1). Figure 5.1 shows a schematic diagram of a fixed-bed reactor.
Flow through randomly packed beds of cylinders 21
Periodic boundary conditions were implemented in the same directions as in the DEM simulation. A uniform and constant velocity was defined in the inlet which corresponds to particle Reynolds numberRedp 1. At the outlet a constant pressure was defined. To
minimize the boundary conditions influence at the inlet and outlet, the fluid domain was extended by three particle diameter up and downstream of the packing. Simulations in a packing of 85 particles were performed and the results confirms that this length is long enough to make pressure drop independent on the inlet and outlet zone lengths. Pressure drop over the fixed-bed
(
P
P
1
P
2)
was computed with area averaged values at thepacking top and bottom (figure 5.1) and monitorized during the simulation in order to verify if the steady state was reached.
A time step of 3
10
t s was employed and a maximum CFL number of 0.5 was chosen.
5.2 Results and Discussion
Three packed beds were created with different properties. Table 5.1 summarizes the parameters of the generated packed beds. For each case, an ID is attributed.
Table 5.1 -Properties of the generated fixed-beds of cylinders
Case ID FBR1 FBR2 FBR3 p n 540 200 100 p
d
l /
2 1 2
0.451 0.444 0.467The number of particles np and the cylinders aspect ratiol /dp are input parameters in the
DEM simulation. On the other hand, the porosity is a consequence of the DEM simulation. It cannot be fixed for the same reasons as in an experimental situation where a certain number of particles are dropped into a container.
Figure 5.2 shows the packed beds investigated. The box represents the fluid domain and some particles are out of it due to the periodic boundary conditions implemented in the side wall.
Flow through randomly packed beds of cylinders 22
(a) (b) (c)
Figure 5.2 - Random packed beds of cylinders studied in the present work. Flow direction is from the bottom to the top. a) Case FBR1 b) Case FBR2 c) Case FBR3
In table 5.2 the grid parameters and computing times on 128 processors (Intel Sandy Bridge, 3.5 GB RAM/processor) for each case are listed.
Table 5.2 - Grid parameters and computing times on 128 processors (Redp 1).
Case ID FBR1 FBR2 FBR3 Grid 256256768 200200600 200200720 N° of cells 50 6 10 24 6 10 29 6 10 h dp / 40 40 40
Total CPU time/ hours 240 80 96
The simulations results will be analysed in terms of pressure drop and velocity distribution in the sections bellow. The flow pattern in one of the studied cases is represented as flow streamlines in figure 5.3.
Flow through randomly packed beds of cylinders 23
Figure 5.3 - Flow pattern shown as flow streamlines. Case FBR3.
5.2.1 Pressure Drop
In figure 5.4, a comparison between the predictions of Ergun correlation and the simulation results is done. The dimensionless pressure drop for each studied fixed-bed at
Re
dp
1
isrepresented as a function of the porosity.
Figure 5.4 - Dimensionless pressure drop as a function of porosity (Redp 1). Comparison
Flow through randomly packed beds of cylinders 24
The Ergun correlation (eq. 2.1) pressure drops predictions match well with the CFD results. The higher relative error (5%) between CFD and Ergun correlation predictions is within the desired range (10%). This good agreement is somehow an evidence of the CFD model validity. Although, a larger error wouldn’t invalidate the model once Ergun correlation was derived for packed beds of spheres.
5.2.2 Velocity Distribution
An important characteristic of the flow through a fixed-bed reactor is its velocity distribution. A general overview is shown in figure 5.5. The local velocity component in the flow direction normalized with the inlet velocity is displayed.
Figure 5.5 – Spatial distribution of axial velocity normalized with the inlet velocity at the beds central plane. Case FBR1 (
0.451 and Redp 1).Three different zones can be identified from the analysis of figure 5.5:
Recirculation zones in the packing top and bottom, with negative velocities in the wake of the particles.
High velocity zones where the void fraction is small and the velocity increases up to a factor of 15.
Flow through randomly packed beds of cylinders 25
For further knowledge about the parameters that influence the velocity distribution, a quantitative analysis should be done rather than the qualitative analysis provided by figure 5.5. In this work, a statistical approach was used to describe the flow field. The results are presented in terms of probability density distribution of the normalized velocity components,
)
/
(
U
U
inletP
. The functionP
(
U
/
U
inlet)
is normalized so that
P(U/Uinlet)dU 1 (5.1)With the previous analysis was expected that the velocity distributions at the inlet and outlet zones were different than the rest of the packing. To verify the difference in those zones and how the velocity distribution varies along the fixed-bed, the packing was splitted in sixteen zones with equal size. Figure 5.6 shows the axial velocity distribution normalized by the inlet velocity in each zone.
0 0.2 0.4 0.6 0.8 1 1.2 1.4 -2 0 2 4 6 8 10 Uz/Uinlet P (U z /U inl et ) Inlet Z2 Z3 Z4 Z5 Z6 Z7 Z8 Z9 Z10 Z11 Z12 Z13 Z14 Z15 Outlet Entire Domain
Figure 5.6 - Probability density functions of normalized z-velocity in different zones of the fixed-bed. Zones are numbered from the bottom to the top. FBR1(
0.451 and Redp 1).The distribution in all zones, besides inlet and outlet zones are very similar to the distribution in the entire bed. This fact leads to conclude that the packing arrangement in a large random packed bed doesn’t seem to have a strong influence on the velocity distribution. This conclusion would not be valid for finite packed beds with low particle-to-tube diameter ratio. Furthermore, the deviations in the inlet and outlet zones can be explained by the axial average porosity represented in figure 5.7.
Flow through randomly packed beds of cylinders 26 0.35 0.45 0.55 0.65 0.75 0.85 0 0.2 0.4 0.6 0.8 1 z/L P or os it y, ε
Figure 5.7 – Axial average porosity profile (Case FBR1)
The inlet zone porosity is slightly larger than the mean porosity (
0.451) which leads to avery small difference in the velocity distribution. The outlet zone is a high void fraction zone(
0.822) and its velocity distribution shows an additional peak. This phenomenon wasverified in packed beds of spheres by Rong et al.(2013). In their study, Rong et al.(2013) report the appearance of the secondary peak in the z-velocity distribution when the porosity is greater than 0.74 at Redp 1. In the same study is also reported that the porosity has no
Flow through randomly packed beds of cylinders 27
Figure 5.8 shows the normalized z-velocity distribution of the different packed beds analyzed.
Figure 5.8 - Probability density functions of normalized z-velocity for different porosities(Redp 1).
Apparently there is no direct relationship between porosity and the peak height. The z-velocity distribution might also depend on other factors such as the particle geometry. The shape of P(U/Uinlet) can be understood in terms of the main flow features identified in the
velocity spatial distribution analysis. The low velocity zones near the particles surface are the main responsible for the distributions peak. It's important to remark that due the periodic boundary conditions implemented in the
x
andy
directions there are no wall effects on thevelocity distribution. This means that the particles surface is the main contributors for low velocity zones. Recirculation zones are included in the negative part of the distribution. High velocity zones are represented by the long tail which decays gradually.
Flow through randomly packed beds of cylinders 28
Figure 5.9 shows the normalized x-velocity distribution of the different packed beds analysed.
Figure 5.9 - Probability density functions of normalized x-velocity for different porosities(Redp 1).
In contrast with the axial direction, the flow in the transverse direction appears to be a random phenomenon. The velocity distribution is symmetric, the average is zero, and the distribution decays fast as expected. The peak’s height does not show an evident relationship with porosity. However, a qualitative analysis can be done. The transverse flow results from the opposition made by the particles to the flow in the axial direction. If the space between particles is wide, i.e. high porosity, the fluid doesn’t have to flow in the transverse directions in order to bypass the particles and to achieve the packing outlet. This means that the distributions peak of the transverse velocity components in a high porosity packing should be higher than in a more densely packed bed.
Flow through randomly packed beds of cylinders 29
Figure 5.10 shows the normalized velocity magnitude distribution for the three packed beds analysed. 0 0.2 0.4 0.6 0.8 1 1.2 1.4 0 2 4 6 8 10 12 14 U /Uinlet P (U /U in le t ) FBR1 (ε= 0.451) FBR2 (ε=0.444) FBR3 (ε=0.467
Figure 5.10 – Probability density function of normalized velocity magnitude for different porosities (Redp 1)
A comparison between the z-velocity and velocity magnitude distributions (figures 5.8 and 5.10) highlights the prominent role of the flow in the axial direction.
Lebon et al. (1996) found good agreement between lognormal function with the experimental data near the peak. However, they report a better fitting of an exponential function on the decay zone. Their experimental study was done in packed beds of spheres but in the present
work with packed beds of cylinders, similar conclusions can be draw. The lognormal and exponential distribution functions were fitted to the numerical results and are given by
2 2 2 / ) / ln(2
)
/
(
1
)
/
(
in let in let U U U U inlet inlete
U
U
U
U
P
(5.2) ) / ( ) / ( U Uinlet inlet e U U P
(5.3)where
is the standard deviation, U /Uinlet the mean normalized velocity magnitude and
is the rate parameter (Ross, 2009). Figure 5.11 shows the probability density function of normalized velocity magnitude and the lognormal and exponential distribution fittings for case FBR1.Flow through randomly packed beds of cylinders 30 0 0.2 0.4 0.6 0.8 1 1.2 1.4 0 2 4 6 8 10 12 14 U /Uinlet P (U /U in le t) FBR1 (ε= 0.451) lognormal exponential
Figure 5.11 - Probability density functions of normalized velocity magnitude. Lognormal and exponential pdf fitting. Parameters:
0,
2.26,
0.33.As reported in the literature by several authors (Lebon et al., 1996) there is no distribution that fits the entire velocity range. In the present work, besides the identification of two distinct zones that are described by to different probability distributions, another zone between normalized velocity magnitude equals to 0.5 to 4 is found. In this particular zone, the lognormal and exponential functions don't fit to the simulation results.
Conclusions 31
6 Conclusions
Flow through fixed-bed reactors was investigated. The employed methodology was validated by comparing the simulations results with well-established case studies available in the literature. The results demonstrate that the IFPEN’s code PeliGRIFF can solve single phase fluid flow through fixed-bed reactors with effectiveness.
The unit cell approach was used to simulated fluid flow through simple cubic packed beds of spheres and of cylinders. Grid refinement studies were performed and the results were extrapolated to case where the computational cost of a grid refinement study would be prohibitive. A parametric study has shown that the observed order of convergence is a function of, Redp,
,and particle geometry. The effect of cylinder’s orientation on pressuredrop was studied. Transition from steady laminar flow to time oscillatory and chaotic flow was observed at Redp 60.
In randomly packed beds of cylinders, good agreement between Ergun’s pressure drop predictions and simulation results were found. Velocity distributions were analysed and three different zones were identified: recirculation zones with negative velocities in the packing top and bottom and in the wake of the particles, high velocity zones where the void fraction is small and the velocity increases up to a factor of 15 and finally, low velocity zones near the particles surfaces. Velocity distributions appear to follow average local porosity so that the length to establish the flow is identical to the length to establish the porosity. The flow’s features found in the present work are similar to those reported in the experimental work of Lebon et al. (1996) and in the numerical study of Rong et al. (2013).
6.1 Accomplished Objectives
The overall objectives outlined for this work were:
To study the phenomena of fluid flow through fixed-bed reactors at low particle Reynolds number and how the packing structure affects the flow.
Development of techniques and methodologies by which this can be achieved with accuracy and precision in order to be a viable alternative to empirical techniques. Based on the conclusions stated above it is fair to say that the objectives of the present work were successfully achieved.
Conclusions 32
6.2 Limitations and Future Work
The main limitation found in the present work was the Fictitious Domain points, i.e. points inside the particles that make the analysis of simulations results a complex task. Actually, in some cases it is impossible or inaccurate. To overcome this limitation, is currently under development an algorithm that computes a porosity field. Thus it will be easy to know if a point is in the solid or fluid domain (or intermediate).
The present work offers insight about single phase fluid flow through fixed-bed reactors. Still, no studies on mass transfer and chemical reaction were performed. Since the species transport and chemical reaction module was implemented on PeliGRIFF the following future work can be suggested:
Validation of PeliGRIFF on Mass Transport with the so-called Taylor-Aris dispersion problem for which an analytical solution is known (Bird et al., 2006). This simple case can provide a first way of validation.
For further validation on Mass Transport many data of tracer experiments is available on literature which can be used to compare with simulation results. However, many of those experiments were performed in tubular reactors and at the moment it is not possible to implement rigid walls on PeliGRIFF unless in squares ducts. A development is underway
Explore all the potential of DNS by studying the flow on fixed-bed reactors in a wider range on Reynolds number. Thus, a better understanding of the flow patterns and the physics of turbulence in fixed-beds can be provided.
6.3 Final appreciation
Working on a multidisciplinary team allowed me to acquire knowledge from different fields and to learn new approaches to solve Chemical Engineering problems. My experience with the non-commercial CFD code, PeliGRIFF, taught me many aspects of Numerical Methods and Computational Fluid Dynamics. Globally, this work was a very rewarding professional experience.
References 33
7 References
Ancheyta, J., Muñoz, J. A. D., & Macías, M. J. (2005). Experimental and theoretical determination of the particle size of hydrotreating catalysts of different shapes.
Catalysis Today, 109(1-4), 120–127.
Bai, H., Theuerkauf, J., Gillis, P. A., & Witt, P. M. (2009). A Coupled DEM and CFD Simulation of Flow Field and Pressure Drop in Fixed Bed Reactor with Randomly Packed Catalyst Particles. Industrial & Engineering Chemistry Research, 48(8), 4060– 4074.
Baker, M. (2011). CFD simulation of flow through packed beds using the finite volume
technique. PhD Thesis. University of Exeter.
Baker, M. J., Young, P. G., & Tabor, G. R. (2011). Image based meshing of packed beds of cylinders at low aspect ratios using 3d MRI coupled with computational fluid dynamics. Computers & Chemical Engineering, 35(10), 1969–1977.
Bird, R. B., Stewart, W. E., & Lightfoot, E. N. (2006). Transport Phenomena, Revised
2nd Edition. John Wiley & Sons, Inc.
Chakraborty, S., & Balakotaiah, V. (2005). Spatially Averaged Multi-Scale Models for Chemical Reactors. Advances in Chemical Engineering, 30.
Dixon, A. G., & Nijemeisland, M. (2001). CFD as a Design Tool for Fixed-Bed Reactors.
Industrial & Engineering Chemistry Research, 40(23), 5246–5254.
Dorai, F. (2013). Étude numérique des chargements, de l’hydrodynamique et de la
réactivité dans des réacteurs pilotes à lits fixes. Lyon.
Eisfeld, B., & Schnitzlein, K. (2001). The influence of confining walls on the pressure drop in packed beds. Chemical Engineering Science, 56(14), 4321–4329.
Eppinger, T., Seidler, K., & Kraume, M. (2011). DEM-CFD simulations of fixed bed reactors with small tube to particle diameter ratios. Chemical Engineering Journal,
166(1), 324–331.
Fogler, H. S. (2005). Elements of Chemical Reaction Engineering (4th Edition). Prentice Hall.