Semiondutor Superlatties: Artiial Crystals with
Unique Eletroni and Transport Properties
H.T. Grahn
Paul-Drude-Institut f urFestkorperelektronik, Hausvogteiplatz 5{7,10117Berlin,Germany
ReeivedonApril22,2001
Semiondutor superlatties are artiialrystals witha periodiity muhlarger thanthelattie
onstantsoftheonstituent materials. Applyinganeletrield parallelto thesuperlattieaxis,
i.e.,perpendiulartothelayers,resultsinuniqueeletroniandtransportpropertiessuhas
mini-bandtransport and Wannier-Starkloalization, whihare thebasis for theobservationof Bloh
osillations. Atlargereldstrengths,resonanttunnelingbetweendierentmini-orsubbands
dom-inates theeletroni transportproperties. Minibandtransportandresonant tunnelingare highly
nonlinearproessesresultingininterestingphenomenaofself-organizationoftheelddistribution.
Semiondutor superlatties (SLs) were proposed
about30 years agobyEsaki andTsu [1℄. Inthe
sim-plest ase, they onsist of a periodi arrangement of
twosemiondutorsAandBwithdierentenergygaps
with a superperiodiity d, whih is muh larger than
the lattie onstants a
A and a
B
. Due to the
forma-tionofminibands,theseartiialrystalsareexpeted
to exhibit unusual transport properties suh as
neg-ative dierential resistane (NDR) and Bloh
osilla-tions. It took 18yearsto demonstratethatanapplied
eletri eld parallel to the superperiodiity destroys
the miniband struture and resultsin disrete states,
so-alledWannier-Starkstates[2,3℄. Blohosillations
were disoveredin theearly 1990s[4℄, but sofar they
have only been observed in optially exited SLs. At
evenlargereletrields,sequentialresonanttunneling
(SRT) between subbands in adjaent wells will
dom-inate the transport harateristi [5℄ and arrierswill
populate a higher subband by injetion [6℄. Due to
the strongnon-linearityof theurrent-voltage
hara-teristiforminibandtransportandSRT,self-sustained
urrent osillations [7, 8℄ and haos [9, 10℄ have been
observedinsuhsystems.
WewillfousonweaklyoupledSLs,forwhihthe
SL miniband width is smaller than the broadeningof
the two-dimensional subbands. For this system, the
transportisdominatedbySRTbetweenadjaentwells,
whih results in anumber of peaks in the drift
velo-ityversuseletrieldharateristis. Asanexample,
Fig.1displaysthemeasureddriftveloityasafuntion
oftheappliedeletrieldfora40-period,undopedSL
with21nmGaAswelland2.5nmAlAsbarrierwidth.
SRTisobservedfortransportfromE
1
inonewelltoE
i
veloityexhibitsseveralregionsofnegativedierential
veloity. Whenalargearrierdensityisintroduedinto
theSL,either byphoto-exitationorby doping,stati
eletri-elddomainsare formed,whih onsistoftwo
regions of onstant eld strength, determined by the
subbandspaings,separatedbyanaumulationlayer,
ahargemonopole. Themotionofthismonopole with
inreasingeletrieldgivesrisetoaverypeuliarI-V
harateristi onsisting of as many urrent branhes
andurrentjumpsasthereareperiodsintheSL.When
the arrier density is redued, the domain formation
beomes unstable. Themonopolean perform a
rey-ling motioninside the SL, whih oversonly part of
the whole number of periods. This reyling motion
appearsin theexperimentsasurrentself-osillations,
whentheurrentisreordedasafuntionoftime. As
anexample,Fig.2showsatimetraeforann-doped,
0
50
100
150
200
0
500
1000
E
1
E
2
E
1
E
3
E
1
E
6
E
1
E
5
E
1
E
4
Electric field (kV/cm)
Drift velocity (m/s)
Figure1. Driftveloityvseletrield foranundopedSL
bar-0.0
1.0
2.0
3.0
4.0
5.0
0.4
0.6
0.8
Current (
µ
A)
Time (
µ
s)
Figure 2. Spontaneous urrent osillations ina dopedSL
with40periods,9.0nmGaAs wells,and4.0nmAlAs
bar-riersfor anappliedvoltageof2.77 Vandatemperatureof
6K.Thereare16spikesinasingleperiodofthe0.65MHz
osillations.
40-period SL with 9.0 nm GaAs wells, 4.0 nm AlAs
barriers, and a doping density of 310 17
m 3
. This
sample exhibits urrent self-osillations with a period
of 0.65 MHz. At the same time, there are 16 spikes
with a frequeny of 10 MHzwithin asingle period of
the 0.65 MHz osillations. The spikesare due to the
reloation of the harge monopole between two
adja-entquantumwells. InweaklyoupledSLs,theharge
monopoleanonlyresideinthewellssothatthemotion
ofthemonopolefromperiodtoperiodbeomes
dison-tinuous. The ratio of 16spikes dividedby 40 periods
demonstrates that the reyling motion of the harge
monopoleonlyoversabout1/3of theSL.
Whentheoupling betweenthe wellsin inreased,
either by reduing the barrier width orby dereasing
theeetivebarrierheightthroughlargereletrields,
the frequeny of the urrent osillations inreases by
more thanfour orders of magnitude. Thehighest
fre-queny observedin weakly oupledSLsis 8GHz[11℄.
Table I lists most of the investigated weakly oupled
SLsin termsofthewelld
W
andbarrierwidthsd
B ,the
alulatedsubbandenergiesE
i
andminibandwidthsas
wellasthetemperatureT andmeasuredfrequenyf
i .
The inrease of the frequenywith dereasingbarrier
width and dereasingeetivebarrier heightindiates
that the frequeny is mainly determined by the
reso-nantouplingbetweenadjaentwells. Thisdependene
anbequalitativelyseenfromtheWKBexpressionfor
tunneling,i.e.,thetunnelingprobabilityisproportional
to exp( 2d
B p
2m
B (V E
i
)=~). Wetherefore expet
thattheperiod(frequeny)oftheurrentosillationis
inversely(diretly)proportionaltothetunneling
prob-ability. AdetailedanalysisdesribedinRef.[11℄shows
that theobservedfrequenieslistedin thelastolumn
of TableI anbewell reproduedtaking into aount
theurrentosillationsonlyoverabout1/3ofthetotal
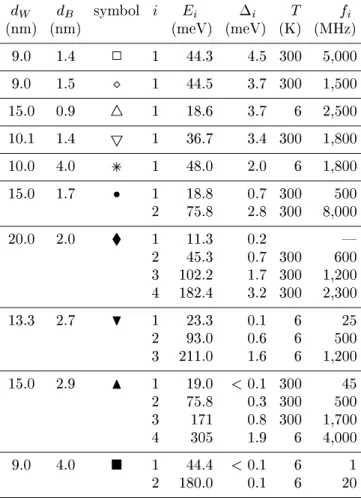
TableI.Sample parametersandosillationfrequenies
for weakly oupled SLs. d
W
denotes the well width,
d
B
the barrier width, i the index of the
orrespond-ingplateauoftheI-Vharateristi,E
i
theenergyand
i
the width of the i th
sub- orminiband, and f
i the
measuredosillationfrequenyatthespeied
temper-ature T. Thesymbolsareusedin Fig.3todistinguish
dierentsamples. Solid symbolsreferto weakly, open
symbolstomorestronglyoupled SLs. Exeptforthe
10.0/4.0sample(+),whihisan(In,Ga)As/(In,Al)As
SL grown lattie mathed on InP, all other SLs are
GaAs/AlAs.
d
W d
B
symbol i E
i
i
T f
i
(nm) (nm) (meV) (meV) (K) (MHz)
9.0 1.4 2 1 44.3 4.5 300 5,000
9.0 1.5 1 44.5 3.7 300 1,500
15.0 0.9 4 1 18.6 3.7 6 2,500
10.1 1.4 5 1 36.7 3.4 300 1,800
10.0 4.0 + 1 48.0 2.0 6 1,800
15.0 1.7 1 18.8 0.7 300 500
2 75.8 2.8 300 8,000
20.0 2.0 1 11.3 0.2 |
2 45.3 0.7 300 600
3 102.2 1.7 300 1,200
4 182.4 3.2 300 2,300
13.3 2.7 H 1 23.3 0.1 6 25
2 93.0 0.6 6 500
3 211.0 1.6 6 1,200
15.0 2.9 N 1 19.0 <0.1 300 45
2 75.8 0.3 300 500
3 171 0.8 300 1,700
4 305 1.9 6 4,000
9.0 4.0 1 44.4 <0.1 6 1
2 180.0 0.1 6 20
Figure 3 shows the measured f
i
versus alulated
f
al
osillationfrequenyforthesampleslistedinTable
I.Symbolsonnetedwithdottedlinesindiate
osilla-tionswithinasinglesample. Inthisase,theinreaseof
thefrequenyissolelyduetoadereaseoftheeetive
barrier height by inreasing the applied eletri eld.
There is adisrepany betweenthemeasuredand
al-ulatedvaluesofaboutafatorofthree,whihseemsto
bereasonableaurayforsuhasimplemodel. Note,
however,thattheobservedfrequeniesoveraboutfour
ordersofmagnitude(logarithmisalesforf
i andf
al ).
SomemorestronglyoupledSLs(opensymbolsin T
a-bleI andFig.3)appearto haveadierentsaling
10
0
10
1
10
2
10
3
10
4
10
0
10
1
10
2
10
3
10
4
N
osc
= 0.3×N
s=1
f
i
= s×f
cal
f
i
(MHz)
f
cal
(MHz)
s
≈
3
Figure3. Measured(f
i
) versusalulated (f
al
) frequeny
for the samples listed in Table I. The same symbols
on-netedwithdottedlinesindiateosillationswithinasingle
sampleindierentplateaus. Thedashedlineindiatesthe
onditionf
al =f
i
,thesolidlineisaleastsquarettothe
soliddatapoints.
tothedipoleosillationsintheGunneet,showsthat
indeed strongly oupled SLs have a saling fator of
about 0.3, when taking into aount that all periods
are involvedin theosillations. Thisvaluediersbya
fatorofabout30fromtheoneforweaklyoupledSLs.
Finally, we present some experiments of driven
urrentosillations,where quasi-periodiity, frequeny
lokingandhaosisobserved. Weappliedasinusoidal
adrivingvoltageofamplitudeV
a
withafrequenyf
d
givenby the golden mean [(1+ p
5)=2 =1:618℄ times
the fundamental frequeny f
i
of the spontaneous
ur-rent osillations. For V
d
= 6:574 V, f
d
was set to
49.4MHz. AtlowvaluesofV
a
,aquasi-periodiregime
isobserved,whihendsat37mV.Atthispoint,the
fre-quenyspetrabegintosmearoutoveralimited
spe-tral range. At V
a
=40 mV, afrequeny-loked state
with a winding number 2/3 appears, whih extends
up to 50 mV. For larger values of V
a
, the frequeny
spetra are more or less smeared out over the whole
frequeny range indiatingthe presene of haoti
os-illations. At V
a
= 100 mV, only a 1/1
frequeny-loked state remains. The atual bifuration senario
dependsstronglyontheapplieddvoltage. Foralarge
dvoltage,alternatingwindowsofquasi-periodiityand
frequeny-lokingdominatethebifurationdiagramas
a funtion of the amplitude of the a driving voltage.
The onset of haos beyond 50 mV in Fig. 4 may be
related to the fat that in this regime of a voltages
the systemis driven from a dynami to a stati eld
distributionandbak.
In summary, weakly oupled SLs exhibit a
non-linear drift veloity eld harateristi resulting for
highly doped systems in eletri-eld domain
forma-tion. For intermediate arrier densities, the domain
formationbeomesunstable. Inthisase,urrent
self-osillationsareobservedwithfrequeniesrangingfrom
0
20
40
60
80
100
0
10
20
30
40
50
V
ac
(mV)
Frequency (MHz)
Figure 4. Power spetra of the driven urrent
osilla-tionsasafuntionofthedrivingvoltageamplitudeVafor
Vd=6:574V. Thedarkertheareainthe plot,thelarger
theabsolutevalueoftheamplitudeoftheosillations.
ies are mainly determined by the resonant oupling
betweenadjaent wells and the numberof periods
in-volvedinthereylingmotionofthehargemonopole.
Whenthe SL is drivenwith an additional a voltage,
frequenyloking,quasi-periodiityandhaoti
osilla-tionsareobserved.
Aknowledgments
The author would like to thank H. Asai, L. L.
Bonilla, O. Bulashenko, A. Fisher, R. Hey, J. W.
Kantelhardt, J. Kastrup, K. J. Luo, M. Rogozia,
K. H. Ploog, A. Waker, and Y. Zhang for their
in-tensiveollaboration.
Referenes
[1℄ L.EsakiandR.Tsu,IBMJ.Res.Develop.14,61(1970).
[2℄ E.E.Mendez,F.Agullo-Rueda,andJ.M. Hong,Phys.
Rev.Lett.60,2426(1988).
[3℄ P.Voisin,J.Bleuse,C.Bouhe,S.Gaillard,C.Alibert,
andA.Regreny,Phys.Rev.Lett.61,1639 (1988).
[4℄ J.Feldmannetal.,Phys.Rev.B46,7252(1992).
[5℄ F. Capasso, K. Mohammed, A. Y. Cho, Appl. Phys.
Lett.48,478(1986).
[6℄ H.T.Grahn,H.Shneider,W.W.Ruhle,K.v.Klitzing,
andK.Ploog, Phys.Rev.Lett.64,2426(1990).
[7℄ J.Kastrupetal.,Phys.Rev.B52,13761(1995).
[8℄ K.Hofbeketal.,Phys.Lett.A218,349(1996).
[9℄ Y.Zhang, J.Kastrup, R. Klann,K. H. Ploog, and H.
T.Grahn,Phys.Rev.Lett.77,3001 (1996).
[10℄ K.J.Luo,H.T.Grahn,K.H.Ploog,andL.L.Bonilla,
Phys.Rev.Lett. 81,1290(1998).
[11℄ M. Rogozia and H. T. Grahn, Appl. Phys.A 78, in