ABSTRACT: The aim of this paper was to identify, for a speciic maneuver, the optimal combination between the trajectory and the associated heat shield coniguration, namely the locations and thicknesses of the ablative and reusable zones, that maximize the allowable payload mass for a spacecraft. The analysis is conducted by considering the coupling between the trajectory’s dynamics and the heat shield’s thermal behavior while using a highly representative model of the heat shield. A global optimization procedure and original software were developed and implemented. The analyzed mission considers an aeroassisted transfer from two low Earth orbits with an assigned orbital plane change maneuver for a given delta wing vehicle equipped with a heat shield consisting of both ablative and reusable materials. The results indicate that the aeroassisted maneuver is more convenient than a “full propulsive” maneuver in the analyzed case, even considering the increased vehicle mass due to the presence of the heat shield.
KEYWORDS: Aeroassisted maneuver, Heat shield, Optimization, Orbital plane change, Thermal protection system.
Thermal Protection System and Trajectory
Optimization for Orbital Plane Change
Aeroassisted Maneuver
Antonio Mazzaracchio1INTRODUCTION
One of the most innovative concepts introduced in recent decades to meet the new, more stringent cost requirements of space missions is to make use of aeroassisted orbital maneuvers. hese maneuvers can signiicantly reduce the propulsion requirements and travel time of a mission in favor of a higher available payload mass allocation.
Several studies have shown that using the atmosphere for assistance can beneit various classes of orbit (Walberg, 1985). Clearly, the spacecrat must be designed with an eicient aerodynamic coniguration to properly utilize the atmosphere for the required global energy management.
Aeroassisted maneuvers are an extension of purely gravity-assist maneuvers, but use a closer approach to a celestial body to encounter its atmosphere. Essentially, a gravity-assist maneuver depends on the size and mass of the planet and how closely it can be approached, whereas an aeroassisted maneuver depends also on the atmospheric properties and on the vehicle’s aerodynamic characteristics.
A spacecrat, which necessarily encounters portions of atmospheric light during a mission, must normally be equipped with a thermal protection system (TPS) to protect its structures, equipment, and payload from aerodynamic heating. he aerothermal conditions to which the vehicle is subjected are generally very severe and, in some cases, extreme.
he optimal design of a spacecrat and its trajectory is always a compromise between the conlicting interests of performance, safety and cost. Obviously, minimizing the TPS mass in compliance with the security constraints is a
1.Astronautical, Electrical and Energetic Engineering Department/Sapienza University of Rome – Rome – Italy
Author for correspondence: Antonio Mazzaracchio | Via Salaria 851 | 00138 Rome – Italy | E-mail: [email protected]
primary requirement. In fact, any savings in the TPS mass can be translated into an increased payload mass. he problem becomes more structured when considering aeroassisted maneuvers, as it also takes into account the mass of propellant required during the various phases of the maneuver itself.
he search for increased beneits at the propulsive
level from an aeroassisted maneuver implies greater
use of the atmospheric phase of light and a need for a
more massive TPS. he question driving this paper is whether the increased TPS mass may cancel the propulsive beneits of the aeroassisted maneuver.
he TPS design is closely related to the trajectory that must be followed. It is evident that a change in the planned trajectory of the vehicle generates, from the perspective of global optimization, a variation to the TPS mass as a result of the modiied aerothermal and environmental conditions.
he most critical parameters commonly considered in the design of a spacecrat’s TPS are the “peak heat lux”, the “peak dynamic pressure”, and the “total heat load” (time integrated heat rate). he irst two drive the choice of material for the TPS, and the last deines the thickness of the material. A fourth parameter (although not speciic to the TPS) is the “peak deceleration”, which is extremely important in the case of manned missions or payload limitations on the tolerable deceleration values.
During the phases of the mission in which they carry out their task of thermal protection, ablative TPS materials lose mass and thus engender a change in the shape of the vehicle. Similarly, changes that occur in the shape of the heat shield inluence the vehicle’s trajectory. herefore, the dynamic and thermal problems are essentially coupled. However, they are generally treated separately because of the extremely high computational cost of solving the coupled problem. he usual procedure is, irst, to optimize the trajectory and, then, to identify the coniguration and the size of the heat shield that will ensure compliance with the imposed thermal constraints. More speciically, the optimized trajectory is irst designed based on predeined heating limits. hen, a TPS able to withstand these thermal luxes and thermal loads is designed. However, this decoupling technique generally leads to a non-optimal solution. Additionally, simple behavioral models are commonly employed in the ablative analysis.
In this paper, the problem is instead solved by coupling the dynamic and thermal analyses. he detailed thermal analysis is performed at the stagnation point, and numerical
and experimental approximations are used to calculate the heat entering the residual vehicle surface.
A new tool for trajectory and heat shield optimization is developed for the conceptual development of a spacecrat and its mission.
An aeroassisted maneuver executing a change of orbital plane between two circular orbits of the same radius is analyzed. he spacecrat is equipped with a heat shield consisting of ablative and reusable materials. he thermal models implemented are highly representative, and a genetic algorithm-based optimizer is used.
he remainder of this introduction provides a historical perspective on trajectory and TPS optimization methods. A review of the model and the governing equations of the problem is presented in next chapter. Aterwards, the optimization procedure is discussed along with the heat shield model adopted. A case study on a delta wing vehicle is presented, and the relevant results and analyses are discussed. he inal chapter ofers a summary, conclusions, and recommendations for future improvements.
A historical review of the methodologies used in the combined optimization of trajectories and TPSs is described by McGuire et al. (2004) and is briely summarized hereinater.
In 1974, Garcia and Fowler introduced a new parameter for optimizing the trajectory and TPS of the Space Shuttle. In place of the simple heat load, which is well known to be the major driver for the mass of the heat shield, they used an “objective function” expressed as an integrated function of the heating rate at the stagnation point and of the angle of attack, with limits on the surface temperature.
For the design of the HL-20 vehicle in 1993, Powell deined a guidance and control scheme to maintain a constant entering heat lux at the stagnation point by varying the bank angle but keeping the angle of attack constant. Powell also let the total heat load unconstrained. he trajectories obtained from this method were used by Wurster and Stone to calculate the relevant aerothermal database, which was in turn used as the main criterion in the selection of TPS materials.
In 1998, Hill et al. generated optimal trajectories for the X-33 using the temperatures of ten diferent zones of the vehicle as constraints. hey employed an aerothermal database
environment, created by Prabhu et al., using computational
In two independent works, also in 1998, both
Windhorst et al. and Chou et al. generated optimal
trajectories with the aim of minimizing the heat load at a specific point on the TPS surface.
Also in 1998, Allen et al. created an integrated
multidisciplinary tool (consisting of aerothermodynamics, trajectory generation, and heat shield sizing modules) for the optimization of both trajectories and TPSs for planetary probes, in which the heat load was minimized, leaving the user to decide the TPS material distribution.
In 2001, Nishioka and Ogasawara, using a method similar to that introduced previously by Garcia and Fowler, derived an expression that depends on the geometry of the vehicle and minimizes the heat load in the reentry trajectories of the Space Shuttle.
Also in 2001, to generate optimal trajectories minimizing the mass of the TPS for a crew transfer vehicle (CTV),
Saunders et al. adopted a methodology similar to that of
Hill in 1998. hey used several aerothermal performance constraint curves speciic to each material. hese curves correlated the altitude and speed of the vehicle so as not to exceed speciic temperature limits, but let both the total heat load and the light time unconstrained.
here is also a large body of literature that has addressed the problem from a multidisciplinary point of view that also involves the design of the vehicle. Examples of such approaches can be found in works by Menees (1983), Windhorst
et al. (2004), and Joshua et al. (2008).
MODEL AND GOVERNING
EQUATIONS
he aim of the present research, as already indicated, was to identify optimal trajectories, subject to heat lux constraints, as well as other possible limitations, while leaving the total heat load unconstrained. he objective is to minimize the sum of the masses of the TPS and the propellant necessary to accomplish the desired orbital maneuver. he vehicle has a given size, shape, and initial total mass, and it must carry out an assigned variation to the inclination of its orbital plane between two circular low Earth orbits (LEOs) of the same radius.
AEROASSISTED ORBITAL PLANE CHANGE
Figure 1 shows a classic scheme for an aeroassisted maneuver that changes the inclination of the orbital plane. The strategy is to use a combination of propulsive maneuvers in space and aerodynamic maneuvers in the atmosphere.
More precisely, one assumes that the propulsive phases of the maneuvers are all concentrated in three impulses, and, therefore, the part of the light within the atmosphere takes place without the use of propulsion. It is also assumed that the change to the orbital inclination occurs entirely during the atmospheric portion of the light.
The first propulsive impulse is a deorbit impulse, varying the speed by ΔV1 from the initial LEO of altitude
HA to enter the atmosphere along an elliptic orbit segment. The second is a boost impulse upon exiting the atmosphere and is expressed by a speed variation of ΔV2 to achieve the final LEO by ascending once more along an elliptic orbit segment. The third and final impulse is a circularizing impulse, which varies the speed by ΔV3 to circularize the vehicle’s path within the final LEO of altitude HB, which is equal to HA by assumption.
It is useful to describe in more detail the various phases of the mission as follows. Initially, the vehicle is moving on a circular orbit of radius RA with a speed VA, around the Earth,
Figure 1. Schematic of aeroassisted orbital plane change maneuver.
ΔV1
ΔV2
ΔV3
which has radius R⊕. he expression of the circular speed is the following:
A
A R
V = μ (1)
where:
RA=R⊕+HA (2)
he deorbit is accomplished by applying the irst impulse ΔV1
against the spacecrat’s motion. his impulse places the vehicle along an elliptic orbit with the perigee inside the dense layers of the atmosphere. he atmospheric region below the altitude Hatm, in which the aerodynamic efects are considered to be conventionally present, is denoted the “sensible atmosphere”. One can determine the speed Vi and the light path angle γi of the vehicle’s trajectory at the atmospheric entry point (H=Hatm) as follows:
(
− Δ)
+ = A 2 1 A atm i R 1 2 V V R 1 2
V μ⎟⎛ −
⎝ ⎛
⎟ ⎝
(3)
(
)
= A 1
i atm
A -1
i V V
V R
R cos
γ ⎧ − Δ
⎩⎜ ⎧
⎩ ⎜
(4)
where:
Ratm=R⊕+Hatm (5)
Obviously, it is necessary that the applied ΔV1 be greater than the minimum ΔV1, min, for which there would be only a tangential trajectory to the edge of the sensible atmosphere. his ΔV1, min is given by the following expression:
1 R R R 1 R 1 2 R V 2 atm A A atm A min , i − − −
= μ μ
Δ
⎛ ⎟
⎝ ⎛
⎟
⎝ (6)
During the atmospheric portion of light, the vehicle performs the required change in orbital inclination, being optimally controlled by modulations of both the angle of attack α and the bank angle σ while subject to the heating constraints. During this phase, the vehicle’s speed decreases due to aerodynamic drag.
Because of the energy lost during the atmospheric crossing and the turn, a new impulse is necessary to achieve the inal altitude. At the end of atmospheric light, the vehicle is situated at an altitude Hatm again, is driven at a speed Vu , and has a light path angle equal to γu.
A second propulsion impulse (boost) is applied to enter an ascending elliptic orbit with the apogee equal to the radius of the inal circular orbit (in this case, the same as the initial orbit). he required ΔV2, as a function of Vu and γu, can be found from the following expression:
u u 2 2 atm B atm B 2 V cos R R 1 R 1 R 1 2 V = Δ γ − − − μ ⎛ ⎟ ⎝ ⎛ ⎟ ⎝ (7)
Once the inal altitude is reached, the third impulse is applied to circularize the inal orbit. he expression for the third ΔV is the following:
u atm B u 2 2 atm B atm B B 3 cos R R cos R R 1 R 1 R 1 2 R V γ γ μ μ − − − = Δ ⎛ ⎟ ⎝ ⎛ ⎟
⎝ (8)
AERODYNAMIC HEATING
he atmospheric light reduces the vehicle’s kinetic energy, which is mostly converted into the entering heat lux. his heat lux is evaluated at the stagnation point through correlations for both the convective and radiative components.
he Sutton-Graves correlation is used for the convective component of the heat lux:
− = 0 w 3 2 1 n atm c con h h 1 V r C
q ⎟⎛ρ
⎝ ⎛ ⎟ ⎝ ⎛ ⎟ ⎝ ⎛ ⎟ ⎝ (9)
and includes the “hot wall” correction factor 1–(hw/h0). he radiative heat lux correlation is based on the Tauber-Sutton relation: ) V ( f r C q b atm a n r
rad= ρ
he value of the constant in Eq. 9 can be found in work by Havey (1982). he values of the constants in Eq. 10 and the tabulated function f(V) are given by Tauber and Sutton (1991). he total heat lux at the stagnation point is then the sum of both the convective and radiative contributions:
rad con
tot q q
q = + (11)
The heat flux is assumed to be independent of the angle of attack. Thus, the latter appears only in the guidance equations. This assumption is commonly acceptable for an engineering tool suitable for conceptual design phases (an example of this assumption can be found in a paper by Gogu et al., 2009).
THERMAL MODEL
he thermal analysis is performed with a one-dimensional plane model (Fig. 2). he model for the ablative part of the heat shield and the relevant assumptions are thoroughly described in previous work by the author (Mazzaracchio and Marchetti, 2010). However, it is worth briely recalling here the set of equations that form the basis of the model.
he internal energy balance is expressed as follows:
(
)
t d g t P r
y d
t R x
P
x h m x T c s
t h h q x T k x t T c
∂ ∂
+
∂ ∂
+
∂ ∂
− + −
∂ ∂ ∂
∂
=
∂ ∂
ρ
ρ
ρ ⎟⎛
⎝ ⎛
⎟ ⎝
(12)
In Eq. 12 , the coordinate system y is ixed, whereas the mobile coordinate system x moves with the receding surface; initially, the two coincide. he terms in Eq. 12 each represent, in order: the rate of storage of thermal energy, the net rate of thermal energy transferred by conduction and internal radiation, the energy-consumption rate from pyrolysis, the convective energy rate due to coordinate system movement, and the convective rate from the pyrolysis gases. Because of the hypothesis of the internal opacity of the body, the q
.
R term is null.For both virgin material and char, the local speciic heat depends on temperature, whereas the local thermal conductivity depends on both temperature and pressure. he
pyrolysis gas enthalpy hd also depends on temperature and
pressure, whereas the quantity h, which is the partial heat of charring, is deined as a function of both virgin and charred material properties as follows:
c v
c c v
vh h
h
ρ ρ
ρ ρ
−
−
=
(13)he Arrhenius equation is used to represent the pyrolysis decomposition in a large-scale model:
T B n
c v
c cf
T r
exp K
t
−
− − =
∂ ∂
ρ ρ
ρ ρ
ρ ⎛
⎟
⎝ ⎛
⎟
⎝ (14)
he internal decomposition transforms part of the solid ablative material into pyrolysis gases. Because of the assumptions of quasi-static one-dimensional low and impermeability of the interface with the virgin material zone, the pyrolysis gases’ mass low is related to the decomposition by the following simple expression:
t y mg
∂ ∂ = ∂
∂ ρ (15)
Conduction Conduction
Pyrolysis gases Gas cooling
Substructure
Spacecraft interior Virgin ablative
material Reaction zone Mature char
Melting zone Boundary layer
Convective heating
Bond-line Surface recession mechanical erosion
surface chemistry Radiative
heating
Reradiative cooling Transpiration
blocking effect
he conditions at the external ablating surface are determined by the convective and radiative components of the aerodynamic heating and by the thermo-chemical interactions with the warm gases in the boundary layer. he energy balance at the surface is expressed in the following relation:
(
4 4)
w w SB comb rad blow , cin q q q F T T
Q = + + − σ ɛ − ∞ (16)
he irst term, q
.
c, blow, comes from considering thereduction of the convective component by the injection of pyrolysis gases into the boundary layer. A second order approximation, a function of the mass low of the outgoing gases known as “transpiration theory”, is assumed to represent this “blocking efect”.
Setting:
(
c c g g)
w , c
0 m m
q h
A
α +α
= (17)
the inal expression for the net convective heat lux is given by the following equations:
(
)
= ≥ + − = < con blow , c con 2 blow , c q 04 . 0 q 25 . 2 A q A 13 . 0 A 724 . 0 1 q 25 . 2 A ⎨ ⎪ ⎪ ⎪ ⎪ ⎩ ⎧ (18)he coeicients αc and αg are used to diferentiate the molecular weight of the gases in the boundary layer from the molecular weight of the injected pyrolysis gases, respectively. he coeicient αc also takes into account the fraction of char that is removed mechanically and not due to ablation.
In the presence of an oxidizing atmosphere, the heating due to combustion of the solid ablation products in the boundary layer must be considered, and complete combustion is assumed:
comb c comb m h
q = Δ (19)
Finally, the char recession rate ṡr is obtained from
experimental data as a function of either the surface temperature or the total entering heat lux.
As a consequence of char removal, the surface moves with respect to the ixed coordinate system. he distance between the initial position of the surface and the current position gives the thickness loss. his distance is given by:
∫
=t
0 r
r s dt
s
(20)The model of the reusable portion of the heat shield is a classic model used for heat transfer without phase changes and surface recession, and was derived from the ablative model by eliminating all of the irrelevant phenomena due to the pyrolysis. Equations 12 and 16 become respectively: t R x P q x T k x t T c − ∂ ∂ ∂ ∂ = ∂ ∂
ρ ⎟⎛
⎝ ⎛
⎟ ⎝
(21)
(
4 4)
w w SB rad conin q q F T T
Q = + − σ ɛ − ∞ (22)
Obviously, the dependence from temperature and pressure of the thermal characteristics is preserved.
Equation 21 is also used for modeling the heat transfer in the substructure.
ATMOSPHERIC FLIGHT
he vehicle is considered to be moving subject to a Newtonian inverse square gravitational law, neglecting the Earth’s rotation:
g=μ/R2 (23)
The three degree-of-freedom differential equations of motion in spherical coordinates are the following (Vinh
et al., 1980):
γ sin V dt dR
= (24)
ϕ ψ γ θ cos R cos cos V dt d
= (25)
R sin cos V dt
dϕ γ ψ
= (26)
γ sin g m D dt dV − −
= (27)
+ −
= γ γ γ
γ cos R V cos g m cos L V 1 dt
d ⎛ 2
⎟
⎝ ⎛
⎟ ⎝
−
= γ ψ ϕ
γ σ ψ
tan cos cos R V cos m
sin L V
1 dt
d ⎛ 2
⎟
⎝ ⎛
⎟ ⎝
(29)
he aerodynamic lit and drag forces are given, respectively, by:
2 V S C m
L= Lρ 2 (30)
2 V S C m
D 2
Dρ
= (31)
Assuming a parabolic drag polar, the drag coeicient of the vehicle can be written as:
CD=CD0+KDCL2 (32)
where the lit coeicient CL is a linear function of the angle of attack:
CL=CL,αα (33)
and obeys the following limitation:
0≤CL≤CL, max (34)
Concerning Eq. 33 and Eq. 34, it can be assumed that the vehicle always enters the atmosphere with the same attitude: zero incidence and a bank angle equal to -180° (upside down). he angle of attack cannot take negative values because the lit modulation is enacted through the
bank angle. In fact, it should be noted that a negative CL
value can result from either a negative pitch angle or from a vehicle lying upside down with a positive pitch angle. In this latter case, to get a downward force, one must ly upside down with a positive lit coeicient.
A non-negative light path angle is required at the atmospheric exit to ensure the completion of the maneuver:
γu≥0 (35)
To evaluate the change in the orbital plane inclination, it is possible to use the following relationship between inclination, heading, and latitude:
cos i = cosϕcosψ (36)
This expression can be evaluated using the values at the atmospheric exit, assuming an initial inclination of 0°, because, as suggested, the change of orbital plane is accomplished entirely during the atmospheric portion of the flight.
Finally, a fourth-order Runge-Kutta integration is employed in the trajectory computation.
OPTIMIZATION
Figure 3 shows a diagram of the procedure adopted here. he inputs to the method consist of the vehicle model and the requirements and constraints for the maneuver. he trajectory is integrated and the thermal analysis is performed as previously described.
he process for determining the minimum thickness of the TPS is iterative.
he optimization methodology used here is a genetic algorithm (GA) described hereater.
Spacecraft
model
Orbital maneuver
Trajectory
Heat flux
TPS ablative/reusable
Fitness function
GA optimization TPS thickness
minimization
GENETIC ALGORITHM
Genetic algorithms, developed by Holland (1975), are a global search optimization method based on the fundamental principles of Darwinian evolution, such as natural selection and genetic mechanics.
Such a technique is — and has been — successfully used as a global optimization method for complex problems in many research ields and is also used as a suitable method for spacecrat trajectory optimization (Gath and Calise, 2001; Rajesh, 2002; Igarashi and Spencer, 2005). Other methods that are widely used in trajectory optimization problems because of their eiciency are the “gradient-based” optimizers.
he eiciency of these optimizers, however, is strongly inluenced by the researcher’s ability to provide good initial guesses and precise derivatives of the “itness function”. Without a good initial guess, the method may not converge or may produce a local minimum solution, which is oten unacceptable. hese fundamental aspects of the method involve a substantial degree of intervention by expert users.
Conversely, GA-based optimizers do not sufer from such limitations as they generate their own starting points. hus, these optimizers are virtually insensitive to the initial guess. hey are also intrinsically robust to non-linearities and discontinuities in the objective function. heir primary disadvantage is that GA-based optimizers require a large number of iterations and, subsequently, a longer computing time due to their generally slow convergence.
he following fact must be emphasized: a GA cannot ind the optimal solution to a problem. Instead, it identiies the ittest individual in a population that has undergone a process of evolution for the improvement of the species. Evolution, even biological, does not aim to attain an optimum. he GA will use the population it has at its disposal to generate individuals that are above the average while also taking into account the constraints associated with the development. In other words, the GA does not perform a mathematical optimization in the strict sense of the term. Nevertheless, GAs are a highly robust and eicient optimization methodology.
he GA adopted here refers to a mixed one-point/two-points crossover operator together with a reproduction plan that provides a full generational replacement with elitism (Charbonneau and Knap, 1995; Charbonneau, 2002a and 2002b).
he termination criterion corresponds to the maximum number of generations chosen and the main parameters adopted for the case studies presented here are summarized in Table 1.
he state variables chosen for the optimization procedure are: the time history of both the angle of attack and the bank angle, the ΔV1 used for deorbit, and, if required, the transit time in the atmosphere. In this study, the latter was let as a free parameter with an upper limit beyond which the mission is considered a failure. his assumption serves to exclude runs in which the vehicle lies by gliding up and down without enough energy to exit the atmosphere.
he itness function is deined as the sum of an objective function (which must be maximized in the present case) plus the contributions of one “reward factor” for each constraint. Such a scheme allows easier handling of the constraints than the classic “penalty function” in a maximization problem such as this. In fact, the various reward factors are directly summable to the objective function.
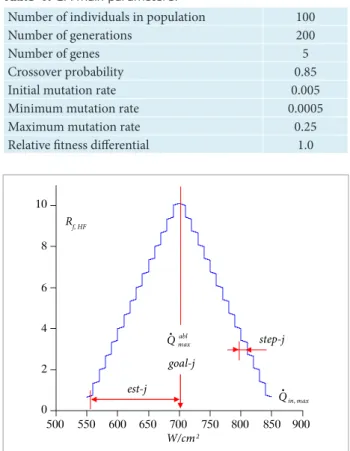
he reward factor Rf, j chosen here (Fig. 4), where ‘j’
indexes the various constraints, is a stepped pyramidal function (Yeniay, 2005). he function assumes a zero value outside of the range of deinition (the base of the pyramid), which is deined by a semi-extension ‘est-j’ around the desired
Table 1. GA main parameters.
Number of individuals in population 100
Number of generations 200
Number of genes 5
Crossover probability 0.85
Initial mutation rate 0.005
Minimum mutation rate 0.0005
Maximum mutation rate 0.25
Relative itness diferential 1.0
step-j
goal-j
est-j
max , in
Q Rf, HF
abl max
Q
W/cm2
• •
10
8
6
4
2
0
500 550 600 650 700 750 800 850 900
value of the constraint ‘goal-j’ [‘goal-j’ ± ‘est-j’]. he range of deinition is, in turn, divided into subintervals, each of which have an amplitude equal to ‘step-j’, and each characterized by a value of the “level of respect” (or, otherwise, the “level of violation”) of the constraint that is proportional to the distance from ‘goal-j’.
his process allows the calculation of the irst quantized contribution to the reward factor. A minor corrective addendum is then added within the same step. his addendum is a linear function of the distance from the boundary of the subinterval in question and generates the inclination of the step.
This structure of reward factors used in the genetic algorithm allows for a significant jump in value between one level and the next. It also allows the appropriate ordering of two points belonging to the same subinterval of merit. To choose the parameters defining the stepped pyramidal function, the value of the function at the end of a subinterval must not exceed the initial value of the next level. The additive contribution to the fitness function from the reward factors will grow as the variable values approach the values of the constraints, highlighting the individual in question within the entire population of the genetic algorithm. When all constraints are simultaneously satisfied, the value of the reward factor for this solution is enhanced.
OBJECTIVE FUNCTION, CONSTRAINTS, AND FITNESS FUNCTION
he total initial mass of the vehicle is the sum of the propellant mass, the TPS mass, and the structural and payload masses. he goal of the current optimization problem is to perform the orbital plane change while minimizing the sum of the mass of the propellant and the mass of the TPS needed. he objective function, which must be maximized, is then given by the inal mass of the vehicle, that can be deined as the performance index of the problem.
Initially, the propellant consumption due to the deorbit impulse must be calculated. he vehicle’s mass when it enters the atmosphere can be found by applying the Tsiolkovsky equation for the impulse:
sp 0
1 I g
V
ini , ve i ,
ve m e
m
Δ −
=
(37)
his mass will be further reduced by mTPS, los during the passage through the atmosphere because of TPS ablation.
he mass loss due to ablation comes from both surface recession, and the material density change due to pyrolysis. hus, the mass of the vehicle at the atmosphere exit will be the following:
mve, u = mve,i – mTPS, los (38)
At this point, the boost and circularization impulses are applied in sequence, and the final vehicle mass is obtained by two successive applications of the Tsiolkovsky equation:
sp 0
3 2
I g
V V
u , ve fin ,
ve m e
m
Δ + Δ −
=
(39)
Compliance with the heat lux constraints and the required variation of the orbital inclination are ensured by the reward factors.
hese reward factors are added to the objective function with appropriate multiplicative weights wj, which are set to foster rapid convergence. he inal expression of the itness function ff of the genetic algorithm is the following:
HF , f HF i , f i ini , ve
fin , ve
m w R w R
m m w
ff = + Δ Δ + (40)
he convenience of the aeroassisted maneuver must be assessed with respect to the classic “all propulsive” maneuver in which the required inclination change is made by a single propulsive impulse outside of the atmosphere.
For circular orbits in which only the inclination is changed while all other orbital characteristics remain the same, the required ΔV is the following:
Δ =
Δ
2 i sin R 2 V
A ap
μ ⎛
⎟
⎝ ⎛
⎟ ⎝
(41)
Consequently, the expression for the inal mass of the vehicle is:
sp 0
ap I g
V
ini , ve ap , fin ,
ve m e
m
Δ −
= (42)
HEAT SHIELD MODEL
he kinematic conditions of the mission and the properties of the atmosphere are such that the aerodynamic heating is signiicant. he use of a considerable heat shield is thus necessary, as is oten highlighted.
Considering the spacecrat as a liting vehicle, one assumes the presence of a protective coating on a portion of the outer surface of the vehicle. In particular, only the lower areas of the nose, body, and wings are covered by the TPS, corresponding to about 63% of the vehicle’s total surface.
Due to the limited allowable maximal heat lux and surface temperature for the reusable materials, the severity of the thermal environment does not allow for the adoption of a fully reusable heat shield.
Conversely, the adoption of a fully ablative TPS may result in signiicant additional mass, as the density of most of these materials is considerably higher than the reusable ones. Moreover, due to the lower entering heat lux on some regions of the TPS, the adoption of ablative materials in these zones would be unnecessary. A hybrid TPS is thus adopted, in which the use of the reusable material is conined to the areas where the entering heat lux is lower than the speciied operational limit Q⋅maxreu.
MAPPING AND DIMENSIONAL EVALUATION OF TPS he mapping and sizing of the TPS are carried out through the procedure detailed as follows (Fig. 5(a) and Fig. 5(b)).
• he total area of the vehicle is calculated as the sum of the contributions of the nose cone, the body and the two wings.
• he total area of the heat shield is reduced by a certain
percentage from the total area of the vehicle to relect the actual coverage of the TPS (Gogu et al., 2009).
• A thermal safety factor (TSF) is multiplied to the
calculated thickness of the TPS materials.
• he nose cone is divided into spherical segment
panels, the body into cylindrical panels and the wings into rectangular panels.
• For each panel, a reduction factor for the entering heat lux is calculated with respect to the stagnation point lux Qin
⋅. For
the nose cone and the body, this reduction is only considered longitudinally. For the wings, this reduction factor is expressed as a product of a transverse factor (on the leading edge) and a longitudinal factor. Figures 6(a) and 6(b) show the longitudinal and transverse normalized reduction factors taken from a work by Reuther et al. (2004) and slightly modiied here.
Figure 5. Schematic of TPS model.
point of evaluation of the heat flux
reusable ablative
(b). Ablative versus reusable TPS areas.
(a). TPS panels schematic.
Figure 6. Normalized heat reduction factor.
0 0.2 0.4 0.6 0.8 1
0 0.2 0.4 0.6 0.8 1
x/l
q
/q
_
n
o
se
0 0.2 0.4 0.6 0.8 1
0 0.2 0.4 0.6 0.8 1
y/l
q
/q
_
n
o
se
• To be conservative, the reduction factor is calculated in the middle of the upper edge of each panel (point of maximal entering heat lux).
• he type of material used for each panel, reusable or
ablative, is chosen depending on the level of the entering heat lux compared to the value of Q⋅maxreu.
• Each panel contributes to the mass per unit area of the
TPS in proportion to its thickness and type of material.
• he required thickness of each panel is considered to
be directly proportional to the entering heat lux. his assumption allows a “reduced virtual equivalent surface” to be obtained as the sum over panels of the product of each panel surface with its respective reduction factor.
• For the reusable area, this reduction factor is again
divided by the ratio between Q⋅maxreu and Q max
⋅abl. In fact, in this
instance, the initial thickness is equal to the maximum thickness of the reusable material itself.
Finally, in evaluating the mass, the adopted scheme is equivalent to a TPS with a uniform thickness equal to the maximum, including the TSF, but distributed on a “reduced virtual equivalent surface”.
At this point, a methodological clariication is needed. For maximal savings in the TPS mass, as already indicated, the reusable material is assumed to cover all of the areas where the values of heat lux permit. In all other zones, the ablative material will be employed. Nevertheless, the zones where the reusable material can be used are still not deined.
he entering heat lux at the stagnation point, calculated from Eq. 11, is a function of the trajectory. For this reason, and because of the correlation with the heat lux entering the other areas of the vehicle, a mapping of the TPS in terms of reusable vs. ablative material is not deinable at the beginning. However, at the end of the genetic evolutionary process, an optimal trajectory will be found that obeys the constraints imposed on the heat lux, among others. hus, a TPS mapping consistent with this inal situation can be adopted a priori. hen, as a result of these assumptions, the distribution of the entering heat lux is ixed in advance, making it possible to deine the boundaries of the reusable material.
Obviously, during the search for the optimal trajectory, in all of the runs in which the heat lux constraints are not respected, an inappropriate TPS coniguration will be achieved. his is especially true for runs in which the heat lux value is greater than the constraint. In these cases, a part of the reusable heat shield will be overexposed to entering heat lux,
implying partial incompliance with the constraint value Q⋅maxreu.
Conversely, if the vehicle will be exposed to a smaller heat lux than the constraint, the ablative material will be used more than necessary, covering areas that could be covered with the reusable material.
Note that in the unconstrained case, and precisely because of the absence of any indication concerning the entering heat lux, one assumes that the entire shield is ablative.
Returning again to the operational details, the design parameter chosen for sizing the TPS is the temperature of the bond-line (TBL), i.e., the temperature of the adhesive junction layer between the heat shield and the substructure. It is required
that TBL be within the speciied design temperature. he
required minimum thicknesses are determined by independently iterating on both types of material. he minimum thickness of the ablative material is determined at the stagnation point, whereas the minimum thickness of the reusable material is calculated at the points with an entering heat lux equal to its operational limit.
he actual thicknesses of all other points of the heat shield are then considered to be linear with the local heat load. herefore, because the exposure time is the same for all points, the required thicknesses are ultimately assumed to be linear with the maximum heat lux entering the point.
Note that during the iterative process to determine the minimum thickness within a single run, the trajectories do not vary noticeably from one iteration to another because the initial mass is constant by deinition. In efect, the savings in the TPS mass due to the decreased thickness of the heat shield are ofset by the mass of the structures and the payload so as to leave the initial total mass of the vehicle unchanged.
he developed thermal model and sizing tool were validated by the author (Mazzaracchio and Marchetti, 2010) by comparison with an industry standard high-idelity ablation and thermal response program, namely the “Fully Implicit Ablation and hermal” (FIAT) sotware of NASA Ames Research Center.
CASE STUDY
SPACECRAFT
he analyzed spacecrat was characterized by a delta-wing coniguration with a high L/D, roughly similar to the Boeing X-37 vehicle. he dimensions and aerodynamic characteristics
Facts (2003). Other data were reasonable assumptions made by the author. he primary dimensions and characteristics of the vehicle are listed in Table 2, and the principal aerodynamic and propulsive parameters are listed in Table 3.
ATMOSPHERIC FLIGHT
Table 4 presents the orbit altitudes of the required maneuver and the assumed conventional limit of the Earth’s sensible atmosphere.
he atmospheric properties were derived from the 1976 US Standard Atmosphere model.
TPS MATERIALS
he spacecrat had a supposed heat shield consisting of a material called phenolic impregnated carbon ablator, known as PICA-15, for the ablative zones and LI-900 for the reusable zones.
PICA-15 was used in the Stardust probe, whose reentry capsule returned to Earth in 2006 with samples of cosmic and cometary dust collected during its mission. PICA is a relatively recent material that is characterized by a low density — well below that of the classic carbon phenolic — while at the same time having a high ablative capability for elevated heat luxes. PICA also features a thermal conductivity lower than that of other ablative materials for equal entering heat luxes. PICA consists of chopped carbon ibers as insulation with a phenol-formaldehyde resin as an iniltrant. he high porosity of the composite is the reason for its low density and thermal conductivity (Tran et al., 1997).
LI-900 is a typical reusable material designed for use on the Space Shuttle TPS. LI-900 comes in the form of a surface insulating tile and is used to minimize thermal conductivity while ensuring maximum resistance to thermal shock. It is made from 99.9% pure silica glass ibers, which occupy only 6% of the total volume (Williams and Curry, 1992).
Both the ablative and reusable layers are bonded onto the substructure, which consists of a 12.7 mm thick carbon-carbon/aluminium honeycomb sandwich. The substructure is considered an integral part of the TPS.
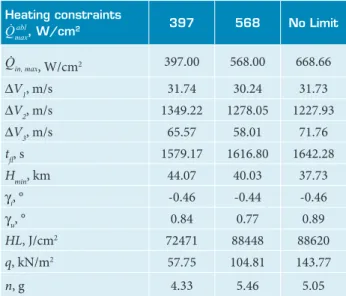
RESULTS AND ANALYSIS
he study was conducted by analyzing three diferent cases corresponding to three diferent values for the entering heat
lux constraint. he irst two cases corresponded to Q⋅maxabl equal
to 397 and 568 W/cm2, which are equivalent, respectively, to
350 and 500 Btu/(t2∙s). he third case was unconstrained.
he study required a running time of approximately 160 days on a I7 Intel® processor with 8 threads and a clock speed of 3.2 GHz. he ittest case was identiied from a population of about 3.5 million individuals.
he “all propulsive” case for this mission provided, by mean of Eqs. 41 and 42, a value for ΔVap equal to 2438.20 m/s, which implies a consumption of 2703.51 kg of propellant and a net vehicle mass equal to 2195.19 kg.
Table 5 shows a comparison of the main characteristics of the obtained optimal trajectories and presents the maximum values of the dynamic pressure and the load factor. hese latter are presented only for veriication purposes, as they are not subject to constraints; in any case, their observed values are compatible with the feasibility of the mission.
All cases were characterized by similar values of ΔV1 and
γi, whereas ΔV2 and Hmin decreased with increasing Qmax ⋅abl.
Concurrently, the light time tl and the total heat load HL
increased with increasing Q⋅maxabl.
Table 2. Vehicle’s dimensions and characteristics.
Gross vehicle mass mve, ini 4898.7 kg
Vehicle length lve 9.38 m
Vehicle body radius rb 1.00 m
Vehicle wing span wsve 4.50 m
Vehicle wing cord wcve 3.50 m
Vehicle reference surface S 11.69 m2
Vehicle TPS total surface STPS, ve 42.65 m2
Bond-line limit temperature TBL, lim 450 K
hermal safety factor TSF 1
Table 3. Vehicle’s aerodynamic and propulsive characteristics.
Zero-lit drag coeicient CD0 0.032
Induced drag factor KD 1.4
Lit coeicient derivative CL,α 0.5699
Maximum lit coeicient CL , max 0.4
Propellant speciic impulse Isp 310 s
Table 4. Maneuver’s characteristics.
Initial LEO altitude HA 185.2 km
Final LEO altitude HB 185.2 km
Required inclination change Δi 18°
Table 6 presents the main diferences among the three optimal TPS scenarios. As previously stated, a fully ablative heat shield is used in the unconstrained case. In this “not limited” case, the maximum observed heat lux is equal to 668.66 W/cm2,
which is much lower than the operating limit of the employed material (PICA-15). As expected, the thickness of the ablative part, and consequently its mass, grow as the heat load increases; in contrast, the overall mass of the TPS decreases considerably. his apparent contradiction lies in the type of materials used. Obviously, as the heating constraint takes higher values, the ablative portion of the heat shield is extended.
However, in the present work, which uses a low density ablative material, it is disadvantageous to use the reusable materials. In fact, even though they have a lower density, they require greater thicknesses. hese factors combine to produce a lighter TPS when a fully ablative coniguration is employed. Clearly, this behavior is not general, and diferent results are possible when denser ablative materials are used. he mass lost during the crossing of the atmosphere due to the pyrolysis phenomena should be noted. Its value in the unconstrained case is 48% of the entire ablative part, 36% of the entire TPS mass, and 2% of the gross vehicle mass. he surface recession is about 7 mm. Finally, in this unconstrained case, the mass fraction of the entire TPS is approximately 5.5% of the gross vehicle mass. Additionally, at the propulsive level, the total consumption of propellant also diminishes with the increasing value of the heating constraint.
he unconstrained case is therefore the most beneicial case in terms of savings in both the propellant mass and TPS mass, when using these particular TPS materials. To obtain the maximum beneit, in principle, one must adopt the highest
allowable heating constraint. However, in this case, higher load factors and dynamic pressures are to be expected and may restrict the maximum allowable heat lux. In Fig. 7, a comparison of all of the masses involved highlights the beneit of this maneuver in comparison with the “all propulsive” case. he unconstrained case allows a considerable payload mass gain of 730.84 kg, which corresponds to about 15% of the gross vehicle mass.
Figures 8, 9, 10, and 11 show the altitude, the velocity, the total entering heat lux, and the vehicle’s mass, respectively, as functions of the light time during the atmospheric pass.
When the lowest thermal constraint is imposed, the vehicle must dive into the atmosphere earlier to perform the assigned maneuver, even if it will descend less than in the other cases (Fig. 8). More precisely, to achieve the desired change in the orbital plane, it will ly for a longer time in less dense layers of the atmosphere than in the cases with a higher lux limit. his is necessary to prevent violation of the heat constraint and because of the lower Table 5. Trajectory comparison.
Heating constraints
Q⋅maxabl
, W/cm2 397 568 No Limit
Q⋅in, max, W/cm2 397.00 568.00 668.66
ΔV1, m/s 31.74 30.24 31.73
ΔV2, m/s 1349.22 1278.05 1227.93
ΔV3, m/s 65.57 58.01 71.76
tl, s 1579.17 1616.80 1642.28
Hmin, km 44.07 40.03 37.73
γi, ° -0.46 -0.44 -0.46
γu, ° 0.84 0.77 0.89
HL, J/cm2 72471 88448 88620
q, kN/m2 57.75 104.81 143.77
n, g 4.33 5.46 5.05
Table 6. Heat shield comparison.
Heating constraints Q⋅maxabl
, W/cm2 397 568 No Limit
mTPS , kg 308.66 284.81 267.37
abl TPS
m , kg 164.76 190.20 198.19
reu TPS
m , kg 74.72 25.43
-mTPSss
, kg 69.18 69.18 69.18
Sr , mm 3.69 6.70 7.07
mTPS, los , kg 76.86 91.83 95.34
mTPS, prop , kg 1827.37 1741.88 1705.30
δTPSabl
, mm 87.50 89.79 90.34
δTPSreu
, mm 32.15 31.49
-Mass gain wrt “all
propulsive” case, kg 567.48 676.82 730.84
Gain wrtmve, ini, % 11.58 13.82 14.91
1705.3
567.5 676.8 730.8
1741.9 1827.4
2703.5
69.2
69.2 69.2 198.2
164.8 190.2
74.7 25.4
0 500 1000 1500 2000 2500 3000
"all propulsive" 397 W/cm² 568 W/cm² No Limit
Heat Flux Constraint
M
as
s, kg
Propellant Substructure Ablative Reusable Mass Gain
available maneuverability in this region. However, the total light time is ultimately greater for the unconstrained case. his fact and the lower minimum altitude reached, makes the total heat load for this trajectory higher. Figure 9 shows that the reduction in the velocity is less important in the unconstrained case, justifying the requirement of a smaller ΔV2 at the atmosphere exit.
Figures 12, 13, and 14 represent the coverage areas, the type of material and the thicknesses of the heat shield, respectively, for all three cases on a half-vehicle scheme. It should be noted that the assumptions have led to a theoretical thickness step on the border between the reusable and ablative parts.
140 120 100 80 60 40 20 A lt it ude , k m
Atmospheric Flight Time, s
0 200 400 600 800 1000 1200 1400 1600 1800
Heating Constraints 397 W/cm2
568 W/cm2
Unconstrained
Figure 8. Altitude versus time.
8000 7800 7600 7400 7200 7000 6800 6600 6400 6200 6000 V elo ci ty , m/s
Atmospheric Flight Time, s
0 200 400 600 800 1000 1200 1400 1600 1800
Heating Constraints
397 W/cm2
568 W/cm2
Unconstrained
Figure 9. Velocity versus time.
800 700 600 500 400 300 200 100 0 St ag n at io n P oin t H ea t Fl ux W/cm 2
Atmospheric Flight Time, s
0 200 400 600 800 1000 1200 1400 1600 1800
Heating Constraints 397 W/cm2
568 W/cm2
Unconstrained
Figure 10. Total entering heat lux versus time.
4900 4850 4800 4750 4700 M as s, kg
Atmospheric Flight Time, s
0 200 400 600 800 1000 1200 1400 1600 1800
Heating Constraints 397 W/cm2
568 W/cm2
Unconstrained
Figure 11. Mass versus time.
3 2 1 0 W id th, m Length, m
Ablative - Thickness, mm Reusable - Thickness, mm
Above 115 105–115 95–105 85–95 75–85 65–75 55–65 45–55 35–45 25–35 15–25 5–15 Below 5 Above 45 40–45 35–40 30–35 25–30 20–25 15–20 10–15 5–10 Below 5
0 1 2 3 4 5 6 7 8 9 10
Figure 13. TPS coniguration for the case with Q⋅maxabl= 568 W/cm2.
Figure 12. TPS coniguration for the case with Q⋅maxabl= 397 W/cm2.
3 2 1 0 W id th, m Length, m
Ablative - Thickness, mm Reusable - Thickness, mm
Above 115 105–115 95–105 85–95 75–85 65–75 55–65 45–55 35–45 25–35 15–25 5–15 Below 5 Above 45 40–45 35–40 30–35 25–30 20–25 15–20 10–15 5–10 Below 5
0 1 2 3 4 5 6 7 8 9 10
3 2 1 0 W id th, m Length, m
Ablative - Thickness, mm Above 115 105–115 95–105 85–95 75–85 65–75 55–65 45–55 35–45 25–35 15–25 5–15 Below 5
0 1 2 3 4 5 6 7 8 9 10
SUMMARY AND CONCLUSION
A new tool was developed for the optimization of aeroassisted maneuvers by coupling the dynamic and thermal problems, and taking into account the mass of the vehicle’s TPS. his tool, which is suitable for conceptual design activities, refers to highly representative thermal models for reusable and ablative materials, and is based on a genetic algorithm optimizer.
A maneuver to change the orbital plane between two LEOs with the same radius was analyzed, taking the maximum allowable entering heat lux at the vehicle’s stagnation point as a parameter.
he optimal trajectories for completing the speciied mission were found along with the respective optimal conigurations of the TPS.
REFERENCES
Charbonneau, P., 2002a, “An introduction to genetic algorithms for numerical optimization”, Boulder, Colorado.
Charbonneau, P., 2002b, “Release notes for Pikaia 1.2”, Boulder, Colorado.
Charbonneau, P. and Knap, B., 1995, “A user’s guide to Pikaia 1.0”, Boulder, Colorado.
Gath, P.F. and Calise, A.J., 2001, “Optimization of launch vehicle ascent trajectories with path constraints and coast arcs”, Journal of Guidance, Control and Dynamics, Vol. 24, No. 2, pp. 296-304. doi: 10.2514/2.4712.
Gogu, C., Matsumura, T., Haftka, R.T. and Rao, A.V., 2009, “Aeroassisted orbital transfer trajectory optimization considering thermal protection system mass”, Journal of Guidance, Control and Dynamics, Vol. 32, No. 3, pp. 927-938. doi: 10.2514/1.37684.
Havey, K.A. Jr., 1982, “Entry vehicle performance in low-heat-load trajectories”, Journal of Spacecraft and Rockets, Vol. 19, No. 6, pp. 506-512. doi: 10.2514/3.62293.
Holland, J.H., 1975, “Adaptation in natural and artiicial systems”, University of Michigan Press, Ann Arbor, MI.
Igarashi, J. and Spencer, D.B., 2005, “Optimal continuous thrust orbit transfer using evolutionary algorithms”, Journal of Guidance, Control and Dynamics, Vol. 28, No. 3, pp. 547-549. doi: 10.2514/1.11135.
Joshua, E.J.,Lewis, M.J. and Starkey, R.P., 2008, “Analysis of optimal Earth entry heat shield/trajectory conigurations”, 15th AIAA International Space Planes and Hypersonics Systems and Technologies Conference, Dayton, Ohio, paper no. AIAA-2008-2594.
Mazzaracchio, A. and Marchetti, M., 2010, “A probabilistic sizing tool and Monte Carlo analysis for entry vehicle ablative thermal protection systems”, Acta Astronautica, Vol. 66, issues 5-6, pp. 821-835. doi: 10.1016/ j.actaastro.2009.08.033.
McGuire, M.K., Gage, P., Galloway, E.T., Huyhn, L., Nguyen, J., Bowles, J.V. and Windhorst, R., 2004, “Trajectory and thermal protection system design for reusable launch vehicles”, AIAA Paper 2004-4490.
Menees, G.P., 1983, “Thermal protection requirements for near-Earth aeroassisted orbital transfer vehicle missions”, AIAA Paper 83-1513.
NASA Marshall Space Flight Center, 2003, “X-37 demonstrator to test future launch technologies in orbit and reentry environments”, NASA Facts, FS-2003-05-65-MSFC.
Rajesh, K.A., 2002, “Reentry trajectory optimization: evolutionary approach”, AIAA Paper 2002-5466.
Reuther, J.J., Brown, J.L., Prabhu, D.K., McDaniel, R., Saunders, D. and Palmer, G., 2004, “External computational aerothermodynamic analysis of the Space Shuttle orbiter at STS-107 light conditions”, 37th AIAA Thermophysics Conference, Portland, Oregon, Paper no. AIAA- 2004-2281.
Tauber, M.E. and Sutton, K., 1991, “Stagnation-point radiative heating relations for Earth and Mars entries”, Journal of Spacecraft, Vol. 28, No. 1, pp. 40-42. doi: 10.2514/3.26206.
Tran, H.K., Johnson, C.E., Rasky, D.J., Hui, F.C.L., Hsu, M.T., Chen, T., Chen, Y.K., Paragas, D. and Kobayashi, L., 1997, “Phenolic impregnated carbon ablators (PICA) as thermal protection systems for discovery missions”, NASA TM-110440.
Vinh, N.X., Busemann, A. and Culp, R.D., 1980, “Hypersonic and planetary entry light mechanics”, University of Michigan Press, Ann Arbor, MI.
Walberg, G.D., 1985, “A survey of aero-assisted orbit transfer”, Journal of Spacecraft and Rockets, Vol. 22, No. 1, pp. 3-18. doi: 10.2514/3.25704.
Williams, S.D. and Curry, D.M., 1992, “Thermal protection materials thermophysical property data”, NASA RP 1289.
Windhorst, R., Galloway, E., Lau, E., Saunders, D. and Gage, P., 2004, “Aerospace vehicle trajectory design and optimization within a multi-disciplinary environment”, AIAA Paper 2004-704.
Yeniay, Ö., 2005, “Penalty function methods for constrained optimization with genetic algorithms”, Mathematical and Computational Applications, Vol. 10, No. 1, pp. 45-56.
he results of this case study indicate that the aeroassisted technique is much more convenient than “all propulsive” maneuvers, even when considering the increased mass due to the need to give the vehicle a heat shield. In fact, the total budget between the savings in the propellant mass and the increased TPS mass was positive and allows for a substantial increase in the payload mass of the vehicle. he most favorable case is the one with no limit on the entering heat lux and a full ablative heat shield.
he most important future developments and improvements are the following:
• Extension of the analysis to other types of missions. • Extension of the analysis to other types of materials.
• Improvement of the genetic optimizer by coupling it with
LIST OF SYMBOLS
A = see Eq. (17)
a,b = exponents, dependent on ρatm and V
BT = activation temperature, K
Cc= constant, dependent on the atmosphere
CD = drag coeficient
CD0 = zero-lift drag coeficient
CL = lift coeficient
CL,α = derivative of CL wrt angle of attack
CL,max = maximum lift coeficient
Cr = constant, dependent on the atmosphere
cP = speciic heat, J/(kg∙K)
D = drag, N
dt = integration time step, s
F = exterior view factor
f (V) = function, dependent on the velocity
f = itness function
g = gravitational acceleration, m/s2
g0 = gravitational acc. at sea level, m/s2
H = altitude, m
HA = altitude of the initial LEO, m
Hatm = altitude of the sensible atmosphere, m
HB = altitude of the inal LEO, m
Hmin = minimum light altitude, m
HL = heat load, J/cm2
h = enthalpy, J/kg
h = partial heat of charring, J/kg
hd = pyrolysis enthalpy, J/kg
hw = wall enthalpy, J/kg
h0 = total enthalpy, J/kg
hsp = propellant speciic impulse, s
i = inclination, rad
Kcf = collision frequency factor, kg/(m3∙s)
KD = induced drag factor
k = thermal conductivity, W/(m∙K)
L = lift, N
l = current length, see Figs.6(a) and 6(b), m
l ve = vehicle length, m
m = mass, kg
•
m•c = char removal rate, kg/(m2∙s)
m•g = pyrolysis gas mass low rate, kg/(m2∙s)
mTPS = TPS mass, kg
abl
mTPS = mass of the ablative part of the TPS, kg ss
mTPS = mass of the TPS substructure, kg reu
mTPS= mass of the reusable part of the TPS, kg
mTPS, los= TPS mass lost, kg mprop = propellant mass, kg mve, in= inal vehicle mass, kg
mve, in, ap = ”all propulsive” case inal mass, kg mve, i = vehicle mass at atmospheric entry, kg mve, ini = initial vehicle mass, kg
mve, u = vehicle mass at atmospheric exit, kg
n = load factor, g
nr = decomposition reaction order
Q⋅in = net total heat lux at surface, W/m2
Q⋅in, max = maximum entering heat lux, W/m2
Q⋅maxabl = max heat lux for ablative part, W/m2
Qmax
⋅reu = max allowable heat lux for reusable part, W/m2
q = dynamic pressure, kN/m2
q⋅c, blow = net hot wall convective heat lux, W/m2
q⋅comb = combustion heat lux, W/m2
q⋅con = net hot wall convective heat lux, W/m
2
q⋅R = internal radiative heat lux, W/m
2
q⋅rad = radiative heat lux, W/m2
q⋅tot = total heat lux, W/m2
R = radius, m
RA = initial LEO radius, m
Ratm = radius of the sensible atmosphere, m
RB = inal LEO radius, m
Rf, `j` = reward factor for component ‘j’
R⊕ = Earth’s radius, m
rn = vehicle nose radius, m
rb = vehicle body radius, m
S = vehicle reference surface, m2
•
sr = surface recession, m
sr= char recession rate, m/s
STPS, ve = vehicle TPS total surface, m2
T = temperature, K
TBL = bond-line temperature, K
TBL, lim = bond-line limit temperature, K
Tw = wall temperature, K
T∞ = freestream temperature, K
t = time, s
tl = light time, s
V = velocity modulus, m/s
VA = circular orbit speed in initial LEO, m/s
VB = circular orbit speed in inal LEO, m/s
Vi = speed at atmospheric entry, m/s
Vu = speed at atmospheric exit, m/s
w`j` = multiplicative weight of component ‘j’
wcve= vehicle wing cord, m
wsve = vehicle wing span, m
x = mobile coordinate system, y-S, m; or current centerline abscissa, see Fig. 6 (a), m
y = ixed coordinate system, m; or current wing ordinate, see Fig. 6 (b), m
Δi = variation of the orbital inclination, rad
Δhcomb = combustion heat per unit weight, J/kg
ΔVap = “all propulsive” impulse, m/s
ΔV1 = deorbit impulse, m/s
ΔV1,min = minimum deorbit impulse, m/s
ΔV2 = boost impulse, m/s
ΔV3 = circularizing impulse, m/s
α = angle of attack, rad
αc = weighting factor for char mass loss
αg = weighting factor for pyrolysis gases
γ = light path angle, rad
γi = light path angle at atmospheric entry, rad
γu = light path angle at atmospheric exit, rad
δTPS = initial thickness of the ablative part, mm
δTPS = initial thickness of the reusable part, mm
εW = surface emissivity
θ = longitude, rad
μ = gravitational parameter, m3/s2
ρ = density, kg/m3
ρ atm = atmospheric density, kg/m3
σ = bank angle, rad
σSB = Stefan-Boltzmann constant, W/(m
2∙K4)
ϕ = latitude, rad
ψ = heading angle, rad
Subscripts
A = value at initial LEO
ap = “all propulsive”
B = value at inal LEO
BL = bond-line
c = char
l = light
g = pyrolysis gas
HF = heat lux
i = value at atmospheric entry
los = lost
m = mass
prop = propellant
TPS = concerning Thermal Protection System
u = value at atmospheric exit
v = virgin material
ve = vehicle
w = wall
Δi = inclination variation
Superscripts
abl = ablative
ss = substructure