Reinforced Concrete Beam-Column Inverted Knee Joint Behaviour after
Ground Corner Column Loss-Numerical Analysis
Abstract
Beam-column joints are critical component in the load path of reinforced con-crete (RC) frames, due to their role in transferring loads among different RC frame components. The loss of a ground corner column in a RC frame turns an exterior joint into an inverted knee joint and recent code provisions for exterior joints are not sufficient to knee joints because of reinforcement defects in terms of joint vertical stirrups and improper column bar anchorage. This paper investi-gates numerically the behaviour of these joints under a closing moment using nonlinear finite element (FE) analysis with LS-DYNA. Beam’s bar anchorage type and joint vertical stirrups are the main parameters considered next to con-crete compressive strength, longitudinal reinforcement ratio and lateral beam ef-fect. This study indicates that, anchorage beam’s bar with U shaped produces better behaviour than 90° standard hooks or headed ends. Contribution of joint vertical stirrups is more influential with headed bars anchorage. Increasing con-crete compressive strength and beam reinforcement ratio improve joint ultimate capacity. The presence of lateral beams reduces the rate of concrete degradation in the joint after reaching ultimate capacity and increases joint carrying capacity.
Keywords
Beam-column joints, Reinforcement detailing, Headed bars, Numerical analysis, Joint ultimate capacity.
1 INTRODUCTION
From a safety point of view it is important that a RC structure especially its connections should have an adequate level of integrity and high carrying load capacity, in order to produce ductile behaviour that allows distribution of forces under expected loads and redistribution of forces after unexpected events, such as the loss of a ground column. For a robust RC building, local failure shouldn’t lead to total collapse of the structure. The behaviour of a structure after an initial damaging event is a critical issue, this is noticed in the EN 1990 (2002) Eurocode basic requirements for building safety and design which states: ‘A structure shall be designed in such a way that it will not be severely damaged by events such as explosion and the consequences of human errors.’ This led to the use of column loss scenario in which a key vertical element is removed and the structure analysed to predict if further failure is possible or not. This situation has been inves-tigated by many researchers to determine the failure mechanisms and ultimate capacity of a damaged structure in both steel and RC structures. Chen et al. (2012) attributed the steel beam higher stiffness after a column removal to the integrity with the slab through shear studs. Yap and Li (2011) concluded that the resistance to progressive collapse increases with using joint seismic reinforcement detailing. Qian and Li (2013) showed that with seismic reinforcement detailing; double curva-ture deformation improves building load redistribution ability after corner column loss. Gouverneur (2014) recorded an improvement in the RC slab membrane tensile capacity after column removal with using continuous bars rather than with curtailed bars. Yihai et al. (2014) developed a simplified and refined numerical models showing that, the displacement and ultimate load carrying capacities of RC frame are improved by using seismic regulations. All these research work showed that, using special seismic detailing can mitigate the risk of progressive collapse to some extent.
Progressive collapse experimental simulation after a sudden damaging event is time consuming and expensive. Al-ternatively, numerical FE method is one of the most powerful and general methods of structural analysis. The majority of numerical investigations of the behaviour of RC members under a column removal scenario involve two-dimensional idealizations. This simplification provides good results with Gouverneur (2014) when a slab membrane tensile action investigated numerically with DIANA, but in case of beam-column joints the results may be of questionable accuracy; how to consider joint stirrups confinement effect and lateral beam effects. Three- dimensional modeling has many ad-vantages over the two-dimensional idealizations, in terms of applying load and specifying boundary condition close to the
B. Abdelwaheda * B. Belkassemb J. Vantommea,b
a
Department of Mechanics of Materials and Constructions (MEMC), Faculty of Applied Sciences and Engineering. Free University of Brussels, Brussels, Belgium. E-mail: [email protected], [email protected].
b
Department of Construction Engineering and Materials, Royal Military Academy Brussels. Brussels. Belgium. E-mail: [email protected],
*Corresponding author
http://dx.doi.org/10.1590/1679-78254515
real structure; also dilation of concrete and confinement effects can be taken into account. Yihai et al. (2014) conducted studies on the RC assemblies with internal column removal scenario using LS-DYNA simulating the improvement of its behaviour by catenary action mechanism.
Ravi and Giovacchino (2014) studied the effect concrete compressive strength, percentage of beam and column flex-ural reinforcement on the performance of exterior beam-column joints and they stated that the first two parameters affect the joint performance significantly but the last parameter doesn’t. Researchers (Yap and Li (2011), Qian and Li (2013) and Yihai et al. (2014)) have focused on simulating flexural behaviour of beams and columns adjacent to the joint region assuming intact and perfect detailed joints and are not focused on joint brittle expected failure modes due to its current reinforcement detailing defects.
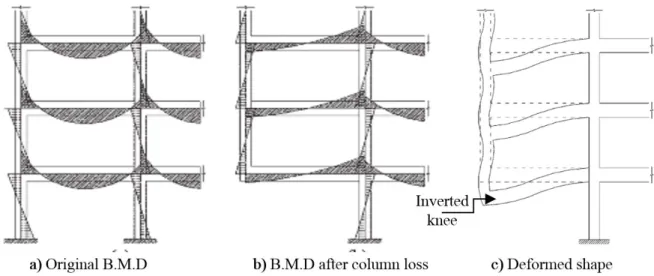
Ground corner column loss turns an exterior beam-column joint into an inverted knee joint as shown in Figure 1; this causes some reinforcement deficiencies, such absence of joint vertical stirrups and column longitudinal bars with poor anchorage condition. Figure 1.a and Figure 1.b illustrate the change in bending moment diagram (B.M.D) of a structural frame under gravity load action before and after the ground corner column loss, respectively. Figure 1.c illustrates the formation of inverted knee joint under closing action as a result of column damage. Previous studies on interior and exterior beam-column joints assume that the reinforcement detailing of the joint directly above the corner column to be removed, is sufficient. The real joint case is a beam-column joint with poor anchorage of the column bars and without vertical stirrups.
In this study, first, a numerical model with LS-DYNA program is suggested for a standard knee joint and for verifi-cation of its results, comparison to Wallace et al. (1998) experimental results is done. Numerical model achievements and drawbacks are evaluated and discussed.
This paper aims to develop and validate a numerical model of the resulting inverted knee joint after a corner column loss. The model is then used to assess the performance of the joint considering different reinforcement detailing: (i) stand-ard detailing as recommended by the regulation codes, (ii) seismic detailing, often recommended in literature about pro-gressive collapse mitigation, and (iii) detailing prescribed for a knee joint.
Figure 1: RC frame moment distribution before and after column loss and deformed shape (Yap and Li, 2011).
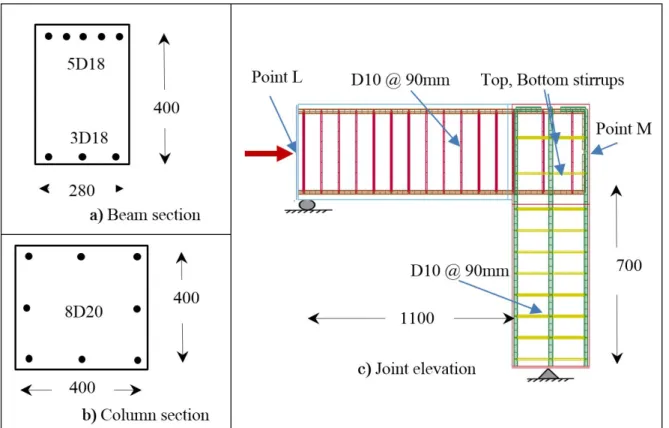
2 DESCRIPTION OF SELECTED REFERENCE EXPERIMENTAL TEST
In knee beam-column joint studied by Wallace et al. (1998), the column has a cross section of 400 mm x 400 mm with an overall length of 1100 mm and the beam has a cross section of 280 mm x 400 mm with 1100 mm clear length. The top and bottom longitudinal reinforcements in the beam are bent down and up into the column. The beam is reinforced using 5 bars of diameter 18 mm as top and 3 bars of diameter 18 mm as bottom longitudinal bars and transverse steel with bars of diameter 10 mm and repeated each 90 mm. The column is reinforced with 8 bars of diameter 20 mm as longitudinal bars and bar of diameter 10 mm ties spaced 90 mm. The dimensions and reinforcement details of the specimen are shown in Figure 2. The load is applied at point L and the joint horizontal displacement is recorded at point M as shown in Figure 2.c. The control of the displacement was based on the lateral displacement applied at L as shown in Figure 3. At the beginning, low level testing was done at displacement of 2.3mm then with 3 equal displacement intervals reaching 9.2mm in 13 minutes. The displacement level was then increased to 35mm with displacements intervals of 9mm. The proposed displacement in total is reached in 23 minutes. The mechanical properties of concrete and steel used are as in table 1. More details can be found in Wallace et al. (1998). According to EN 1992-1-1 (CEN, 2004) Ec 2, Annex J.2.2, the reinforcement arrangement for a frame corner under a closing moment should satisfy many requirements such as; minimum area of reinforcement, maximum stirrups spacing, basic required anchorage length, joint shear reinforcement and strong column weak beam principal. Wallace et al. (1998) reference specimen met all these requirements.
Figure 3: Specimen test set up (Wallace et al. (1998)).
Table 1: Material properties of test specimen.
Joint Concrete (MPa) Reinforce-ment Bar size (mm) Yield strength (MPa) Ultimate strength (MPa)
Knee
Compressive
strength 32.9 Stirrups 10 470 710
Tensile strength 4.7 Beam longitu-dinal 18 508 710
Ultimate strain
(%) 0.23 Column lon-gitudinal 20 510 700
3 FE MODEL DEVELOPMENT
FE analysis for RC beam column knee joint is carried out using the three-dimensional non-linear FE code LS-DYNA, LSTC. (2013) this program uses explicit time integration for the dynamic analysis which is suitable for the application of short duration events. With some recent modifications: by minimizing inertia effects, controlling zero energy (hourglass modes) modes of solid elements with reduced integration points and with maintaining convergence this code can be used properly to model quasi static problem as concluded by Tavarez (2001). The following includes; the description of model structural geometry and element type, modeling of materials, boundary conditions and simulation time.
3.1 Structural geometry and element type
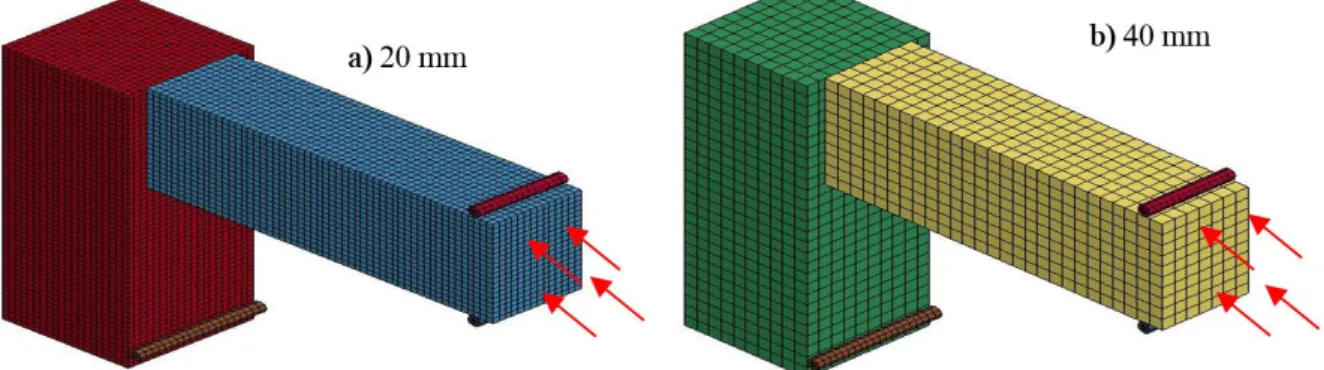
Figure 4 shows the three-dimensional FE model for reference specimen, with two different mesh sizes.
Figure 4: FE meshes sizes for mesh sensitivity analysis.
3.2 Modeling of materials
LS-DYNA, LSTC (2013) has several material models that have been used by researchers to model concrete behav-iour. Most commonly used concrete models are the:
• Plasticity based Karagozian and Case concrete damage model, MAT_72_R3. • Continuos Surface Cap Model, MAT_CSCM_159.
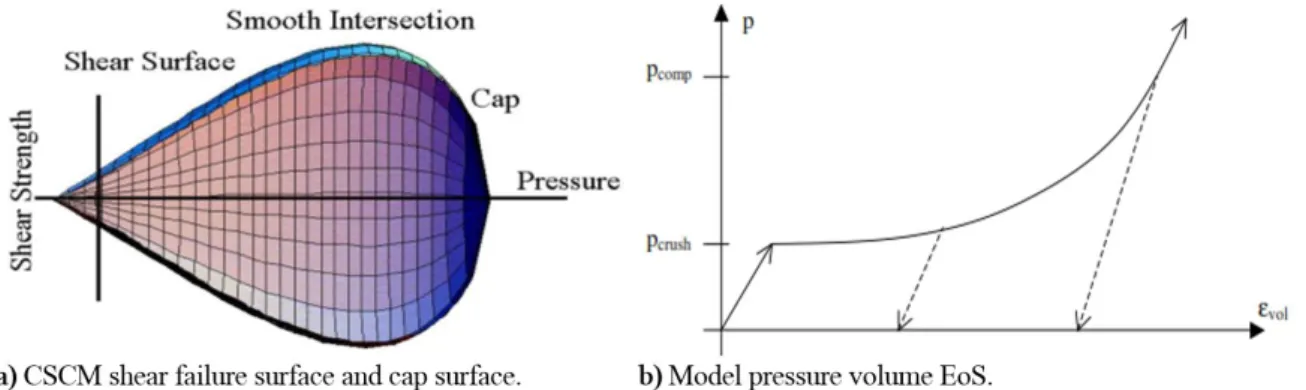
These two material models are both isotropic plasticity models and are successfully used in simulating concrete ma-terial isotropic behaviour, different behaviour in tension and compression, softening in compression and damage in tension and strain rate effect as summarized by Magallanes (2008). The main difference between both these concrete material models is in how deviatoric and volumetric responses are characterized. The main feature of MAT_CSCM_159 model is that; no need to define equation of state (EoS) as the shear failure and compaction (cap) surfaces are blended together to form a smooth and continuous failure surface to embody the shape of pressure-volume strain systematically, considering concrete element failure and taking into account confining effect from zero to low confining pressure level, subsequently this material model is used in this study.
The MAT_CSCM_159 model was developed to simulate the RC barriers walls under impact loading. Minimum ma-terial basic inputs: concrete compressive strength (FPC); aggregate size (DAGG) and used units (UNITS) are required. Other needed parameters (mass density RO, erosion factor ERODE and predefined damage parameter PRED) for concrete as presented also in table 2.
Table 2: Material input card of MAT_CSCM_159 material model for concrete elements.
1 MID RO NPLOT INCRE IRATE ERODE RECOV ITRETRC
1 0.0023 1 0.0 0.0 1.0 0.0 0.0
2 PRED 0.0
3 FPC DAGG UNITS
32.9 10.0 1
Figure 5.a presents the general shape for yield surface to this material model. This surface combines the shear failure surface with the hardening cap surface smoothly. The yield surface function can be defined as:
2
2
1 2 3 2 3 1 1
Y I , ,J J J R J .F If .F Ic ,K (1)
Where
I
1is the first invariant stress tensor,J
2 andJ
3are the second and third invariants of deviatoric stress tensor,
3R J
is the Rubin reduction factor to account for lower concrete strength under triaxial extension and torsion compared
1
d d vp
(2)
Where d is the stress tensor with damage, vp is the stress tensor without damage and d is the scalar damage parameter. Among different concrete material models, EoS for this material model, which determines the nonlinear behaviour of concrete by calculating pressure as a function of volume change is built in as shown in Figure 5.b. The theoretical description of CSCM_159 Concrete model are provided in more details in Murray et al. (2006).
Figure 5: Concrete material CSCM characteristics (Murray et al., 2006).
The material used for reinforcement bars (longitudinal and shear reinforcements) is PIECEWISE_LINEAR_ PLAS-TICITY (MAT_024) which provides the flexibility to define either a bilinear elastic-plastic behaviour as introduced by Mario et al. (2017), or an arbitrary post-yield stress-strain curve. Although different meshes are used for concrete and steel, using solid and beam type elements, respectively, their degrees of freedom are coupled with kinematic constraints which achieve deformation compatibility. This is performed using the option CONSTRAINED_ LAGRANGE_IN_SOLID (CLIS) within LS-DYNA as successfully calibrated and used by Len (2014). This CLIS coupling mechanism is a penalty based approach used to avoid bars beam element nodes penetration to master concrete solid element.
3.3 Boundary Conditions
The load on the beam-column joint is applied by specifying a prescribed horizontal displacement to the nodes of the beam end as shown in Figure 2.c and Figure 3. To simulate simply supported conditions, a group of beam end nodes are prevented from vertical movement and a group of column end nodes are prevented from both vertical and horizontal movement as shown in Figure 2.c.
3.4 Event Simulation Time
The flexural frequency of vibration is computed for the considered beam-column joint according to Thompson and Dahleh (1998) and equals 543.19 rad/sec. The event simulation time is chosen to be 1.5 sec which is approximately more than 100 times period of flexural vibration. Consequently, inertial effects can be assumed to be negligible and the model can be used to represent a quasi-static experiment.
3.5 Run Time
Generally, for quasi-static structural simulation problems, implicit methods are more relevant than explicit methods especially when limited nonlinearity is expected; in the current study, inverted knee joint with improper reinforcement details high nonlinearity is expected due to reinforcement defects, it is not easy to model the nonlinearity and progressive damage/failure using an implicit code as Tavarez (2001) concluded. For that explicit time integration will be used in this study. A shortcoming in using an explicit code to simulate a quasi-static experiment is the fact that it can result in excessive run times which will limit mesh refinement trials to three. All the models were processed in the same computer, its con-figuration is a Pentium III PC 600 MHz dual processor with 512 MB of RAM with LS-PrePost processor software version 4.1 with finite element software LS-DYNA solver version ls-dyna_smp_d_R700_winx64_ifort101.exe.
4 COMPARISONS OF EXPERIMENTAL AND NUMERICAL RESULTS
4.1 knee joint experimental results
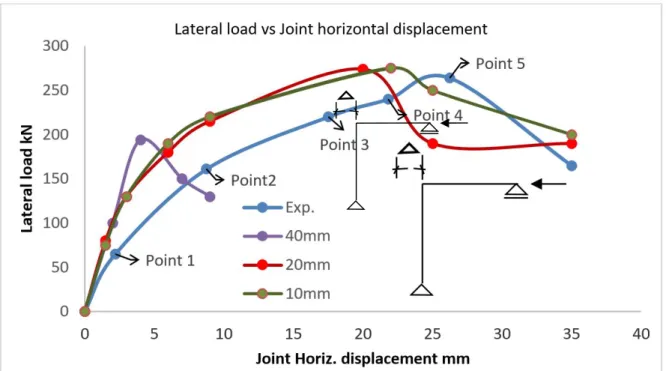
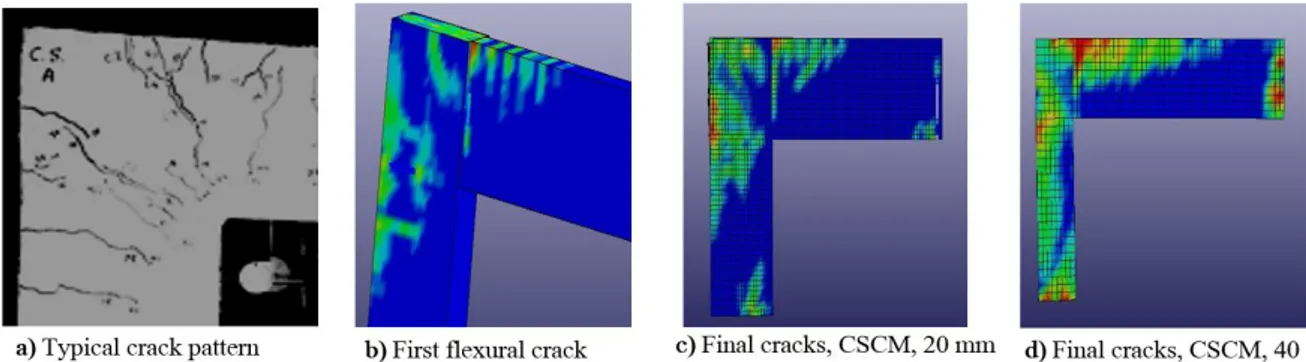
The first crack was observed in the beam at column face due to flexure corresponding to horizontal displacement of 2.2mm (point 1) as shown in Figure 6, when the joint displacement was increased to 8.75mm flexural cracks continued to form usually where stirrups were located (point 2). On further increasing the joint displacement to 17.5mm, the diagonal crack appeared in the joint due to tensile splitting and shear deformations (point 3). With continuous loading, cracks spread on the side joint faces, low concrete cover strains were measured on the top of the joint and both beam top bars and column outer bars reached yielding limit at displacement of 21.8mm (point 4). Point 5 presents joint ultimate capacity corresponds to displacement 26.25mm after that a drop in stirrups strain and spalling of beam concrete top cover took place to specimen failure. The final joint failure was due to shear, which was marked by visible cracks as illustrated in Figure 7.
4.2 Numerical model results
In order to better simulate experimental conditions, the numerical models are analysed in a similar displacement control in LS-DYNA. Figure 6 shows the numerical results in comparison with the experimental curve of the load vs. horizontal joint displacement. From Figure 6, joint load carrying capacity increases with decreasing mesh size, converging to the experimental one at a mesh size of 10 mm. Model with element size 40mm, records stiff response at the beginning, reaching its ultimate capacity earlier and with loading many concrete solid elements are damaged as clear in Figure 7.d. From the convergence study, a mesh size of 20 mm was found to be appropriate for the concrete parts as it gives a closer result compared to experimental one and finest model as well with reasonable CPU time. Model with finer element size 10mm did not show significant change in model ultimate capacity and requires much more time; from that, model with concrete element size 20mm will be used in the next parts for more parametric studies. This model element size also satisfies the recommended ratio among concrete element size and concrete aggregate size and gives the closer ultimate capacity to the analytical value.
As a conclusion, this simulation was able to reproduce the main features of joint behaviour such as the joint ultimate capacity, the resulting cracking pattern and the displacement capacity. The noticed softening of numerical model resistance after peak ultimate capacity is due to reduction in beam top bars forces which have happened as a consequence of concrete element erosion at beam top side near to the joint face. In addition, numerical model findings regards to beam bars forces at joint face, column bars forces at joint face and both joint horizontal and vertical stirrups forces are found closer to experimental test results with 4, 10, 4 and 6% error ratio respectively.
Figure 7: Comparison of cracking pattern of RC joint with different element sizes.
Figure 6 also shows that the primary stiffness of the model was over estimated in the numerical analysis, one of the main reasons for that is, this material model CSCM way of predicting young’s modulus according to dynamic loading. The young’s modulus of concrete has a great effect on structures response especially at its primary loading stages as mentioned in LSTC (2013). The concrete model CSCM has two ways for material parameters input; the first by using MAT- CSCM CONCRETE with automatic material input (short format) depending on limited requirements as mentioned previously, all other material parameters were calculated to fit with crash barrier test which may overestimate material shear and bulk modulus, the latter is to use a general version of MAT- CSCM (long format) which requires more than 30 parameters and one has to define all these parameter independently, with this option the effect of concrete young’s modulus in terms of material bulk and shear modulus can be checked. We further compare the predictions of lateral load–displace-ment relationship with different values of young’s modulus. The results demonstrate that the model with 13% reduction is capable of offering good agreement compared to experimental one as shown the Figure 8 and in the meanwhile better represent quasi-static problem. Table 3 shows the maximum lateral load carrying capacity for the different mesh sizes and the approximate run times associated with each of the mesh sizes, added to that the number of elements associated with each mesh size. Finally, table 4 shows how numerical results prediction correlate to experimental results through compar-ing the formation of first crack, diagonal crack, yieldcompar-ing of beam top bars and joint ultimate capacity in terms of joint horizontal displacement value.
Figure 8: Effect of Concrete young’s modulus on model primary stiffness.
Table 3: Numerical results for models with different element sizes.
Mat ID, mesh size No. of elements Load carrying capacity [kN] Approximate Run Time[sec]
CSCM, 10 mm 64350 275 72560
CSCM, 20 mm 39208 274 20580
CSCM, 40 mm 5504 194 1920
Experimental= 264 kN Analytical= 275.3 kN
simulate quasi-static problems. To some accepted extent, the previous paragraphs showed the validation of the numerical model to experimental results of the RC beam-column knee joint. In the further sections, the validated FE model is adjusted to investigate the performance of inverted knee joints resulted after ground corner column loss evaluating the reduction in their ultimate load carrying capacity. Then the influence of other parameters thought to improve these joints performance and their load carrying capacity; concrete compressive strength, beam reinforcement ratio and lateral beams are evaluated and discussed.
Table 4: Experimental and Numerical results in terms of joint horizontal displacement.
First crack
Point 1 Joint Diagonal crack point 3 Main Reinforcement yielding point 4 Ultimate capacity point 5
Exp. 2.2 mm 17.5 mm 21.8 mm 26.25 mm
Num. 3 mm 16.7 mm 19 mm 20 mm
5 PARAMETRIC STUDIES
The response of the RC inverted knee joints to different key parameters is studied in the following section and dis-cussed.
5.1 Beam Anchorage Type and Joint Vertical Stirrups
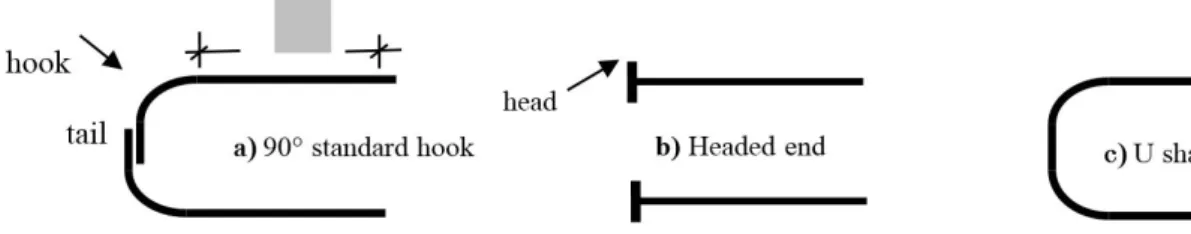
Beam longitudinal bars may be anchored by 90° standard hook, headed end and U shaped end. Figure 9 presents schematic drawings for the beam’s different anchorage ends.
Figure 9: Different alternatives for beam bars end anchorage.
The anchorage configurations; Figure 9.a illustrates the following details: (1) horizontal anchorage (
L
dh), (2) hookand (3) extension of the hook (tail). The minimum horizontal anchorage (
L
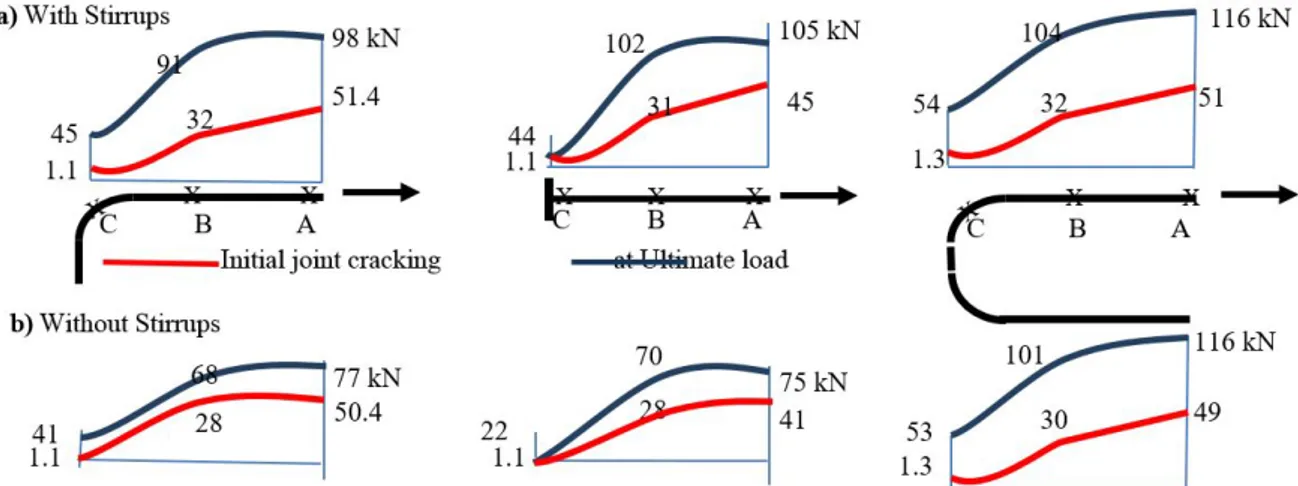
dh) is necessary to transfer the tensile stress in the flexural reinforcement in to the joint. The hook is responsible for the formation of the compression strut which in the case of knee beam-column joints is one of the major load transfer mechanisms from beam to column through the joint core. Sufficient extension tail of the hook is necessary to prevent the pullout of flexural reinforcement, Figure 9.b presents headed bar ends by mounting a steel plate at the bar end instead of the hook portion and it’s vertical tail, in order to decrease steel congestion and ease concrete placement. With regard to the headed bars, head can be defined numerically by two ways; by specifying larger area to the beam end element or tying end nodes of the beam with the surrounding concrete nodes using the CONSTRAINED _INTERPOLATION card as in Yihai et al. (2014).Figure 9.c presents U shaped bar by adjoining both beam top and bottom reinforcement in one in order to improve bond resistance between concrete and beam main rebar. Beam elements A, B and C in Figure 10.a, are selected on beam top bars at joint face, joint middle and bar straight end location respectively. Figure 11 presents the bar force variation at first cracking and peak load as well. In case of joint with hooked end bars, beam top bar forces are increased due to vertical stirrups existence from 77 to 98 kN which is closer to analytical findings of Orangun et al. (1977) which were 72 to 97 kN based on Eq. 3:
'
4.15
0.1 0.25
41.5 tr yt
b min b
b d b
c
A f
u c d
d l s n d
f
(3)
1/4
1.4 1.2 0.3 beam . . 0.4. . jh eff col c tr yt
col h
V b h f A f
h
(4)
In which
u
bis concrete bond strength,c
minconcrete minimum cover,d
bis bar diameter,l
dis embedded bar length,tr
A
confining stirrups in the joint,f
yt is stirrups yield strength, s is bar spacing, n is number of anchored bar,V
jh is jointhorizontal shear stress,
b
eff is joint effective width.Beam bars with headed end anchorage due to less contact with joint concrete recorded lowest bar force in case of joint without stirrups and on the other side recorded highest improvement in case of providing these stirrups among dif-ferent anchorage alternatives as plotted in Figure 10.c.
The final beam bar forces in case of joint with vertical stirrups was found 105 kN which is in a good agreement with Hegger et al. (2003) finding according to Eq. 5 as it predicts this force to be 103.8 kN
1/4
1.55 1.2 0.3 bem . . 0.45. .
jh eff col c tr yt
col h
V b h f A f
h
(5)
Figure 10.b shows the column outer bar force at location D as a ratio to the bar yielding force in different anchorage cases. It is noticed that higher load was mobilized for U shaped end than in the other two anchorage as column bars reached yield limit and exceeds it at later loading stages and this is referred to good splice condition between column and beam bars, this splice efficiency decreases in hooked and headed anchorage cases because the available splice length decreases respectively.
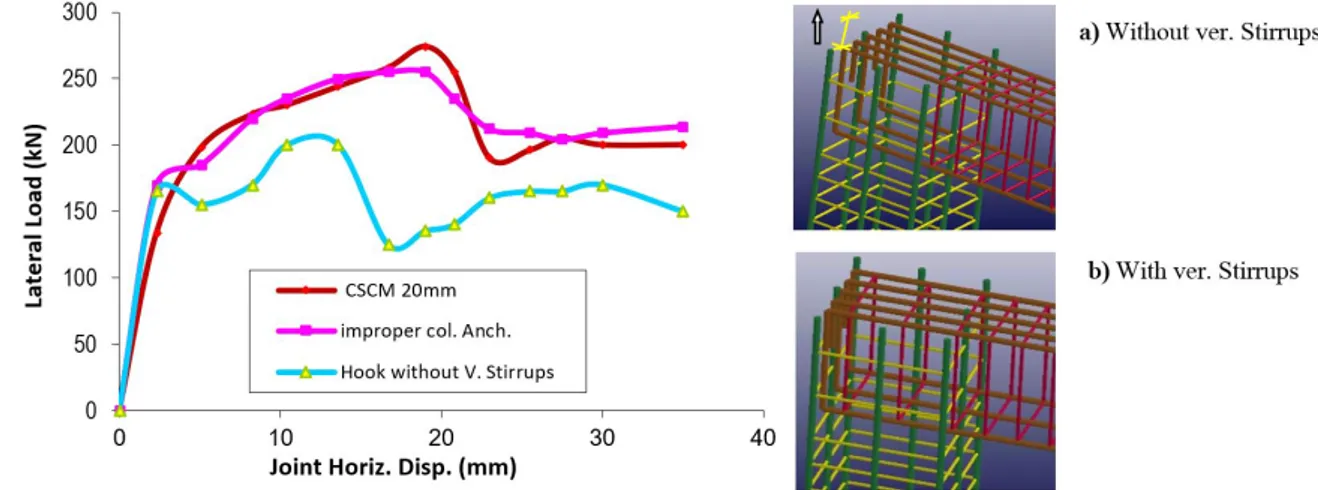
As an example, in the model with standard hook without vertical stirrups, it reaches its limited ultimate capacity earlier than the normal model and the one with improper column anchorage with vertical stirrups as a result of the damage in larger areas in joint zone because of insufficient confinement conditions for concrete inside the joint as shown in Figure 12.
Among the considered anchorage configurations, the headed end without joint vertical stirrups exhibited weakest behaviour when compared to other configurations; this explained by the fast rotation of the beam top bars at the beam-column interface, which goes together with accelerated bond deterioration for beams bar. This may be observed in Figures 10.b, d results. Figure 10.d shows also that a U shaped bar has better performance when compared to the other anchorage configurations, this can be attributed to the better confinement for concrete core in the joint, in addition to that a trivial improvement in joint capacity with providing vertical stirrups is noticed, which is due to lower ratio of provided stirrups cross section area compared to longitudinal anchored bar.
As it is known, joint shear reinforcement resists load only after first concrete cracking and works to limit the opening of these cracks, thus enhancing shear transfer capacity by aggregate interlock. First crack took place at joint displacement of 3 mm as a result a high forces are formed in both vertical and horizontal stirrups after this point. In Figure 13 the increase of joint transverse (vertical and horizontal) stirrups with the progress of loading are presented. It is obvious in fig 13.a high increasing rate in joint vertical stirrups force in case with headed end than in other anchorage types, this gives an indication about the important role of vertical stirrups in improving interaction of headed bars with concrete core in the joint. A force-displacement curve that shows the influence of column bar anchorage on joint horizontal stirrups (top and bottom) is presented in Figure 13.b. Horizontal stirrups and tail of hooked column’s bar prevent and limit column outer bar rotation outside the joint, as a result just top stirrup reaches yield limit in contrary to what happened in case of improper column anchorage, both top and bottom horizontal stirrups reach yielding limit.
As a conclusion, compared to the numerical model for standard knee joint in previous section; column’s bar anchorage deficiencies in joint recorded a reduction in joint ultimate load capacity of 27, 7% with hooked beam’s bar for case without and with joint vertical stirrups respectively and 31, 4.5% with headed beam’s bar for case without and with joint vertical stirrups respectively. No reduction is recorded in case of using U shaped ends for beams bar.
Figure 10: Substandard knee joints with different anchorage alternatives.
Figure 12: Stirrups effect on RC joint with hooked beam bars anchorage.
Figure 13: Variation of joint transverse reinforcement forces with loading.
5.2 Influence of concrete compressive strength
Figure 14: Parametric studies on Lateral Load versus Joint Displacement.
5.3 Influence of increasing beam reinforcement ratio
An increase in the beam reinforcement (b) ratio increases the stiffness of the hook. The increased stiffness of the hook provides better confinement to the joint concrete core and also participates in the forming of compression strut mech-anism which in turn increases the load carrying capacity of the knee joint. In this study, the beam reinforcement ratio (b) is varied between 1.26%, 1.56% to 2.43%. The corresponding bars reinforcement cross section area of these ratios are 1271.7 mm2, 1570mm2 (5 bars of diameter 20mm) and 2455mm2 (5 bars of diameter 25mm) respectively. The results
shown in the Figure 14.b indicate that the increase in the beam reinforcement percentage has a positive effect on the load carrying capacity and the rate of strength degradation. The numerical models load carrying capacities ratios to experimental load are found 1.03, 1.18 and 1.21 respectively. Increasing beam reinforcement ratio (b) to 2.43% did not show a superior performance over the rest simulations and this result supports the claim for putting upper limit on the main reinforcement ratio as recommended previously by Francesco (2015).
5.4 Influence of Lateral Beams
In this study, the lateral beam will be assumed 280 mm in width and 400 mm in depth, such that it covers 75% of the joint faces satisfying Eurocode 8, EN 1998-1 (Eurocode 8, 2003) requirements regarding the size of the lateral beams. After elimination of one raw of ground exterior columns, the lateral beam straining actions are found small which validate current study free end assumption for lateral beam ends as presented in Figure 15.a. Figure 15.b shows that up to high drift ratio, there was a little difference in the lateral load resistance of specimens with lateral beams compared to the joints without lateral beams. Afterwards, the specimens with lateral beams showed approximately 7.5% increase in the maximum lateral load resistance than what exhibited by normal joint. The Figure also shows that specimens with no lateral beams experienced higher rate of strength degradation than what those with lateral beams experienced.
6 CONCLUSIONS
In this paper, the nonlinear FE analysis software LS-DYNA is used to discuss the response of a RC inverted beam-column knee joint resulted after a corner ground beam-column loss. Numerical models are proposed that allow the following: 1. U shaped beam bars end anchorage is better for progressive collapse resistance in terms of reducing joint rotation at beam joint interface
and ductility is also improved by providing reinforcement continuity.
2. Adding joint vertical stirrups is more efficient with using headed end anchorage rather than with the other two anchorage types. 3. Increasing the concrete strength from 32.9 to 50 MPa increases the sustained lateral load resistance by 35%. Specimens with lower
concrete strength develop their maximum lateral resistance earlier than those with higher concrete strength.
4. Increase in the percentage of beam reinforcement (b) with certain upper limit increases the joint load carrying capacity. This can be attributed to the increased flexural resistance of the anchorage bars which in turn prevents opening of the hook thereby preventing spalling of concrete cover and providing confinement to the joint core concrete.
5. Presence of lateral beams increase joint lateral load resistance by approximately 7.5% compared to the ones without lateral influences. The confinement provided to the joint by the presence of lateral beams increases the joint shear capacity and therefore reduces the shear distortion in the joint. Also at high drift ratio, reduces the strength degradation.
Acknowledgments
The author would like to express his thanks to Dr. Leonard Schwer for assistance in numerical simulations with LS-DYNA.
References
Chen, J.L., Xin, H., Renle, M., Minjuan, H. (2012). Experimental Study on the Progressive Collapse Resistance of a Two-Story Steel Moment Frame. Journal of Performance of Constructed Facilities, Vol. 26, No. 5: 567-575.
https://doi.org/10.1061/ (ASCE) CF.1943-5509.0000287.
Ehsani, M.R., Alameddine, F. (1991). Design Recommendations for Type 2 High- Strength Reinforced Concrete Connec-tions. ACI Structural Journal, 88 (3): 277-291.
EN 1990. (2002). Eurocode. Basis of structural design.
Eurocode 8. (2003). EN 1998-1: Design provision for earthquake resistant structures. General rules- specification rules for various materials and elements, European Committee for Standardization, Brussels.
European Committee for Standardization – CEN (2004). EN 1992-1-1: Eurocode 2: Design of concrete structures - Part 1-1: General rules and rules for buildings.
Francesco, M. (2015). Use of Headed Reinforcement Bars in Construction, Ph.D. Thesis, Technical University of Madrid, Spain.
Gouverneur, D. (2014). Experimental and Numerical Analysis of Tensile Membrane Action in Reinforced Concrete Slabs in the Framework of Structural Robustness, Ph.D. Thesis, Ghent University, Belgium.
Hasaballa, M.H. (2014). GFRP-Reinforced Concrete Exterior Beam_Column Joints Subjected to Seismic loading, Ph.D. Thesis, University of Manitoba, Manitoba, Canada.
Hegger, J., Roeser, W., Sherif, A. (2003). Nonseismic Design of Beam-Column Joints. ACI Structural Journal 100(5):654-664.
Len, S. (2014). Modeling Rebar: The Forgotten Sister in Reinforced Concrete Modeling, 13th-international-ls-dyna-con-ference.
Magallanes, J.M. (2008). Importance of Concrete Material Characterization and Modeling to Predicting the Response of Structures to Shock and Impact Loading, Proceedings of the Tenth International Conference on Structures Under Shock and Impact. Algarve, Portugal, May 13th-15th.
Mario, B., Anastasio P. S., José, M. G. (2017). Development of Practical Finite Element Models for Collapse of Reinforced Concrete Structures and Experimental Validation. Shock and Vibration, vol. 2017, Article ID 4636381, 9 pages. doi:10.1155/2017/4636381.
Murray, Y.D., Abu-Odeh, A., Bligh, R. (2006). Evaluation of Concrete Material Model 159 report, FHWA-HRT-05-063, June.
Orangun, C.O., Jirsa, I.O., Breen, J. E. (1977). A Reevaluation of Test Data on Development Length and Splices. ACI Journal, vol. 74, no. 3: 114-122.
Park, R., Pauley, T. (1975). Reinforced concrete structures, John Wiley and Sons, New York.
Qian, K., Li, B. (2013). Performance of Three-Dimensional Reinforced Concrete Beam-Column Substructures under Loss of a Corner Column Concrete Scenario. Journal of Structural Engineering-ASCE, Vol.139, No. 4: 584-594.
Ravi, K., Giovacchino, G. (2014). A case study on pre 1970 s constructed concrete exterior beam-column joints. Case Studies in Structural Engineering journal Vol. 1:20-25. https://doi.org/10.1016/j.csse.2014.04.002.
Tavarez, F. A. (2001) .Simulation of Behaviour of Composite Grid Reinforced Concrete Beams Using Explicit Finite Element Methods, MS thesis, University of Wisconsin-Madison, USA.
Thompson, W.T., Dahleh, M.D. (1998). Theory of Vibration with Applications, 5th Edition, Prentice Hall, New Jersey.
Wallace, J.W., McConnell, S.W., Gupta, P., Cote, P.A. (1998). Use of Headed reinforcement in Beam-Column Joints Subjected to Earthquake Loads. ACI Structural Journal, Vol. 95, No. 5:590-606.
Yap, S.L., Li, B. (2011). Experimental Investigation of RC Exterior Beam-Column Subassemblages for Progressive Col-lapse. ACI Structural Journal, Vol. 108, No. 5: 542-552.