ABSTRACT: This paper describes the update and characterization of a previously pure aerodynamics wind-tunnel into a facility able to simultaneously execute aerodynamics and aeroacoustics testing. It is demonstrated that the application of high-performance acoustic materials on strategic positions of the wind-tunnel circuit and punctual actions can substantially reduce the background-noise level. This paper shows eficient measures which resulted to broadband-noise reduction of up to 5 dB and practically complete removal of spectral tones. In addition, it is demonstrated that the applied acoustic treatment reduced the turbulence level, measured at the test-section at maximum operational velocity, from the previous 0.25% level to 0.21%. As a minor penalty, the acoustic treatment reduced the low velocity in 2% for the same electric-power input. Finally, the work described in this paper resulted on a wind-tunnel with good low quality and capacity for aeroacoustics testing.
KEYWORDS: Aeroacoustic testing, Wind-tunnel noise, Wind-tunnel acoustic treatment.
The Update of an Aerodynamic Wind-Tunnel
for Aeroacoustics Testing
Leandro Dantas Santana1, Micael Carmo2, Fernando Martini Catalano1, Marcello A. F. Medeiros1
INTRODUCTION
he recent air transportation growth raised concern to authorities and civil institutions regarding its environmental consequences, among them, the noise. In order to regulate this important environmental impact, authorities established noise restrictions to aircrat certiication and operations. To comply with these increasingly stringent regulations, the aeronautic industry has been, for decades, developing means to reduce the engine noise. With the current state of the art technology, the aircrat engine reached the same noise level as the airframe. Therefore, regarding noise, the engine optimization is no longer the exclusive preoccupation of the aeronautic industry, now, aeroacoustic development of airframe components also challenges the minds of engineers and aeronautical researchers.
his paper is result of a work-package from the Silent Aircrat project – sponsored by Empresa Brasileira de Aeronáutica
(EMBRAER) and Fundação de Amparo à Pesquisa do Estado de São Paulo (FAPESP) with objective to develop critical knowledge on aeroacoustic testing and simulations.
In an international context of building new wind-tunnels for aeroacoustics testing such as the works of Kim et al. (2001), Wickern and Lindener (2000) and Sarradj et al. (2009), or for the adaptation of previously pure aerodynamic wind-tunnel into an aeroacoustic facilities (Remillieux et al., 2008; Künstner et al., 1995), it was decided that upgrading a previously pure aerodynamic facility was the optimal solution for the project requirements and constraints. he chosen wind-tunnel was the closed circuit wind-tunnel LAE-1, situated in the Aerodynamic Laboratory at Escola de Engenharia de São Carlos from the Universidade de São Paulo, Brazil. he work subject of this paper was developed in the period between October 2008 and March 2010.
1.Escola de Engenharia de São Carlos – São Carlos/SP – Brazil 2. Empresa Brasileira de Aeronáutica – São José dos Campos/SP – Brazil
Author for correspondence: Leandro Dantas Santana | Escola de Engenharia de São Carlos | Avenida Trabalhador São Carlense, 400 – Centro | CEP: 13566-590 São Carlos/SP – Brazil | Email: [email protected]
In order to define minimum required levels for noise reduction, it was decided to set, as a target experiment, the measurement of a NACA-0012 trailing-edge airfoil noise at velocity of 30 m/s. he beamforming technique was used for noise sources identiication and possible quantiication (Sijtsma and Holthusen, 1999; Brooks and Humphreys, 2006; Dougherty, 2005). Wind-tunnel background-noise is, in this paper, deined as the noise generated by the wind-tunnel running in stable regime and empty testing chamber.
he LAE-1 closed circuit wind-tunnel was designed originally as a 3/8 scale facility prototype of an automotive wind-tunnel to
be built in the future. he wind-tunnel was originally built in the period between 1997 and 2002, having as predominant material the naval plywood. Due to the Brazilian automotive industry difficulties in the early 2000s, and the national aeronautic industry rebirth, this previously automotive wind-tunnel, became a multi-task facility with instrumentation mainly focused on aeronautical testing, able to perform a diverse range of industrial and academic tests. Figure 1 presents the drawings of the LAE-1 closed circuit wind-tunnel.
he wind-tunnel test section dimensions are 3.00 m long, 1.30 m high and 1.70 m wide. he maximum design low speed
Figure 1. Plan view of the LAE-1 wind-tunnel.
2.20 5.20
A E
2.47
21.44
D
1.75
C B
4.55
3.24
rotor
B C B
D D
B
B
E
D A
B
1.70
3.5 2.49
E – E D – D
C – C B – B
A – A
1.30 1.75
is 50 m/s, with turbulence level of 0.25%, nowadays, due to operational safety and components endurance, the maximum speed is limited to 45 m/s. Its 110-HP-electric motor drives an eight-blade fan, with seven straighteners located downstream the fan. In the low stabilization section, there are two mesh screens with 54% porosity, followed by a 1:8 contraction cone designed using two 3rd order polynomials, joined at
45% from the inlection point. he relative low turbulence level, considering the installation of only two screens and no honeycomb, is attributed to the care taken during the design and construction of low angle diffusers, low-drag corner-vanes and high-eiciency rotor blades, optimized using a combination of Computation Fluid Dynamics (CFD) and semi-empirical techniques (Catalano, 2001).
THE BACKGROUND NOISE
REDUCTION PROCESS
The LAE-1 background noise reduction campaign was developed in three phases: a irst phase, where conceptual solutions, either innovative or inspired on literature, were multidisciplinary and evaluated as to their eiciency, feasibility and budgetary constraints. his irst phase was followed by two steps of efective implementation. In the irst step, the efect of pure wall treatment was evaluated, whose results indicated the need of a second step of acoustic treatment, where, in order to achieve the noise reduction target, the addition of an acoustic bale and fan treatment was implemented.
PRELIMINARY CONCEPTS FOR THE PROJECT
In order to establish the noise reduction target, it was deined an objective experiment to be done after the wind-tunnel adaptation. The requirements for this experiment were its representativeness of future tests campaign and the detailed availability of results in the literature to be used as a validation data, the self-noise measurement of a NACA-0012 airfoil, carried-out by Brooks et al. (1989), was chosen as an ideal experiment to fulill those requirements .
An initial wind-tunnel noise assessment was conducted in order to determine the most critical noise condition. From this evaluation, it was found that the low speed of 31 m/s is the most critical condition, due to the existence of fan excited structural resonance. For this reason, this speed was set as
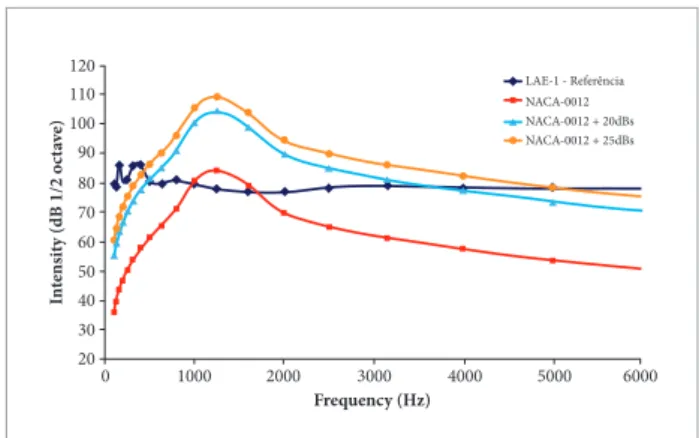
reference for the measurements shown in this paper. Figure 2 shows a comparison of the LAE-1 baseline background noise level and the NACA-0012 airfoil noise.
At Fig. 2, the NACA-0012 self-noise was calculated using semi-empirical methods described by Brooks et al. (1989). For these calculations, it was considered a 0.20 m chord airfoil spanning the wind-tunnel test section, subjected to a 31 m/s low speed and an angle of attack of two degrees.
Figure 2. NACA-0012 noise compared with the wind-tunnel background noise.
NACA-0012 + 20dBs
20
1000 0
60 50 40 30
3000
2000 4000 5000
LAE-1 - Referência
90 80 70 120 110 100
6000
Frequency (Hz)
In
te
ns
it
y (dB 1/2 o
cta
ve)
NACA-0012
NACA-0012 + 25dBs
From Fig. 2, it is noticed that, without post-processing for noise source separation, it is only possible to measure three octave band frequencies, localized from 1 kHz to 1.6 kHz. his clearly justiies the need of wind-tunnel background noise reduction in conjunction with the use of a microphone array to increase the measurable bandwidth. For this paper, the post-processing technique considered is the traditional delay-and-sum beamforming. For a microphone array, it is a rule of thumb used to compute the maximum signal to noise ratio (DdB), measurable by an array with M microphones as proposed by Shin et al. (2007):
∆dB = 10log10M (1)
possible to identify sources 25 dB less intense than the wind-tunnel background noise level. Adopting these hypotheses, it can be concluded that it is possible to measure a NACA-0012 airfoil noise sources for all the region of the orange line of Fig. 2. In addition to that, ater a wind-tunnel background noise reduction of 5 dB, it would be possible to measure the full range of frequencies of interest, from 500 to 8.000 Hz, for the NACA-0012 airfoil.
THE FIRST WIND-TUNNEL NOISE REDUCTION PHASE
he irst phase of acoustic treatment consisted of applying melamine foam on the selected section walls. Several regions of the wind-tunnel were considered for the foam application. Sections with adverse pressure gradient were discarded due to the boundary layer separation risk induced by increasing of the roughness, possible imperfections on the foam supericial inishing, or steps between the foam plates, which may occur on installation or during the operational life of the tunnel. he settling chamber was also discarded due to the risk of negative effects on the flow stabilization. Therefore, the remainder regions A and B from Fig. 3 were chosen as the best candidates for foam application.
efect on the wind-tunnel low velocity, once this area has a lower low speed and bigger cross-sectional area. To achieve the acceptable margin of 1.5% of low velocity reduction, on the testing chamber, it was decided to apply a 2 cm thick foam on walls A and 5 cm thick foam on walls B.
THE SECOND WIND-TUNNEL NOISE REDUCTION PHASE
In order to increase the noise reduction achieved so far, the second and deeper noise reduction task was conducted.
To reduce the noise at lower frequencies, an acoustic baffle (element D from Fig. 3) was installed between the walls A, dividing the inner sections from the first and second corner vanes. With the installation of this baffle, it was expected a flow speed reduction of no more than 2%, referring to the wind-tunnel baseline conditions. The acoustic baffle construction scheme is shown in Fig.4.
Figure 3. Wind-tunnel regions that received acoustics treatments.
The next step was to define the thickness of the noise absorbent layer. It was performed an analysis of sensitivity for reducing the transversal area, due to the foam thickness on the testing chamber low velocity. Calculations, made with the help of the wind-tunnel design model, showed that the section reduction on the region of the walls A (see Fig. 3) leads to a very sensible impact on the wind-tunnel low velocity. he main reason for this is its comparatively high low speed and, therefore a signiicant pressure loss. he reduction of the cross-section of the region of the walls B (see Fig. 3) has a minor
Figure 4. Acoustic bafle construction scheme.
Perforated plywood
Acoustic baffle
lateral view
10 mm 20 mm
90 mm
Perforated plywood
40 mm
Polyurethane foam Glass wool
(Camargo et al., 2007). To avoid this problem, polyurethane foam was used as illing material in the regions where the gap was greater than 3 mm. he foam leading edge and trailing edge were shaped to guarantee smooth geometric transition. Figure 5 (a) presents the region with greater gap and (b) shows the same region, ater the tip treatment, with polyurethane foam.
edge and the electric motor that drives the fan. his last noise source is mainly related with the speed controller that excites the electrical coil inside the motor producing noise.
It is quite diicult to identify and treat each noise source separately; instead it is more practical and eicient to line the noise propagation path in order to isolate a region of interest, and consequently this approach is adopted in this work.
For low low speeds, it can be considered that the main wind-tunnel noise source is the sum of the fan and the turbulent boundary layer. Considering this, it was decided to line the region downstream and upstream of the fan, in order to treat both directions of the propagation path of the noise generated by the fan. he upstream distance from the fan to the testing chamber is smaller than the downstream one; therefore, it was preferred to add, as much as possible, acoustic treatment on the region comprised by the walls A (see Fig. 3). In the upstream direction, the settling chamber screens can be considered as a sudden increase of acoustic resistance, which tends to relect the acoustics waves back, attenuating the noise generated by the fan propagated upstream. To better identify and diferentiate the noise sources generated by the fan from the one generated by the low, the noise spectra were analyzed on three diferent low speeds: 15 m/s, 31 m/s and 37 m/s. he results are presented on Figs. 6, 7 and 8. For low speed (15 m/s), it is expected the fan noise to predominate, while for low speeds up to 37 m/s the noise from turbulent boundary layer will be the main source. he velocity of 31 m/s is a special point of interest due to the occurrence of a structural resonance induced by the fan rotation.
Analyzing the irst phase of noise reductions, regarding the Figs. 7, 8 and 9, it is noticed that for all low speeds the foam treatment was efective on reducing the noise at frequencies from Figure 5. Region with higher fan tip to wall gap before (a)
and after (b) the treatment.
(a) (b)
he baseline wind-tunnel noise spectra, measured in the testing chamber, showed the existence of a very intense tone localized at the frequency of 5 kHz and its multiples. he investigation of the origin of this tone and harmonics showed that they were generated by the motor inverter, and they were related to the motor rotational speed controller. he inverter set-up allows changing its carrier frequency to a limit of 10 kHz. Considering that higher frequencies are better damped by the medium, the highest achievable frequency was adopted as the carrier frequency for the inverter.
WIND-TUNNEL BACKGROUND
NOISE: RESULTS AND DISCUSSION
Typically the main wind-tunnel noise sources are the walls laminar/turbulent boundary layer, corner vanes, fan trailing
S
o
und p
ress
ur
e l
ev
el
(d
b - 1/24 o
cta
ve - R
ef: 20µ
Pa
Frequency (Hz)
70 Baseline
After 1st phase After 2nd phase 65
60
55
50
45
40
35
30
100 1000 10000
300 Hz to 4 kHz. From Figs. 6 to 8, it is seen that the irst phase of noise reduction was efective on absorbing the noise generated by
the fan. For lower low speeds, the noise reduction reached 5 dB, for the frequency of 1 kHz. Opposite to that, when the low speed increases to a higher speed (e.g. 37 m/s), the boundary layer noise becomes a signiicant noise source, and its reduction reaches 2 dB for the same frequency. Finally, it can be noticed that the acoustic treatment was very efective in reducing the fan noise at low low speeds. As a side efect, it can be noticed a noise increase of up to 2 dB at high frequencies and high low velocities.
Observing specially Figs. 8 and 9, it is noticed that the inal noise treatment phase resulted on undesired noise increment at frequencies below 200 Hz. Even thought all noise level increase is undesired, this side-efect was considered acceptable because it will not afect future noise measurement since this frequency is far below the one of interest for future tests.
An important result in Fig. 6 is the vanishing of the peak at 5 kHz ater the second phase of the acoustic treatment. his can be explained by the parameter modiication of the inverter that controls the fan rotation. Since this carrier frequency was moved to 10 kHz, this tone almost disappeared from the spectrum.
It can be concluded that the irst acoustic treatment phase acted mainly at low frequencies while the second one was more efective at high frequencies.
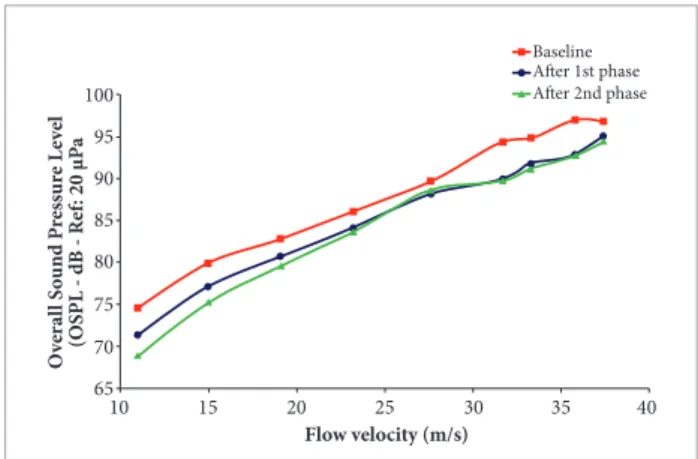
Figure 9 presents the Overall Sound Pressure Level (OSPL) variation as a function of the low speed. From Fig. 9, it is remarkable that the irst phase of noise treatment reduced the OSPL in an average value of 4 dB for all low speeds. Opposed to that, the second acoustic treatment phase reduced the OSPL just for low velocities below 20 m/s, and had no noticeable efect at high low speeds.
THE ACOUSTICS TREATMENT
EFFECT ON THE FLOW
he acoustic treatment efect on the low is veriied by the values of the turbulence intensity and the low velocity. he turbulence was measured with the help of a DANTEC constant temperature hot-wire anemometer system. In this system, a probe model 55P01 was rigidly ixed in the center of the wind-tunnel testing chamber. his probe was calibrated using a DANTEC system described by Bruun (2002).
he hot-wire anemometer data was acquired using a sampling ratio of 6400 Hz during 5 seconds. he measured turbulence raw data was processed with in-house sotware that calculates the turbulence intensity and auto-power-spectra. A parametric study showed that the
S
o
und p
ress
ur
e l
ev
el
(d
b - 1/24 o
cta
ve - R
ef: 20µ
Pa
Frequency (Hz)
80
Baseline After 1st phase After 2nd phase
75
70
65
60
100 1000 10000
85
Figure 7. Wind-tunnel noise spectra measured on the testing chamber for a low velocity of 31 m/s.
S
o
und p
ress
ur
e l
ev
el
(d
b - 1/24 o
cta
ve - R
ef: 20µ
Pa
Frequency (Hz)
85
Baseline After 1st phase After 2nd phase
80
75
70
65
100 1000 10000
90
Figure 8. Wind-tunnel noise spectra measured on the testing chamber for a low velocity of 37 m/s.
O
ve
ra
ll S
o
und P
ress
ur
e L
ev
el
(OS
P
L - dB - R
ef: 20 µ
Pa
Flow velocity (m/s)
85
Baseline After 1st phase After 2nd phase
80
75
70
65
10 20 40
90 95 100
15 25 30 35
calculation of the wind-tunnel turbulence, free of structural vibration and electrical noise inluence, requires the use of a band-pass ilter, which ilters frequencies outside the 3 Hz and 1.000 Hz range.
Figure 10 shows the evolution of the turbulence intensity with the velocity measured in the testing chamber.
Figure 10 shows that the turbulence grows with velocity up to, approximately, 19 m/s, reaching a constant level, for velocities up to 30 m/s, and, consecutively, decays for higher velocities. his behavior is present in all phases of the acoustics treatment. he explanation to this behavior is based on the fact that this wind-tunnel was designed for a 50 m/s low, meaning that, as the velocity increases, the low passes from a laminar/low-turbulence to an “on design” condition, where the constant pitch blade reaches its optimum point. Since, for high velocities, the turbulence eddies, with largest length scales, have their characteristic length reduced, when compared to low velocities, which propitiates a more efective viscous dissipation. As a macro-efect of this, there is a measurable decreasing in the working section turbulence level as shown in Fig. 10.
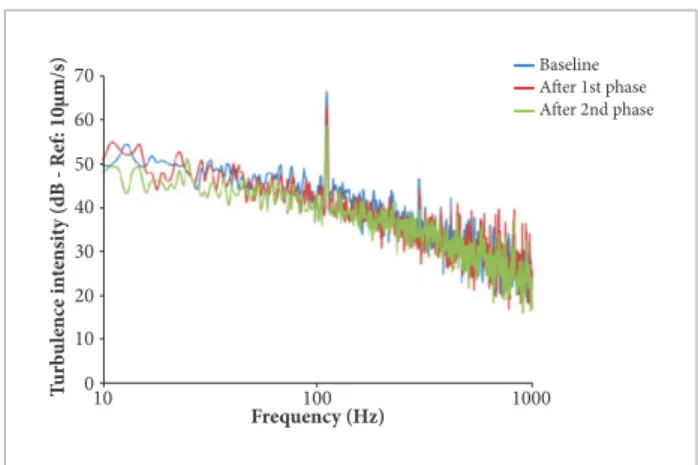
It is desirable, for good quality wind-tunnels, that its turbulence spectrum is free of tones. It is noticed from Figs. 11 and 12 that the acoustic treatment does not introduce any efect on the turbulence spectra.
T
u (%)
Flow Velocity (m/s)
0.25
Baseline After 1st phase After 2nd phase
0.20
0.15
10 20 40
0.30
15 25 30 35
Figure 10. Wind-tunnel turbulence measured on the testing chamber.
A second point, coming from Fig. 10 analysis, is the fact that the acoustic treatment resulted to a positive efect on the wind-tunnel turbulence intensity levels. his is explained by the reduction of the acoustic noise, known as an excitation source on the non-linear instabilities mechanisms that lead the low to turbulence. In addition to this is the fact that, for high Reynolds numbers, the statistics of small eddies is universally and uniquely determined by the viscosity and the rate of energy dissipation, not related to the noise, in such way that the turbulence generation has been decreased but the dissipation rate has been kept constant.
he turbulence spectrum is presented in Figs. 11 and 12.
T
urb
u
le
nc
e in
te
ns
it
y (dB - R
ef: 10µm/s)
Frequency (Hz)
60
Baseline After 1st phase After 2nd phase
50
40
30
0
10 100 1000
70
20
10
Figure 11. Wind-tunnel turbulence spectrum measured after background noise reduction process for a low speed of 20 m/s.
T
urb
u
le
nc
e in
te
ns
it
y (dB - R
ef: 10µm/s)
Frequency (Hz)
60
50
40
30
0
10 100 1000
70
20
10
80 BaselineAfter 1st phase
After 2nd phase
Figure 12. Wind-tunnel turbulence spectrum measured after background noise reduction process for a low speed of 31 m/s.
V
el
o
ci
ty r
ed
u
ct
io
n (%)
Fan rotation (Hz)
After 1st phase After 2nd phase
-1.5
-1.0
10 20 50
-2.0
15 25 30 35 40 45
Figure 13. Wind-tunnel low velocity reduction due the acoustic treatment.
related decrease of the test section velocity. Figure 13 shows the acoustic treatment phases efect on the test section velocity.
Analyzing Fig. 13 results, it is seen that the low velocity reduction was in agreement with the expected within the two phases of noise treatment. he second acoustic treatment phase caused the most important low speed reduction. his fact can, mainly, be attributed to the hydraulic diameter reduction, caused by the bale installation. Considering that the pressure loss is proportional to the inverse of the hydraulic diameter, reducing the hydraulic diameter in 2 times implies on a sectional pressure loss of 8 times. Since section B pressure loss is small,
compared to the rest of the wind-tunnel, a minor efect on the total wind-tunnel velocity reduction is expected.
CONCLUSIONS
The present paper shows the process of background noise reduction for the LAE-1 wind-tunnel. his process was divided into two main phases, where, in a irst phase, the efect acoustic treatment on strategic parts of the wind-tunnel circuit was evaluated. Results showed that this treatment was more efective at frequencies ranging from 400 to 4 kHz. A second phase, complementary to the irst, acted mainly on frequencies above 4 kHz. hese two noise treatment phases resulted on a wind-tunnel background noise reduction of up to 5 dB, and a desirable turbulence level reduction from the original 0.25% to 0.21%, with no addition of tones on the turbulence spectra. he minor drawback of this work was the reduction of 2% in the low speed, considering a constant electric power input.
ACKNOWLEDGEMENTS
he authors acknowledge FAPESP and EMBRAER for the inancial support for this project.
REFERENCES
Brooks, T.F. and Humphreys, W.M., 2006, “A Deconvolution Approach for the Mapping of Acoustics Sources (DAMAS) Determined from Phased Microphone Arrays”, Journal of Sound and Vibration, Vol. 294, pp. 856-879.
Brooks, T.F., Pope, D.S. and Marcolini, M.A., 1989, “Airfoil Self-Noise and Prediction”, NASA Reference Publication 1218.
Bruun, H.H., 2002, “Hot-Wire Anemometry – Principles and Signal Analysis”, 2nd Edition, Oxford Science Publications.
Camargo, H., Remillieux, M., Burdisso, R., Crede, E. and Devenport, W., 2007, “The Virginia Tech Stability Wind Tunnel from an aerodynamic into an aeroacoustic facility”, 19th International Congress on Acoustics, Madrid.
Catalano, F.M., 2001, “The new closed circuit wind tunnel of the aircraft laboratory of University of São Paulo”, 16th Brazilian Congress of Mechanical Engineering, Vol. 6, pp. 306-312.
Dougherty, R.P., 2005, “Extension of DAMAS and beneits and limitations of deconvolution in beamforming”, 11th AIAA/CEAS Aeroacoustics Conference.
Kim M., Lee J., Kee J. and Chang J., 2001, “Hyundai Full Scale Aero-acoustic Wind Tunnel”, SAE Technical Papers, 2001-01-0629.
Künstner R., Potthoff J. and Essers U., 1995, “The Aero-Acoustic Wind Tunnel of Stuttgart University”, SAE Technical Papers, 950625.
Remillieux M.C., Crede E.D., Camargo H.E., Burdisso R.A., Devenport W.J. and Rasnick M., Van Seeters P., Chou A., 2008, “Calibration and Demonstration of the New Virginia Tech Anechoic Wind Tunnel”, 14th AIAA/CEAS Aeroacoustics Conference, AIAA 2008-2911.
Sarradj E., Fritzsche C., Geyer T. and Giesler J., 2009, “Acoustic and aerodynamic design and characterization of a small-scale aeroacoustic wind tunnel”, Applied Acoustics, Vol. 70, pp. 1073–1080.
Shin, H.C., Grahan, W.R., Sijtsma, P., Andreou, C. and Faszer, A.C., 2007, “Implementation of a Phased Microphone Array in a Closed-Section Wind Tunnel”, AIAA Journal, Vol. 45, No. 12.
Sijtsma, P. and Holthusen, H., 1999, “Source Location by Phased Array Measurements in Closed Wind Tunnel Test Sections”, AIAA-99-1814.