AMTD
5, 2131–2167, 2012CH4, CO, and H2O
spectroscopy for TROPOMI
A. Galli et al.
Title Page
Abstract Introduction
Conclusions References
Tables Figures
◭ ◮
◭ ◮
Back Close
Full Screen / Esc
Printer-friendly Version
Interactive Discussion
Discussion
P
a
per
|
Dis
cussion
P
a
per
|
Discussion
P
a
per
|
Discussio
n
P
a
per
|
Atmos. Meas. Tech. Discuss., 5, 2131–2167, 2012 www.atmos-meas-tech-discuss.net/5/2131/2012/ doi:10.5194/amtd-5-2131-2012
© Author(s) 2012. CC Attribution 3.0 License.
Atmospheric Measurement Techniques Discussions
This discussion paper is/has been under review for the journal Atmospheric Measurement Techniques (AMT). Please refer to the corresponding final paper in AMT if available.
CH
4
, CO, and H
2
O spectroscopy for the
Sentinel-5 Precursor mission: an
assessment with the Total Carbon Column
Observing Network measurements
A. Galli1, A. Butz2, R. A. Scheepmaker1, O. Hasekamp1, J. Landgraf1, P. Tol1, D. Wunch3, N. M. Deutscher4,5, G. C. Toon6, P. O. Wennberg3, D. W. T. Griffith4, and I. Aben1
1
Netherlands Institute for Space Research (SRON), 3584 CA Utrecht, The Netherlands
2
Karlsruhe Institute of Technology, Institute for Meteorology and Climate Research, 76344 Leopoldshafen, Germany
3
Department of Earth Science and Engineering, California Institute of Technology, Pasadena, CA 91125, USA
4
Centre for Atmospheric Chemistry, University of Wollongong, Wollongong, NSW 2522, Australia
5
Institute for Environmental Physics, University of Bremen, 28334 Bremen, Germany
6
AMTD
5, 2131–2167, 2012CH4, CO, and H2O
spectroscopy for TROPOMI
A. Galli et al.
Title Page
Abstract Introduction
Conclusions References
Tables Figures
◭ ◮
◭ ◮
Back Close
Full Screen / Esc
Printer-friendly Version
Interactive Discussion
Discussion
P
a
per
|
Dis
cussion
P
a
per
|
Discussion
P
a
per
|
Discussio
n
P
a
per
|
Correspondence to: A. Galli ([email protected])
AMTD
5, 2131–2167, 2012CH4, CO, and H2O
spectroscopy for TROPOMI
A. Galli et al.
Title Page
Abstract Introduction
Conclusions References
Tables Figures
◭ ◮
◭ ◮
Back Close
Full Screen / Esc
Printer-friendly Version
Interactive Discussion
Discussion
P
a
per
|
Dis
cussion
P
a
per
|
Discussion
P
a
per
|
Discussio
n
P
a
per
|
Abstract
The TROPOspheric Monitoring Instrument (TROPOMI) will be part of ESA’s Sentinel-5 Precursor (S5P) satellite platform scheduled for launch in 2015. TROPOMI will monitor methane and carbon monoxide concentrations in the Earth’s atmosphere by measuring spectra of back-scattered sunlight in the short-wave infrared (SWIR).
5
S5P will be the first satellite mission to rely uniquely on the spectral window at 4190– 4340 cm−1 (2.3 µm) to retrieve CH4 and CO. In this study, we investigated if the ab-sorption features of the three relevant molecules CH4, CO, and H2O are adequately
known. To this end, we retrieved total columns of CH4, CO, and H2O from absorption
spectra measured by two ground-based Fourier transform spectrometers that are part 10
of the Total Carbon Column Observing Network (TCCON). The retrieval results from the 4190–4340 cm−1 range at the TROPOMI resolution (0.45 cm−1) were then compared to the CH4 results obtained from the 6000 cm−
1
region, and the CO results obtained from the 4190–4340 cm−1region at the higher TCCON resolution (0.02 cm−1).
For TROPOMI-like settings, we were able to reproduce the CH4columns to an ac-15
curacy of 0.3 % apart from a constant bias of 1 %. The CO retrieval accuracy was, through interference, systematically influenced by the shortcomings of the CH4 and H2O spectroscopy. In contrast to CH4, the CO column error also varied significantly
with atmospheric H2O content. Unaddressed, this would introduce seasonal and
latitu-dinal biases to the CO columns retrieved from TROPOMI measurements. We therefore 20
recommend further effort from the spectroscopic community to be directed at the H2O
and CH4spectroscopy in the 4190–4340 cm− 1
region.
1 Introduction
Methane (CH4) and carbon monoxide (CO) have a large impact on climate variability
and air quality. Accurate monitoring with high spatial and temporal coverage allows the 25
AMTD
5, 2131–2167, 2012CH4, CO, and H2O
spectroscopy for TROPOMI
A. Galli et al.
Title Page
Abstract Introduction
Conclusions References
Tables Figures
◭ ◮
◭ ◮
Back Close
Full Screen / Esc
Printer-friendly Version
Interactive Discussion
Discussion
P
a
per
|
Dis
cussion
P
a
per
|
Discussion
P
a
per
|
Discussio
n
P
a
per
|
and land-atmosphere interactions (bush-fires, regional CH4emissions of wetlands and livestock etc.). Both ground-based observations and satellite observations are currently used to monitor CH4and CO.
The Total Carbon Column Observing Network (TCCON) is a global network of ground-based Fourier transform spectrometers, established in 2004 (Wunch et al., 5
2011a). Its goal is to remotely measure column abundances of CO2, CO, CH4, N2O
and other molecules that absorb in the near-infrared and short-wave infrared (SWIR). Currently, there are 18 operational observation sites affiliated with TCCON. TCCON measurements are used to validate satellite measurements (Butz et al., 2011; Morino et al., 2011; Parker et al., 2011; Wunch et al., 2011b; Reuter et al., 2011), and they also 10
provide direct constraints on global greenhouse gas inventories (e.g., Yang et al., 2007; Fraser et al., 2011). Thanks to their high spectral resolution (0.02 cm−1), the measured spectra can also be used to evaluate spectroscopic databases (e.g., Tran et al., 2010). ESA’s Sentinel-5 Precursor (S5P) satellite – due for launch early 2015 – will comple-ment a series of satellites that monitor CH4and CO concentrations in the Earth’s atmo-15
sphere. Its payload, the TROPOspheric Monitoring Instrument (TROPOMI) (Veefkind et al., 2012), is an imaging spectrometer that will measure back-scattered solar radi-ation spectra in the nadir and off-nadir directions. TROPOMI will feature a wide swath of 2600 km with a ground pixel area of 7×7 km2(for the sub-satellite point), which im-plies daily global coverage of the Earth’s surface with∼7×10⁶measured spectra. The 20
spectrometer will measure the SWIR range at 4190–4340 cm−1with moderate spectral resolution (0.45 cm−1). This range covers strong absorption lines by CH4 and water
vapour (H2O) as well as weak absorption by CO and deuterated water (HDO).
During one decade of operations, the SCanning Imaging Absorption spectroMeter for Atmospheric CartograpHY (SCIAMACHY) (Bovensmann et al., 1999) has demon-25
strated that this type of satellite observations allows for the retrieval of total atmospheric columns of CH4 (e.g., Frankenberg et al., 2006; Bergamaschi et al., 2009) and CO
con-AMTD
5, 2131–2167, 2012CH4, CO, and H2O
spectroscopy for TROPOMI
A. Galli et al.
Title Page
Abstract Introduction
Conclusions References
Tables Figures
◭ ◮
◭ ◮
Back Close
Full Screen / Esc
Printer-friendly Version
Interactive Discussion
Discussion
P
a
per
|
Dis
cussion
P
a
per
|
Discussion
P
a
per
|
Discussio
n
P
a
per
|
centration measurements as well, which are currently subject to validation (Butz et al., 2011; Morino et al., 2011; Wunch et al., 2010; Parker et al., 2011). Another satellite observation set of tropospheric CO is provided by the Measurements Of Pollution In The Troposphere (MOPITT) instrument, active since the year 2000. CO total columns both from the SWIR and from the thermal-infrared near 2100 cm−1are retrieved from 5
the MOPITT data (Deeter et al., 2009). In the coming years, S5P will fill the gap be-tween the currently orbiting satellites and later missions such as Sentinel-5. A common goal of these missions is to monitor atmospheric CH4 concentrations with the accu-racy and spatio-temporal coverage that enable inverse modelling of CH4 sources on
regional and weekly scales. S5P will also provide users with a CO product at high spa-10
tial and temporal sampling, a single measurement having an uncertainty of 10 % at most. In contrast, SCIAMACHY data have to be averaged in time (roughly one month) and space (∼5◦×5◦) to reach a comparable accuracy.
The absorption lines of CH4and CO in the SWIR can be used to infer the total atmo-spheric concentration with high sensitivity to the Earth’s surface and lower atmosphere 15
where sources are located. The main challenge for the inversion technique is the de-sired accuracy: for CH4, residual retrieval biases as small as a few per mill could be detrimental to inverse modelling of sources and sinks (Bergamaschi et al., 2009). The scientific objective for CO – an overall accuracy of better than 15 % (Vidot et al., 2012) – seems less demanding, but the CO absorption lines are hard to detect among the 20
strong absorption lines of CH4 and H2O. The retrieval accuracy depends on accurate
knowledge of the light path of the back-scattered sunlight through the Earth’s atmo-sphere. Scattering by particles such as aerosols, water and cirrus clouds can modify the light path and induce retrieval errors. The two studies published recently by Butz et al. (2012) and Vidot et al. (2012) focused on this error source and – using synthetic 25
AMTD
5, 2131–2167, 2012CH4, CO, and H2O
spectroscopy for TROPOMI
A. Galli et al.
Title Page
Abstract Introduction
Conclusions References
Tables Figures
◭ ◮
◭ ◮
Back Close
Full Screen / Esc
Printer-friendly Version
Interactive Discussion
Discussion
P
a
per
|
Dis
cussion
P
a
per
|
Discussion
P
a
per
|
Discussio
n
P
a
per
|
molecular absorption lines of CH4, CO, and H2O. This error source is the topic of this study.
To assess these errors, we will retrieve CH4 and CO columns from the spectra of
ground-based Fourier transform spectrometers at two different locations, both at their native high resolution (0.02 cm−1) and convolved with the TROPOMI instrument re-5
sponse function to produce lower-resolution spectra (0.45 cm−1). The results of the retrievals in the 4190–4340 cm−1range will then be compared to the reference values obtained from 5880–6174 cm−1 (for CH4), and from 4209–4313 cm
−1
(for CO) at the native resolution. The paper is structured in the following way: In Sect. 2, we will char-acterise the measurements and the inversion method to evaluate them. The results 10
and their implications for the spectroscopic databases of CH4, H2O, and CO will be presented in Sect. 3. Section 4 will conclude the paper with recommendations for the S5P mission.
2 Methodology
In this section, we present the TCCON observations and the different spectral ranges 15
used for this study (Sect. 2.1), before explaining our forward model (Sect. 2.2) and the inversion method (Sect. 2.3). After verification of our inverse method (in Sect. 2.4) the approach to analyse the results is described in Sect. 2.5.
2.1 TCCON observations
We chose two sets of TCCON observations to cover both wet and dry atmospheric 20
AMTD
5, 2131–2167, 2012CH4, CO, and H2O
spectroscopy for TROPOMI
A. Galli et al.
Title Page
Abstract Introduction
Conclusions References
Tables Figures
◭ ◮
◭ ◮
Back Close
Full Screen / Esc
Printer-friendly Version
Interactive Discussion
Discussion
P
a
per
|
Dis
cussion
P
a
per
|
Discussion
P
a
per
|
Discussio
n
P
a
per
|
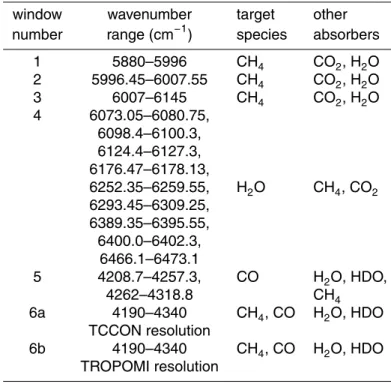
data cover a large range of solar zenith angles (SZA) between 20 and 80 degrees. The Darwin spectra have a narrower spread in observation geometry (35<SZA<45 de-grees for 48 of 50 spectra). For evaluation, we split the spectra into the ranges listed in Table 1 and, whenever TROPOMI spectra were to be simulated, convolved them with the expected TROPOMI instrument response function (Sect. 2.2).
5
Table 1 summarises all spectral windows referred to in this study. The windows used by the TCCON science team are: windows 1, 2, and 3 for CH4, the windows labelled 4 for H2O, and the windows labelled 5 for CO. Windows 6a and 6b cover the expected
spectral range for TROPOMI. The original resolution corresponds to a full width half maximum (FWHM) of 0.0134 cm−1 (window 6a), and the TROPOMI resolution has a 10
FWHM of 0.45 cm−1(window 6b).
2.2 Forward model
In contrast to the more elaborate forward model required to invert back-scattered sun-light spectra (Hasekamp and Butz, 2008), the forward model in this study neglects scattering processes. The TCCON spectrometers measure direct sun-light, which is, 15
to a good approximation, only affected by molecular absorption on its way through the atmosphere. The modelled signal F(k) can be written as an integral over the entire heighthof the atmosphere.
F(k)=R ⊗ S⊙g exp
− ∞ Z
0
dh n(h)σ(p,T,k)f(µ0)
(1)
S⊙ denotes the solar radiance, for which we adopted the solar line list used by the 20
TCCON science team (G. C. Toon, private communication, 2010). The other terms in Eq. (1) are the instrument gain g, the wavenumber of the spectrum k, the molecu-lar cross-sectionsσ(p,T,k), the particle density of the considered absorber molecules
AMTD
5, 2131–2167, 2012CH4, CO, and H2O
spectroscopy for TROPOMI
A. Galli et al.
Title Page
Abstract Introduction
Conclusions References
Tables Figures
◭ ◮
◭ ◮
Back Close
Full Screen / Esc
Printer-friendly Version
Interactive Discussion
Discussion
P
a
per
|
Dis
cussion
P
a
per
|
Discussion
P
a
per
|
Discussio
n
P
a
per
|
integrating over height and atmospheric constituents, one needs to convolve the mod-elled absorption spectrum with the instrument response functionRbefore comparing it to the measurements. To reproduce the TCCON retrieval values, we assumed the instrument line shape to be a sinc function convolved with a rectangular function, with 0.02 cm−1 between the first zero-crossings (corresponding to FWHM =0.0134 cm−1) 5
and an oversampling rate of 1.9×FWHM. To simulate TROPOMI-like spectra, we con-volved the TCCON spectra with a Gaussian instrument line shape with a coarser FWHM of 0.45 cm−1 and an oversampling rate of 2.5×FWHM. Figure 1 shows the two spectral resolutions in the SWIR window between 4190 and 4340 cm−1.
The HITRAN 2008 molecular spectroscopic database (HITRAN08, Rothman et al., 10
2009) served as our default cross-section database, with the exception of the H2O line lists. For H2O in windows 1 to 4, we combined the line list by Jenouvrier et al. (2007)
with HITRAN08 by selecting for each absorption line the version that produced the smaller spectral fit residuals. For the TROPOMI range at 4190–4340 cm−1, we used the line list developed by Scheepmaker et al. (2012). These line lists are not identical 15
to the H2O spectroscopy used by the TCCON science team. The latter improved the
fit quality in spectral window 1, whereas it led to larger fit residuals in the TROPOMI range. To keep the paper short, we will only present retrievals obtained with the H2O
line lists developed for this study. The CH4, CO, and CO2line lists used by the TCCON
science team are the HITRAN08 line lists that were also used for this study. Figure 2 20
shows the relative strength of the CH4, H2O, and CO absorption features in the range of 4190–4340 cm−1. The cross-sections were evaluated at p=1000 mbar,T =296 K and multiplied with columns Ni representative for observations at Darwin to obtain approximate optical depths (Eq. 1).
2.3 Inverse method
25
el-AMTD
5, 2131–2167, 2012CH4, CO, and H2O
spectroscopy for TROPOMI
A. Galli et al.
Title Page
Abstract Introduction
Conclusions References
Tables Figures
◭ ◮
◭ ◮
Back Close
Full Screen / Esc
Printer-friendly Version
Interactive Discussion
Discussion
P
a
per
|
Dis
cussion
P
a
per
|
Discussion
P
a
per
|
Discussio
n
P
a
per
|
ements: total column number densityNi =P
ni(h) for CO and H2O, a profile for CH4,
three parameters to fit a wavenumber dependent instrumental gaing, and two auxiliary parameters to compensate for a spectral shift of the measured spectrum with respect to the tabulated cross-sections. By default, pressure, temperature, and the height profiles of the absorbing species were not retrieved in the state vector. We assumed a fixed 5
a priori atmospheric profile for CH4, H2O, and CO, and fitted only a scalar correction factor to the initialNi. The exception to this rule was CH4. The spectral fit residuals
de-creased by 10 %, when the CH4column was retrieved as a 12-layer height profile. The
state vector thus contained twelve instead of one entry for CH4. They were summed up in the end to yield a total CH4column. As for all other species, the degrees of freedom 10
of the inversion were insufficient to retrieve a meaningful profile.
To retrievex, regularisation is required because the inverse problem is ill-posed i.e. the measurements y contain insufficient information to retrieve all state vector elements independently. The Phillips-Tikhonov regularisation method (Phillips, 1962; Tikhonov, 1963) finds the optimised state vectorxˆ by minimising a cost function that is the sum 15
of the least-squares cost function and a side constraint weighted by the regularisation parameterγ ≥0 according to
ˆ
x=arg min
x (kSy
−1/2
F(x)−yk2+γkWxk2). (2)
Wis the weighting matrix, and Sy is the diagonal measurement error covariance ma-trix containing the noise estimate. ForSy we assumed a signal-to-noise ratio of 1000 20
(Wunch et al., 2011a).
The set-up of the atmospheric input was not changed with respect to Butz et al. (2012): the atmosphere was divided into a grid of 72 planar atmospheric layers (equidistant steps in terms of pressure). By default, temperature, pressure, and height were kept constant. The initial values for pressure, temperature and the H2O profile 25
AMTD
5, 2131–2167, 2012CH4, CO, and H2O
spectroscopy for TROPOMI
A. Galli et al.
Title Page
Abstract Introduction
Conclusions References
Tables Figures
◭ ◮
◭ ◮
Back Close
Full Screen / Esc
Printer-friendly Version
Interactive Discussion
Discussion
P
a
per
|
Dis
cussion
P
a
per
|
Discussion
P
a
per
|
Discussio
n
P
a
per
|
We checked that the surface pressure agreed within 0.1 % to the pressure measured at the TCCON stations. For the CH4and CO a priori profiles, we relied on the Chemistry Transport Model (TM4) profiles (Meirink et al., 2006). The priors were obtained from a one-year average at the corresponding geolocation of the observation sites.
2.4 Reference retrievals 5
Throughout this paper we used the atmospheric total columns Ni (in molecules
cm−2) obtained from the spectral ranges 5880–6174 cm−1 (for CH4) and from 4209–
4319 cm−1 (for CO) as reference values. These spectral ranges are also used by the TCCON science team as input for their retrieval algorithm GFIT (Wunch et al., 2011a). Dedicated effort in the past years to improve CH4and H2O spectroscopy in the 5880– 10
6174 cm−1range (Frankenberg et al., 2008; Tran et al., 2010; Jenouvrier et al., 2007) has enabled accurate retrieval of CH4columns from this spectral range. This has been
confirmed by validation of GFIT retrievals with independent aircraft measurements. Similarly, the accuracy of retrieved CO columns from the 4209–4319 cm−1 spectral range by GFIT has also been confirmed by validation with aircraft measurements. 15
Our inversion algorithm being not identical to GFIT, we first verified our algorithm. We checked if it reproduces the CH4 and CO total columns derived with GFIT when
the same spectral ranges and spectral resolution were used (see Table 1). A com-plication arose when inter-comparison of our CH4 results from windows 1, 2, and 3 showed that the retrieval quality from window 1 (5880–5996 cm−1) was unsatisfying. 20
A closer inspection revealed that there were several strong H2O absorption lines not
well captured by our line list. We therefore decided to discard window 1 altogether and reproduce the GFIT values for CH4 from the average of windows 2 and 3. For all ob-servation windows, the spectrum measured at Park Falls on 21 June 2005, turned out to produce much larger spectral fit residuals than the average. The GFIT retrieval also 25
AMTD
5, 2131–2167, 2012CH4, CO, and H2O
spectroscopy for TROPOMI
A. Galli et al.
Title Page
Abstract Introduction
Conclusions References
Tables Figures
◭ ◮
◭ ◮
Back Close
Full Screen / Esc
Printer-friendly Version
Interactive Discussion
Discussion
P
a
per
|
Dis
cussion
P
a
per
|
Discussion
P
a
per
|
Discussio
n
P
a
per
|
Comparing our retrieved CH4 values from windows 2 and 3 to the GFIT values, we found a bias between the two datasets of 0.1 % for both Parkfalls and Darwin and standard deviations of 0.26 % and 0.18 % for Park Falls and Darwin, respectively. For CO, we found biases of 1.6 % and−2.8 %, and standard deviations of 1.1 % and 1.8 % for Park Falls and Darwin, respectively. The small differences between our algorithm 5
and GFIT may be explained by differences in averaging kernels and a priori profiles for CH4, CO, and H2O (smoothing and interference errors), and differences in the H2O line list. These differences are consistent with the error bars provided by the GFIT algorithm. Therefore, we considered our retrieved columns from the 5990–6174 cm−1 range (for CH4) and from 4209–4319 cm−1range (for CO) as reference values and the 10
standard deviations given above as the associated errorσref.
2.5 Analysis of the results
To discuss the retrieval accuracy, we used the following three diagnostic quantities throughout this study. They quantify by how much the quality of the retrieved columns decreased when CH4, CO, and H2O columns were retrieved from 4190–4340 cm
−1
at 15
the TROPOMI resolution compared to the reference results (spectral ranges listed in Table 1). For the standard deviation and the bias, we interpreted the columns of CH4, CO, and H2O retrieved at Park Falls or Darwin as a time-series and compared it to the time-series of the reference values:
1. The reducedχ2of the fit: the sum of the residuals between the modelled spectra 20
and the corresponding measured spectra, divided by the degrees of freedom ν
AMTD
5, 2131–2167, 2012CH4, CO, and H2O
spectroscopy for TROPOMI
A. Galli et al.
Title Page
Abstract Introduction
Conclusions References
Tables Figures
◭ ◮
◭ ◮
Back Close
Full Screen / Esc
Printer-friendly Version
Interactive Discussion
Discussion
P
a
per
|
Dis
cussion
P
a
per
|
Discussion
P
a
per
|
Discussio
n
P
a
per
|
χ2/ν=
K
X
k=1
y
meas,k−ymod,k σk
2
/ν (3)
In the results section, we will list the averagehχ2/νiover all spectra.
2. The σN standard deviation of the differences between the retrieved columns at TROPOMI-like settings and the reference values. This number serves as an es-timate of the accuracy of our results including systematic errors. In the tables, 5
we will always compare it to the errorσref of the reference retrievals. If σN is not
much larger thanσref, the differences between the two retrievals are statistically
insignificant.
3. The biasbof the new retrieval values with respect to the reference values, calcu-lated from the median of the relative differences.
10
3 Results
In this section, we compare the inversion results (CH4in Sect. 3.1, CO in Sect. 3.2) for
the TROPOMI spectral range to the reference retrievals. An option to improve the CO retrieval accuracy is presented in Sect. 3.3.
3.1 CH4retrieval accuracy 15
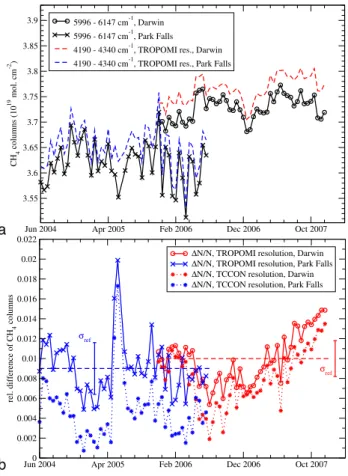
Figure 3 shows the time-series of CH4 columns (upper panel) and the differences
(lower panel) between the results from the TROPOMI range and the 5996–6147 cm−1 range. The Darwin observations are coloured red, the Park Falls observations are shown in blue. In the lower panel, solid lines belong to retrievals at TROPOMI reso-lution (window 6b in Table 1), dotted lines denote results from the original resoreso-lution 20
AMTD
5, 2131–2167, 2012CH4, CO, and H2O
spectroscopy for TROPOMI
A. Galli et al.
Title Page
Abstract Introduction
Conclusions References
Tables Figures
◭ ◮
◭ ◮
Back Close
Full Screen / Esc
Printer-friendly Version
Interactive Discussion
Discussion
P
a
per
|
Dis
cussion
P
a
per
|
Discussion
P
a
per
|
Discussio
n
P
a
per
|
diagnostics. Those are, from left to right: average spectral fit residuals (hχ2/νi), stan-dard deviation of the differences in columns (σN) versus the reference error σref (see
Sect. 2.4), and the biasb. Table 2 shows that the CH4 columns were well reproduced for TROPOMI-like settings. The average scatter of retrieved columns increased only from 0.18 to 0.24 % at Darwin, and from 0.26 to 0.28 % at Park Falls. These numbers 5
did not change significantly when the original spectral resolution was assumed. The difference between the values derived from TROPOMI-like settings and the reference values from spectral windows 2 and 3 was not significant except for the two outliers in summer 2005 at Park Falls (Fig. 3). The error bars assigned to these values by the GFIT algorithm are also three times larger than the average value. The positive bias 10
of roughly 1 % at both sites thus is the only evidence for spectroscopy-related errors affecting the CH4columns. This bias increased for the lower spectral resolution, which is consistent with interference errors due to inaccurate CH4 or H2O spectroscopy. The
spectral fit residuals increased from ∼30 at the 6000 cm−1 range to ∼100, but they cannot be directly related to a column error.
15
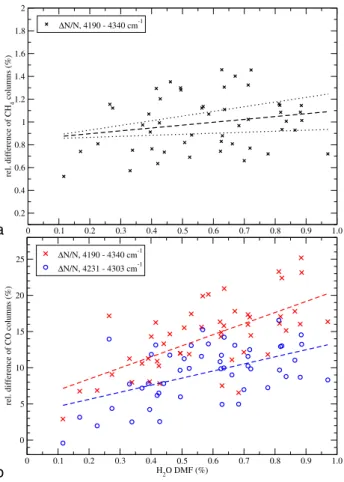
To see if H2O interference errors could account for the 1 % bias, we investigated the
dependence of the CH4retrieval errors on the H2O abundance. Figure 7, upper panel,
shows CH4 retrieval errors against H2O Dry air Mole Fraction (DMF) at Darwin. The dashed line is the linear regression, the dotted lines show the 1-σ uncertainty level of the slope. The air-mass was between 1.2 and 1.4 for all observations. The slope is not 20
significantly larger than zero at a 2-σ level and it increases only from 0.9 to 1.1 % for the range of observed H2O DMF. This may be enough to account for the increase of the bias for the lower spectral resolution, but both effects are on the order of the reference retrieval accuracy.
Since there are no plans to retrieve O2from TROPOMI spectra, pressure was treated 25
as a fixed parameter in the inversion method up to this point. The TCCON spectra cover several strong O2 absorption regions and can thus also be used to derive total O2
AMTD
5, 2131–2167, 2012CH4, CO, and H2O
spectroscopy for TROPOMI
A. Galli et al.
Title Page
Abstract Introduction
Conclusions References
Tables Figures
◭ ◮
◭ ◮
Back Close
Full Screen / Esc
Printer-friendly Version
Interactive Discussion
Discussion
P
a
per
|
Dis
cussion
P
a
per
|
Discussion
P
a
per
|
Discussio
n
P
a
per
|
approach to avoid an assessment of O2 spectroscopy. Instead of retrieving pressure and trace gas species separately, our inversion algorithm also allows for a simultaneous retrieval. For such a retrieval, the observation windows need not include O2absorption
lines, since the line shape of any absorber depends on pressure. At each iteration step, then, the total dry air column is optimised with respect to the cross-sections of all 5
retrieved molecules.
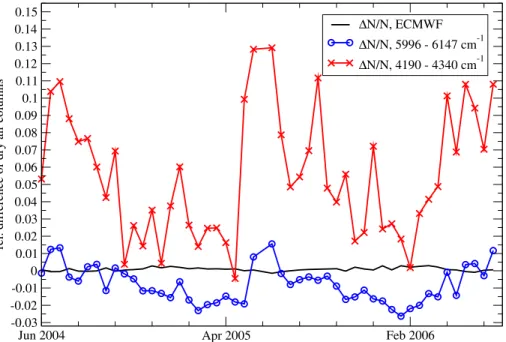
When we retrieved the pressure from the CH4 and H2O absorption features in the 5996–6145 cm−1range, the pressure retrieval yielded dry air columns that agreed with the in-situ measurements within 2 %. The same approach resulted in errors larger than 10 % when we chose the 4190–4340 cm−1range. The difference in retrieved CH4 10
columns were smaller (0.3 to 0.8 %), but still significant. Figure 4 shows the relative differences of retrieved dry air columns versus the value measured at the Park Falls site. Results from windows 2 and 3 (circles) are compared to the column errors from the TROPOMI spectral range (crosses). The dry air columns derived from the ECMWF pressure profile, which serve as our default, agree with the measured dry air columns 15
within 0.1 % standard deviation (black curve in Fig. 4).
The failure to retrieve the pressure from the SWIR band was probably caused by inaccurate pressure-broadening parameters of the CH4 and H2O line lists. As long
as the pressure was kept fixed, these shortcomings manifested themselves primarily in the spectral fit residuals (see Fig. 8). If, however, the pressure was treated as a 20
free parameter, the inversion routine optimised for a pressure which compensated for inaccurately predicted absorption line shapes. This resulted in pressure values as far as 10 % away from the true pressure (see Fig. 4). CH4 and H2O were found to yield a comparable pressure over-estimation when only one of them was retrieved. The only region exempt from these problems was the 4318–4328 cm−1region where strong CH4 25
AMTD
5, 2131–2167, 2012CH4, CO, and H2O
spectroscopy for TROPOMI
A. Galli et al.
Title Page
Abstract Introduction
Conclusions References
Tables Figures
◭ ◮
◭ ◮
Back Close
Full Screen / Esc
Printer-friendly Version
Interactive Discussion
Discussion
P
a
per
|
Dis
cussion
P
a
per
|
Discussion
P
a
per
|
Discussio
n
P
a
per
|
We also inverted 45 spectra from one single observation day at Park Falls to check for air-mass dependent errors. Up to SZA≈ 65 degrees, no systematic influence of air-mass was found for CH4, nor for CO columns. For larger SZA, the discrepancies
caused by different averaging kernels increased to the extent at which they masked any potential spectroscopy-related errors.
5
3.2 CO retrieval accuracy
In contrast to CH4 and H2O, the CO absorption maxima are relatively sharp and well
separated from each other. Nonetheless, inversion of CO in the SWIR is non-trivial because the CO signature has to be separated from the much stronger background of CH4 and H2O absorption. If possible, we would like to retrieve all three species at the 10
same time, using the entire spectral range of 4190–4340 cm−1. This approach worked reasonably well for CH4.
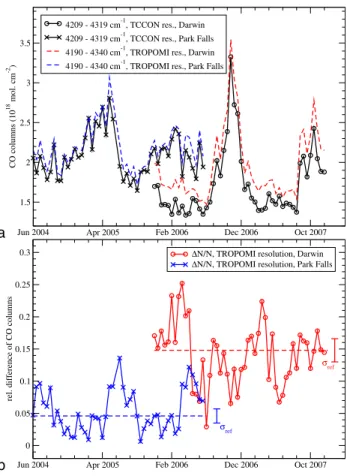
Figure 5 shows the time-series of retrieved CO (upper panel) and the relative diff er-ences of CO columns retrieved at the TROPOMI resolution compared to window 5 at the original resolution (lower panel). The two biases were added as dashed lines in the 15
lower panel. Table 3 lists the corresponding fit diagnostics. The CO retrieval accuracy obviously deteriorated for TROPOMI-like settings. First, the bias b increased from a few to roughly ten percent. Second, the standard deviation of the retrieved CO column error,σN, increased by a factor of two to three compared to the reference uncertainty.
The increase of bias and standard deviation was more pronounced at Darwin than at 20
Park Falls. An explanation might be that the average H2O abundance at Darwin was two times higher. We will examine this conjecture in the following. The impact of CH4
spectroscopic errors on CO are hard to identify because the atmospheric CH4
abun-dance varies little compared to H2O.
We fitted H2O and HDO as interfering absorbers while retrieving the CH4 and CO 25
columns. Figure 6 compares the H2O columns retrieved from the TROPOMI range to
AMTD
5, 2131–2167, 2012CH4, CO, and H2O
spectroscopy for TROPOMI
A. Galli et al.
Title Page
Abstract Introduction
Conclusions References
Tables Figures
◭ ◮
◭ ◮
Back Close
Full Screen / Esc
Printer-friendly Version
Interactive Discussion
Discussion
P
a
per
|
Dis
cussion
P
a
per
|
Discussion
P
a
per
|
Discussio
n
P
a
per
|
time-series; the lower panel shows the relative differences to the reference results from window 4 (same format as Fig. 3 for CH4). Table 4 lists the corresponding fit diagnos-tics of H2O, including results from the original (TCCON) and the lower (TROPOMI)
resolution. As for CH4, the H2O retrieval accuracy did not deteriorate when the input
spectrum was degraded to the TROPOMI resolution; σN in Table 4 remained almost
5
identical. The bias of 6 or 8 % at Darwin was the only obvious difference between the H2O derived from the TROPOMI range and from window 4. To prove that the CO
re-trieval errors, in particular at Darwin, were dominated by H2O interference errors, we needed more evidence.
We first replaced our default line list for H2O with the HITRAN08 line list to test 10
how sensitively the CO retrieval results reacted to the H2O spectroscopy. The spectral fit residuals increased by a factor of 2.2 and the H2O columns were equally biased,
whereas the bias of the CO columns changed from 14.8 to 6.7 % at Darwin, and from 4.6 to 1.1 % at Park Falls. On the other hand, the standard deviation of column errors did not decrease significantly.
15
The CO bias would be of little consequence for the S5P mission if it were constant for all observation sites and atmospheric conditions. A further examination revealed, however, that it strongly depended on the H2O vapour content. The correlation strength
did not change when the default H2O line list was replaced by the HITRAN08 list. This
dependence would introduce undesired seasonal and latitudinal biases for the S5P 20
mission. Figure 7 demonstrates for the Darwin observations the extent to which the CO and CH4retrieval errors increased with H2O abundance. In the lower panel, the CO
retrieval errors for the nominal TROPOMI range and for an optimised sub-window (see Sect. 3.3 for further explanation) are plotted against H2O DMF. The dashed lines show
the linear fits. Judging from the linear fit, the H2O-dependence introduced a CO-bias 25
of 15 % between the driest and the most humid day. In contrast to the weak correlation for CH4, CO error increase with H2O is much larger than the reference accuracy.
AMTD
5, 2131–2167, 2012CH4, CO, and H2O
spectroscopy for TROPOMI
A. Galli et al.
Title Page
Abstract Introduction
Conclusions References
Tables Figures
◭ ◮
◭ ◮
Back Close
Full Screen / Esc
Printer-friendly Version
Interactive Discussion
Discussion
P
a
per
|
Dis
cussion
P
a
per
|
Discussion
P
a
per
|
Discussio
n
P
a
per
|
lines but do not directly relate to a column inversion error. We correlated the spectral fit residuals to the molecular absorption spectra by calculating Spearman’s rank-order correlation coefficient (Press et al., 1986). The correlation with the H2O absorption
spectrum was significant (significance>10σ) for all measurements. The actual corre-lation strength increased with atmospheric H2O abundance. For dry atmospheric condi-5
tions (H2O DMF<0.1 %), the correlation with the CH4absorption lines dominated over
the H2O correlation, whereas it became non-significant for wet atmospheric conditions.
Figure 8, upper panel, shows a part of the fit residuals for an observation at Darwin with H2O DMF=1 %. The cross-sections of H2O and CH4, evaluated atp=1000 mbar and T =296 K, are shown as blue and black lines. The residuals peak to the immediate left 10
and right of the absorption maxima of H2O, whereas the line centres seem to be cor-rect. Inadequate pressure broadening parameters of the strong H2O absorption lines
are an obvious interpretation for this deficiency (see the results on pressure retrievals in Sect. 3.1), but other effects, such as line mixing, probably also contributed to the residuals. There were also fit residuals peaking around CH4absorption lines (the lower 15
panel in Fig. 8 shows a Park Falls spectrum for a dry Winter day) but these fit residuals were much more variable in shape and size than their H2O counterparts.
For the CO retrievals, the 15 % threshold accuracy (Vidot et al., 2012) was met for all 100 examined spectra, but this would be the full error budget for the S5P mission. Moreover, the retrieval errors varied systematically with H2O and additional errors due 20
to scattering processes of aerosols and clouds are to be expected for a TROPOMI observation geometry. An improvement of the CO retrieval accuracy is therefore nec-essary.
3.3 Measures to improve on CO retrieval accuracy
The performance of the CO inversion at TROPOMI resolution is limited by the strong 25
overlapping of the CO with neighbouring CH4and H2O lines, both of which have
sys-tematic errors (Fig. 8). Sussmann and Borsdorff (2007) reported that the H2O
AMTD
5, 2131–2167, 2012CH4, CO, and H2O
spectroscopy for TROPOMI
A. Galli et al.
Title Page
Abstract Introduction
Conclusions References
Tables Figures
◭ ◮
◭ ◮
Back Close
Full Screen / Esc
Printer-friendly Version
Interactive Discussion
Discussion
P
a
per
|
Dis
cussion
P
a
per
|
Discussion
P
a
per
|
Discussio
n
P
a
per
|
H2O profile instead of a scalar value. We experimented with a similar approach for the TROPOMI range, but we did not achieve a notable decrease in CO column error. One reason might be that we relied on an H2O prior profile already close to the optimum
profile.
Another means to reduce interference errors is to restrict the retrieval to a sub-5
window where the CO absorption lines are more pronounced relative to the CH4 and
H2O lines. The main drawback of this approach is the loss of information, making the inversion potentially more vulnerable to instrumental effects. For the inversion of back-scattered sunlight, we also have to keep in mind that those parts of the spectrum without CO absorption lines may be needed to retrieve information on scattering parti-10
cles (Vidot et al., 2012). We defined an overlapping functionωin terms of the spectral sensitivity∂F/∂N as
ω=
| ∂F
∂NH2O|+| ∂F ∂NCH4|
| ∂F
∂NCO|
. (4)
From Eq. (4) we optimised the CO sub-window by choosing wavenumber limitsk0,k1
such that Pk1
k=k0 k1−k0
ω(k) became maximal. This criterion led to an optimised range of 15
4231.3–4302.6 cm−1 if one contiguous spectral range was to be used. Replacing the nominal TROPOMI range by this sub-window reduced the dependency of the CO re-trieval errors with humidity. This is illustrated in Fig. 7, where the rere-trieval results from the CO sub-window (circles) are compared to the nominal retrieval results (crosses). The bias of the CO columns decreased by 3 to 5 % for both observation sites, andσN 20
AMTD
5, 2131–2167, 2012CH4, CO, and H2O
spectroscopy for TROPOMI
A. Galli et al.
Title Page
Abstract Introduction
Conclusions References
Tables Figures
◭ ◮
◭ ◮
Back Close
Full Screen / Esc
Printer-friendly Version
Interactive Discussion
Discussion
P
a
per
|
Dis
cussion
P
a
per
|
Discussion
P
a
per
|
Discussio
n
P
a
per
|
4 Conclusions
The current H2O spectroscopy affected, due to interference errors, the CO retrieval
accuracy at 4190–4340 cm−1 when the TROPOMI resolution was assumed. For wet conditions, the retrieved CO columns deviated by almost 15 % from the result at high spectral resolution. This error correlated with H2O content in the atmosphere. Because 5
the atmospheric H2O abundance is highly variable, this would lead to seasonal and
latitudinal biases of CO columns for the S5P mission. The CO bias reacted also very sensitively to a different H2O line list. No shortcomings of the CO spectroscopy itself
were detected. The impact of inaccurate CH4spectroscopy on CO retrieval errors could
not be quantified because of the small variations of atmospheric CH4. We presented 10
a way to mitigate the impact of interference errors from H2O and CH4by reducing the
retrieval window, but a further improvement on H2O and CH4spectroscopy is required
for the S5P mission. The loss of information due to a reduced spectral range may pose a problem to the inversion of back-scattered sunlight, for which also scattering properties of the atmosphere need to be retrieved.
15
For CH4 column errors, no strong correlation with H2O abundance was found. The combined H2O and CH4spectroscopy errors caused CH4retrieval errors consisting of
a constant bias of about 1 % and a standard deviation of about 0.3 %. This is better than the threshold accuracy requirement of 1 % for the S5P mission. Spectroscopy-related errors also manifested themselves in an increase of spectral fit residuals when 20
we compared the TROPOMI spectral range to the 6000 cm−1. This can be caused both by H2O and by CH4spectroscopy. We caution that the intrinsic retrieval accuracy of CH4 from TCCON spectra is a few tenths of a percent. This means we can only
identify spectroscopic deficiencies that result in column errors with the same order of magnitude as the intended accuracy for the S5P mission. For CO, the reference 25
accuracy is an order of magnitude better than the S5P requirement.
Both H2O and CH4showed an incorrect pressure-dependence at 4190–4340 cm− 1
AMTD
5, 2131–2167, 2012CH4, CO, and H2O
spectroscopy for TROPOMI
A. Galli et al.
Title Page
Abstract Introduction
Conclusions References
Tables Figures
◭ ◮
◭ ◮
Back Close
Full Screen / Esc
Printer-friendly Version
Interactive Discussion
Discussion
P
a
per
|
Dis
cussion
P
a
per
|
Discussion
P
a
per
|
Discussio
n
P
a
per
|
TROPOMI range than around 6000 cm−1. For atmospheric inversion this shortcoming would become important if the surface pressure was to be retrieved from the spectra. Currently, we do not intend such a pressure retrieval for TROPOMI spectra. To improve on the general accuracy of spectroscopic databases, we recommend a similar effort to be directed at the pressure broadening and pressure shift of absorption lines as done 5
by Frankenberg et al. (2008) for CH4at 5860–6185 cm−1.
Acknowledgements. This research was funded by the TROPOMI project through NSO. Re-search leading to these results has received funding from the European Union’s Seventh Framework Programme (FP7/2007–2013) under Grant Agreement no.218793, and by the Dutch User Support Programme under project GO-AO/16. A. Butz is supported by Deutsche 10
Forschungsgemeinschaft (DFG) through the Emmy-Noether programme, grant BU2599/1-1 (RemoteC). US funding for TCCON comes from NASA’s Terrestrial Ecology Program, grant number NNX11AG01G, the Orbiting Carbon Observatory Program, the Atmospheric CO2 Ob-servations from Space (ACOS) Program and the DOE/ARM Program. The Darwin TCCON site was built at Caltech with funding from the OCO project, and is operated by the Univer-15
sity of Wollongong, with travel funds for maintenance and equipment costs funded by the OCO-2 project. We acknowledge funding to support Darwin and Wollongong from the Aus-tralian Research Council, Projects LE0668470, DP0879468, DP110103118 and LP0562346. ECMWF ERA Interim analyses are provided through http://data-portal.ecmwf.int/data/d/interim daily/. TM4 modelled CH4 and CO concentration fields have been made available through 20
J. F. Meirink, Royal Netherlands Meteorological Institute (KNMI). The CarbonTracker 2010 results have been provided by NOAA ESRL, Boulder, Colorado, USA from the website at http://carbontracker.noaa.gov.
References
Bergamaschi, P., Frankenberg, C., Meirink, J. F., Krol, M., Villani, M. G., Houweling, S., Den-25
AMTD
5, 2131–2167, 2012CH4, CO, and H2O
spectroscopy for TROPOMI
A. Galli et al.
Title Page
Abstract Introduction
Conclusions References
Tables Figures
◭ ◮
◭ ◮
Back Close
Full Screen / Esc
Printer-friendly Version
Interactive Discussion
Discussion
P
a
per
|
Dis
cussion
P
a
per
|
Discussion
P
a
per
|
Discussio
n
P
a
per
|
Bovensmann, H., Burrows, J. P., Buchwitz, M., Frerick, J., No ¨el, S., Rozanov, V. V., Chance, K. V., and Goede, A. P. H.: SCIAMACHY: mission objectives and measurement modes, J. Atmos. Sci., 56, 127–150, 1999. 2134
Buchwitz, M., Khlystova, I., Bovensmann, H., and Burrows, J. P.: Three years of global car-bon monoxide from SCIAMACHY: comparison with MOPITT and first results related to the 5
detection of enhanced CO over cities, Atmos. Chem. Phys., 7, 2399–2411, doi:10.5194/acp-7-2399-2007, 2007. 2134
Butz, A., Guerlet, S., Hasekamp, O., Schepers, D., Galli, A., Aben, I., Frankenberg, C., Hart-mann, J.-M., Tran, H., Kuze, A., Keppel-Aleks, G., Toon, G., Wunch, D., Wennberg, P., Deutscher, N. M., Griffith, D., Macatangay, R., Messerschmidt, J., Notholt, J., and 10
Warneke, T.: Toward accurate CO2and CH4observations from GOSAT, Geophys. Res. Lett., 38, L14812, doi:10.1029/2011GL047888, 2011. 2134, 2135
Butz, A., Galli, A., Hasekamp, O., Landgraf, J., Tol, P., and Aben, I.: TROPOMI aboard precursor Sentinel-5 precursor: prospective performance of CH4retrievals for aerosol and cirrus loaded atmospheres, Remote Sens. Environ., doi:10.1016/j.rse.2011.05.030, 2012. 2135, 2138, 15
2139
Deeter, M. N., Edwards, D. P. Gille, J. C., and Drummond J. R.: CO retrievals based on MOPITT near-infrared observations, J. Geophys. Res., 114, D04303, doi:10.1029/2008JD010872, 2009. 2135
Deutscher, N. M., Griffith, D. W. T., Bryant, G. W., Wennberg, P. O., Toon, G. C., Washen-20
felder, R. A., Keppel-Aleks, G., Wunch, D., Yavin, Y., Allen, N. T., Blavier, J.-F., Jim ´enez, R., Daube, B. C., Bright, A. V., Matross, D. M., Wofsy, S. C., and Park, S.: Total column CO2 measurements at Darwin, Australia – site description and calibration against in situ aircraft profiles, Atmos. Meas. Tech., 3, 947–958, doi:10.5194/amt-3-947-2010, 2010. 2136
Frankenberg, C., Meirink, J. F., Bergamaschi, P., Goede, A. P. H., Heimann, M., K ¨orner, S., 25
Platt, U., van Weele, M., and Wagner, T.: Satellite chartography of atmospheric methane from SCIAMACHY on board ENVISAT: analysis of the years 2003 and 2004, J. Geophys. Res., 111, D07303, doi:10.1029/2005JD006235, 2006. 2134
Frankenberg, C., Warneke, T., Butz, A., Aben, I., Hase, F., Spietz, P., and Brown, L. R.: Pressure broadening in the 2ν3band of methane and its implication on atmospheric retrievals, Atmos.
30
Chem. Phys., 8, 5061–5075, doi:10.5194/acp-8-5061-2008, 2008. 2140, 2144, 2150 Fraser, A., Miller, C. C., Palmer, P. I., Deutscher, N. M., Jones, N. B., and Griffith, D. W. T.:
AMTD
5, 2131–2167, 2012CH4, CO, and H2O
spectroscopy for TROPOMI
A. Galli et al.
Title Page
Abstract Introduction
Conclusions References
Tables Figures
◭ ◮
◭ ◮
Back Close
Full Screen / Esc
Printer-friendly Version
Interactive Discussion
Discussion
P
a
per
|
Dis
cussion
P
a
per
|
Discussion
P
a
per
|
Discussio
n
P
a
per
|
a chemistry transport model, J. Geophys. Res., 116, D20306, doi:10.1029/2011JD015964, 2011. 2134
Gloudemans, A. M. S., Schrijver, H., Hasekamp, O. P., and Aben, I.: Error analysis for CO and CH4total column retrievals from SCIAMACHY 2.3 µm spectra, Atmos. Chem. Phys., 8, 3999–4017, doi:10.5194/acp-8-3999-2008, 2008.
5
Hasekamp, O. P. and Butz, A.: Efficient calculation of intensity and polarization spectra in vertically inhomogeneous scattering and absorbing atmospheres. J. Geophys. Res., 113, D20309, doi:10.1029/2008JD010379, 2008. 2137
Jenouvrier, A., Daumont, L., R ´egalia-Jarlot, L., Tyuterev, V. G., Carleer, M., Vandaele, A. C., Mikhailenko, S., and Fally, S.: Fourier transform measurements of water vapor line param-10
eters in the 4200–6600 cm−1region, J. Quant. Spectrosc. Ra., 105, 326–355, 2007. 2138, 2140
Kasten, F. and Young, A. T.: Revised optical air mass tabels and c approximation formula, Appl. Optics, 28(22), 4735–4738, 1989. 2137
Kuze, A., Suto, H., Nakajima, M., and Hamazaki, T.: Thermal and near infrared sensor for car-15
bon observation Fourier-transform spectrometer on the Greenhouse Gases Observing Satel-lite for greenhouse gases monitoring, Appl. Optics, 48, 6716, doi:10.1364/A O.48.006716, 2009.
de Laat, A. T. J., Gloudemans, A. M. S., Schrijver, H., Aben, I., Nagahama, Y., Suzuki, K., Mahieu, E., Jones, N. B., Paton-Walsh, C., Deutscher, N. M., Griffith, D. W. T., 20
De Mazi `ere, M., Mittermeier, R. L., Fast, H., Notholt, J., Palm, M., Hawat, T., Blumenstock, T., Hase, F., Schneider, M., Rinsland, C., Dzhola, A. V., Grechko, E. I., Poberovskii, A. M., Makarova, M. V., Mellqvist, J., Strandberg, A., Sussmann, R., Borsdorff, T., and Ret-tinger, M.: Validation of five years (2003–2007) of SCIAMACHY CO total column measure-ments using ground-based spectrometer observations, Atmos. Meas. Tech., 3, 1457–1471, 25
doi:10.5194/amt-3-1457-2010, 2010. 2134
Meirink, J. F., Eskes, H. J., and Goede, A. P. H.: Sensitivity analysis of methane emissions derived from SCIAMACHY observations through inverse modelling, Atmos. Chem. Phys., 6, 1275–1292, doi:10.5194/acp-6-1275-2006, 2006. 2140
Morino, I., Uchino, O., Inoue, M., Yoshida, Y., Yokota, T., Wennberg, P. O., Toon, G. C., 30
AMTD
5, 2131–2167, 2012CH4, CO, and H2O
spectroscopy for TROPOMI
A. Galli et al.
Title Page
Abstract Introduction
Conclusions References
Tables Figures
◭ ◮
◭ ◮
Back Close
Full Screen / Esc
Printer-friendly Version
Interactive Discussion
Discussion
P
a
per
|
Dis
cussion
P
a
per
|
Discussion
P
a
per
|
Discussio
n
P
a
per
|
methane retrieved from GOSAT short-wavelength infrared spectra, Atmos. Meas. Tech., 4, 1061–1076, doi:10.5194/amt-4-1061-2011, 2011. 2134, 2135
Parker, R., Boesch, H., Cogan, A., Fraser, A., Feng, L., Palmer, P. I., Messerschmidt, J., Deutscher, N. M., Griffith, D. W. T., Notholt, J., Wennberg, P. O., and Wunch, D.: Methane observations from the Greenhouse Gases Observing SATellite: comparison 5
to ground-based TCCON data and model calculations, Geophys. Res. Lett., 38, 2–7, doi:10.1029/2011GL047871, 2011. 2134, 2135
Phillips, P.: A technique for the numerical solution of certain integral equations of the first kind, J. Assoc. Comput. Mach., 9, 84–97, 1962. 2139
Press, W. H., Flannery, B. P., Teukolsky S. A., and Vetterling W. T. (Eds.): Numerical Recipes. 10
The Art of Scientific Computing, Cambridge University Press, Cambridge, UK, 1986. 2147 Reuter, M., Bovensmann, H., Buchwitz, M., Burrows, J. P., Connor, B. J., Deutscher, N. M.,
Griffith, D. W. T., Heymann, J., Keppel-Aleks, G., Messerschmidt, J., Notholt, J., Petri, C., Robinson, J., Schneising, O., Sherlock, V. Velazco, V., Warneke, T., Wennberg, P. O., and Wunch, D.: Retrieval of atmospheric CO2with enhanced accuracy and precision from SCIA-15
MACHY: validation with FTS measurements and comparison with model results, J. Geophys. Res., 116, D04301, doi:10.1029/2010JD015047, 2011. 2134
Rothman, L. S., Gordon, I. E., Barbe, A., Benner, D. C., Bernath, P. F., Birk, M., Boudon, V., Brown, L. R., Campargue, A., Champion, J., Chance, K., Coudert, L. H., Dana, V., Devi, V. M., Fally, S., Flaud, J., Gamache, R. R., Goldman, A., Jacquemart, D., Kleiner, I., 20
Lacome, N., Lafferty, W. J., Mandin, J., Massie, S. T., Mikhailenko, S. N., Miller, C. E., Moazzen-Ahmadi, N., Naumenko, O. V., Nikitin, A. V., Orphal, J., Perevalov, V. I., Perrin, A., Predoi-Cross, A., Rinsland, C. P., Rotger, M., ˇSimeˇckov ´a, M., Smith, M. A. H., Sung, K., Tashkun, S. A., Tennyson, J., Toth, R. A., Vandaele, A. C., and Vander Auwera, J.: The HI-TRAN 2008 molecular spectroscopic database, J. Quant. Spectrosc. Ra., 110, 533–572, 25
2009. 2138
Scheepmaker, R. A., Frankenberg, C., Galli, A., Schrijver, H., Fally, S., Deutscher, N. M., Wunch, D., Warneke, T., and Aben I.: Improved water vapour spectroscopy in the 4174– 4300 cm−1region and its impact on SCIAMACHY’s HDO/H2O measurements, Atmos. Meas. Tech., in preparation, 2012. 2138
30
AMTD
5, 2131–2167, 2012CH4, CO, and H2O
spectroscopy for TROPOMI
A. Galli et al.
Title Page
Abstract Introduction
Conclusions References
Tables Figures
◭ ◮
◭ ◮
Back Close
Full Screen / Esc
Printer-friendly Version
Interactive Discussion
Discussion
P
a
per
|
Dis
cussion
P
a
per
|
Discussion
P
a
per
|
Discussio
n
P
a
per
|
Tikhonov, A.: On the solution of incorrectly stated problems and a method of regularization. Dokl. Akad. Nauk SSSR, 151, 501–504, 1963. 2139
Tran, H., Hartmann, J.-M., Toon, G., Brown, L. R., Frankenberg, C., Warneke, T., Spietz, P., and Hase, F.: The 2ν3 band of CH4 revisited with line mixing: consequences for spec-troscopy and atmospheric retrievals at 1.67 µm, J. Quant. Spectrosc. Ra., 111, 1344–1356, 5
doi:10.1016/j.jqsrt.2010.02.015, 2010. 2134, 2140
Veefkind, J. P., Aben, I., McMullan, K., F ¨orster, H., de Vries, J., Otter, G., Claas, J., Eskes, H. J., de Haan, J. F., Kleipool, Q., van Weele, M., Hasekamp, O., Hoogeveen, R., Landgraf, J., Snel, R., Tol, P., Ingmann, P., Voors, R., Kruizinga, B., Vink, R., Visser, H., and Levelt, P. F.: TROPOMI on the ESA Sentinel-5 Precursor: a GMES mission for global observations of the 10
atmospheric composition for climate, air quality and ozone layer applications, Remote Sens. Environ., doi:10.1016/j.rse.2011.09.027, 2012. 2134
Vidot, J., Landgraf, J., Hasekamp, O. P., Butz, A., Galli A., Tol P., and Aben. I.: Carbon monoxide from shortwave infrared reflectance measurements: a new retrieval approach for clear sky and partially cloudy atmospheres, Remote Sens. Environ., doi:10.1016/j.rse.2011.09.032, 15
2012. 2135, 2147, 2148
Washenfelder, R. A., Toon, G. C., Blavier, J.-F., Yang, Z., Allen, N. T., Wennberg, P. O., Vay, S. A., Matross, D. M., and Daube, B. C.: Carbon dioxide column abundances at the Wisconsin Tall Tower site, J. Geophys. Res., 111, D22305, doi:10.1029/2006JD007154, 2006. 2136 Wunch, D., Toon, G. C., Wennberg, P. O., Wofsy, S. C., Stephens, B. B., Fischer, M. L., 20
Uchino, O., Abshire, J. B., Bernath, P., Biraud, S. C., Blavier, J.-F. L., Boone, C., Bow-man, K. P., Browell, E. V., Campos, T., Connor, B. J., Daube, B. C., Deutscher, N. M., Diao, M., Elkins, J. W., Gerbig, C., Gottlieb, E., Griffith, D. W. T., Hurst, D. F., Jim ´enez, R., Keppel-Aleks, G., Kort, E. A., Macatangay, R., Machida, T., Matsueda, H., Moore, F., Morino, I., Park, S., Robinson, J., Roehl, C. M., Sawa, Y., Sherlock, V., Sweeney, C., Tanaka, T., and 25
Zondlo, M. A.: Calibration of the Total Carbon Column Observing Network using aircraft pro-file data, Atmos. Meas. Tech., 3, 1351–1362, doi:10.5194/amt-3-1351-2010, 2010. 2135 Wunch, D., Toon, G. C., Blavier, J.-F. L., Washenfelder, R. A., Notholt, J., Connor, B. J.,
Grif-fith, D. W. T., Sherlock, V., and Wennberg, P. O.: The Total Carbon Column Observing Net-work, Phil. Trans. R. Soc. A, 369, 2087–2112, doi:10.1098/rsta.2010.0240, 2011a. 2134, 30
2139, 2140
AMTD
5, 2131–2167, 2012CH4, CO, and H2O
spectroscopy for TROPOMI
A. Galli et al.
Title Page
Abstract Introduction
Conclusions References
Tables Figures
◭ ◮
◭ ◮
Back Close
Full Screen / Esc
Printer-friendly Version
Interactive Discussion
Discussion
P
a
per
|
Dis
cussion
P
a
per
|
Discussion
P
a
per
|
Discussio
n
P
a
per
|
Crisp, D., Deutscher, N. M., Eldering, A., Fisher, M. L., Griffith, D. W. T., Gunson, M., Heikki-nen, P., Keppel-Aleks, G., Kyr ¨o, E., Lindenmaier, R., Macatangay, R., Mendonca, J., Messer-schmidt, J., Miller, C. E., Morino, I., Notholt, J., Oyafuso, F. A., Rettinger, M., Robinson, J., Roehl, C. M., Salawitch, R. J., Sherlock, V., Strong, K., Sussmann, R., Tanaka, T., Thomp-son, D. R., Uchino, O., Warneke, T., and Wofsy, S. C.: A method for evaluating bias in global 5
measurements of CO2 total columns from space, Atmos. Chem. Phys., 11, 12317–12337, doi:10.5194/acp-11-12317-2011, 2011. 2134
AMTD
5, 2131–2167, 2012CH4, CO, and H2O
spectroscopy for TROPOMI
A. Galli et al.
Title Page
Abstract Introduction
Conclusions References
Tables Figures
◭ ◮
◭ ◮
Back Close
Full Screen / Esc
Printer-friendly Version
Interactive Discussion
Discussion
P
a
per
|
Dis
cussion
P
a
per
|
Discussion
P
a
per
|
Discussio
n
P
a
per
|
Table 1.Overview of spectral ranges used for inversion.
window wavenumber target other
number range (cm−1) species absorbers
1 5880–5996 CH4 CO2, H2O
2 5996.45–6007.55 CH4 CO2, H2O
3 6007–6145 CH4 CO2, H2O
4 6073.05–6080.75, 6098.4–6100.3, 6124.4–6127.3, 6176.47–6178.13,
6252.35–6259.55, H2O CH4, CO2 6293.45–6309.25,
6389.35–6395.55, 6400.0–6402.3,
6466.1–6473.1
5 4208.7–4257.3, CO H2O, HDO,
4262–4318.8 CH4
6a 4190–4340 CH4, CO H2O, HDO
TCCON resolution
6b 4190–4340 CH4, CO H2O, HDO
AMTD
5, 2131–2167, 2012CH4, CO, and H2O
spectroscopy for TROPOMI
A. Galli et al.
Title Page
Abstract Introduction
Conclusions References
Tables Figures
◭ ◮
◭ ◮
Back Close
Full Screen / Esc
Printer-friendly Version
Interactive Discussion
Discussion
P
a
per
|
Dis
cussion
P
a
per
|
Discussion
P
a
per
|
Discussio
n
P
a
per
|
Table 2. Fit diagnostics of the CH4 column retrievals in the 4190–4340 cm−1 range, for the
original (TCCON) and for the TROPOMI resolution.
hχ2/νi σN σref b
AMTD
5, 2131–2167, 2012CH4, CO, and H2O
spectroscopy for TROPOMI
A. Galli et al.
Title Page
Abstract Introduction
Conclusions References
Tables Figures
◭ ◮
◭ ◮
Back Close
Full Screen / Esc
Printer-friendly Version
Interactive Discussion
Discussion
P
a
per
|
Dis
cussion
P
a
per
|
Discussion
P
a
per
|
Discussio
n
P
a
per
|
Table 3.Fit diagnostics of the CO column retrievals for the TROPOMI resolution.
hχ2/νi σN σref b
AMTD
5, 2131–2167, 2012CH4, CO, and H2O
spectroscopy for TROPOMI
A. Galli et al.
Title Page
Abstract Introduction
Conclusions References
Tables Figures
◭ ◮
◭ ◮
Back Close
Full Screen / Esc
Printer-friendly Version
Interactive Discussion
Discussion
P
a
per
|
Dis
cussion
P
a
per
|
Discussion
P
a
per
|
Discussio
n
P
a
per
|
Table 4. Fit diagnostics of the H2O column retrievals at the 4190–4340 cm−1 range, for the
original (TCCON) and for the TROPOMI resolution.
hχ2/νi σN σref b
Darwin TROPOMI 43 2.6 % 1.9 % 0.082 Park Falls TROPOMI 32 4.6 % 2.4 % 0.006
Darwin TCCON 106 2.2 % 1.9 % 0.061
AMTD
5, 2131–2167, 2012CH4, CO, and H2O
spectroscopy for TROPOMI
A. Galli et al.
Title Page
Abstract Introduction
Conclusions References
Tables Figures
◭ ◮
◭ ◮
Back Close
Full Screen / Esc
Printer-friendly Version
Interactive Discussion
Discussion
P
a
per
|
Dis
cussion
P
a
per
|
Discussion
P
a
per
|
Discussio
n
P
a
per
|
a
4200 4250 4300
wavenumber (cm-1)
0 0.02 0.04 0.06
transmittance (arbitrary units)
original TCCON resolution
b
4300 4305 4310 4315 4320 4325
wavenumber (cm-1)
0 0.02 0.04 0.06 0.08
transmittance (arbitrary units)
TROPOMI resolution
Fig. 1. (a)Original TCCON spectrum of the TROPOMI wavenumber range 4190–4340 cm−1,
AMTD
5, 2131–2167, 2012CH4, CO, and H2O
spectroscopy for TROPOMI
A. Galli et al.
Title Page
Abstract Introduction
Conclusions References
Tables Figures
◭ ◮
◭ ◮
Back Close
Full Screen / Esc
Printer-friendly Version
Interactive Discussion
Discussion
P
a
per
|
Dis
cussion
P
a
per
|
Discussion
P
a
per
|
Discussio
n
P
a
per
|
4200 4225 4250 4275 4300 4325
wavenumber (cm-1)
1e-05 0.0001 0.001 0.01 0.1 1 10 100
optical depth
τ
H2O
CH4
CO
Fig. 2.Approximate optical depth versus wave numbers, attributed to the three species
AMTD
5, 2131–2167, 2012CH4, CO, and H2O
spectroscopy for TROPOMI
A. Galli et al.
Title Page
Abstract Introduction
Conclusions References
Tables Figures
◭ ◮
◭ ◮
Back Close
Full Screen / Esc
Printer-friendly Version
Interactive Discussion
Discussion
P
a
per
|
Dis
cussion
P
a
per
|
Discussion
P
a
per
|
Discussio
n
P
a
per
|
a Jun 2004 Apr 2005 Feb 2006 Dec 2006 Oct 2007
3.55 3.6 3.65 3.7 3.75 3.8 3.85 3.9
CH
4
columns (10
19 mol. cm -2)
5996 - 6147 cm-1, Darwin
5996 - 6147 cm-1, Park Falls
4190 - 4340 cm-1, TROPOMI res., Darwin
4190 - 4340 cm-1, TROPOMI res., Park Falls
b Jun 20040 Apr 2005 Feb 2006 Dec 2006 Oct 2007
0.002 0.004 0.006 0.008 0.01 0.012 0.014 0.016 0.018 0.02 0.022
rel. difference of CH
4
columns
∆N/N, TROPOMI resolution, Darwin
∆N/N, TROPOMI resolution, Park Falls
∆N/N, TCCON resolution, Darwin
∆N/N, TCCON resolution, Park Falls
σ
ref
σ
ref
Fig. 3. CH4 retrieval accuracy for the 4190–4340 cm−1 range. (a) shows the time-series of
AMTD
5, 2131–2167, 2012CH4, CO, and H2O
spectroscopy for TROPOMI
A. Galli et al.
Title Page
Abstract Introduction
Conclusions References
Tables Figures
◭ ◮
◭ ◮
Back Close
Full Screen / Esc
Printer-friendly Version
Interactive Discussion
Discussion
P
a
per
|
Dis
cussion
P
a
per
|
Discussion
P
a
per
|
Discussio
n
P
a
per
|
Jun 2004 Apr 2005 Feb 2006
-0.03 -0.02 -0.01 0 0.01 0.02 0.03 0.04 0.05 0.06 0.07 0.08 0.09 0.1 0.11 0.12 0.13 0.14 0.15
rel. difference of dry air columns
∆N/N, ECMWF ∆N/N, 5996 - 6147 cm-1 ∆N/N, 4190 - 4340 cm-1
Fig. 4.Impact of spectroscopic line lists on derived pressure at Park Falls. Black: Total dry air