www.jped.com.br
ORIGINAL
ARTICLE
Analysis
of
childhood
leukemia
mortality
trends
in
Brazil,
from
1980
to
2010
夽
,
夽夽
Franciane
F.
Silva
a,∗,
Eliana
Zandonade
a,
Glaucia
P.
Zouain-Figueiredo
baUniversidadeFederaldoEspíritoSanto(UFES),Vitória,ES,Brazil bHospitalInfantilNossaSenhoradaGlória(HINSG),Vitória,ES,Brazil
Received1October2013;accepted20March2014 Availableonline17June2014
KEYWORDS
Infantmortality; Leukemia; Linearmodels; Child;
Adolescent
Abstract
Objective: Leukemiascomprisethemostcommongroupofcancersinchildrenandadolescents.
StudiesconductedinothercountriesandBrazilhaveobservedadecreaseintheirmortality.This
studyaimedtoevaluatethetrendofmortalityfromleukemiainchildrenunder19yearsofage
inBrazil,from1980to2010.
Methods: Thiswasanecologicalstudy,usingretrospectivetimeseriesdatafromtheMortality
InformationSystem,from1980to2010.Calculationsofmortalityrateswereperformed,
includ-inggross, gender-specific,andage-based.For trendanalysis,linearandsemi-logregression
modelswereused.Thesignificancelevelwas5%.
Results: Mortalityratesforlymphoidandmyeloidleukemiaspresentedagrowthtrend,withthe
exceptionoflymphoidleukemiaamongchildrenunder4yearsofage(percentagedecrease:
1.21% annually),whileinthesub-group‘‘Othertypes ofleukemia’’,adownwardtrendwas
observed.Overall,mortalityfromleukemiatendedtoincreasefor boysandgirls,especially
intheagegroups 10-14years(annualpercentageincreaseof1.23%formalesand1.28%for
females)and15-19years(annualpercentageincreaseof1.40%formalesand1.62%forfemales).
Conclusions: Theresultsforleukemiagenerallycorroboratetheresultsofothersimilarstudies.
Adetailedanalysisbysubgroupofleukemia,age,andgenderrevealednotrendsshowninother
studies,thusindicatingspecialrequirementsforeachvariableintheanalysis.
©2014SociedadeBrasileiradePediatria.PublishedbyElsevierEditoraLtda.Allrightsreserved.
夽 Pleasecitethisarticleas:SilvaFF,ZandonadeE,Zouain-FigueiredoGP.AnalysisofchildhoodleukemiamortalitytrendsinBrazil,from 1980to2010.JPediatr(RioJ).2014;90:587---92.
夽夽
StudyassociatedwiththePostgraduatePrograminCollectiveHealth,UniversidadeFederaldoEspíritoSanto,Vitória,ES,Brazil.
∗Correspondingauthor.
E-mail:[email protected](F.F.Silva).
http://dx.doi.org/10.1016/j.jped.2013.12.013
PALAVRAS-CHAVE
Mortalidadeinfantil; Leucemia;
Modeloslineares; Crianc¸a;
Adolescente
AnálisedatendênciadamortalidadeporleucemiasinfantojuvenisnoBrasil,de1980 até2010
Resumo
Objetivo: Asleucemias compreendem ogrupo mais frequente deneoplasias em crianc¸as e
adolescentes. Estudos conduzidos em outros países e no Brasil evidenciam, diminuic¸ão de
suamortalidade eaumento dasobrevida.O objetivodo estudoéconhecer atendência de
mortalidadeporleucemiaemmenoresde19anosdeidadenoBrasilde1980a2010.
Métodos: Trata-sedeestudoecológico,retrospectivodesérietemporalcomdadosextraídosdo
SistemadeInformac¸ãosobreMortalidade,noperíodode1980a2010.Realizadoscálculosdas
taxasdemortalidadebrutaseespecíficasporsexoefaixaetária.Paraaanálisedetendência
utilizou-semodelosderegressãosemilogarítmicoselineares.Adotadoníveldesignificânciade
5%.
Resultados: Astaxasdemortalidadeporleucemiaslinfoidesemieloidesapresentam
tendên-ciade crescimento comexcec¸ão dasleucemiaslinfoidesentre meninosmenores de4anos
deidade(quedapercentual1,21%aoano),enquantonosubgrupodenominado‘‘Outrostipos
deleucemias’’observa-setendênciadequeda.Deformaglobal,amortalidadeporleucemias
tendeaaumentarparameninosemeninas,principalmentenasfaixasetáriasde10a14anos
(aumento percentual anual de 1,23% para meninos e 1,28% para meninas) e 15 a 19 anos
(aumentopercentualanualde1,40%parameninose1,62%parameninas).
Conclusões: Osresultadosparaleucemiasdeformageralcorroboramcomresultadosdeoutros
estudossimilares.Aanáliseminuciosaporsubgrupodeleucemia,faixaetáriaesexorevelou
tendênciasnãomostradasemoutrosestudos,indicandoassimnecessidadesespeciaisnaanálise
decadavariável.
©2014SociedadeBrasileiradePediatria.PublicadoporElsevierEditoraLtda.Todososdireitos
reservados.
Introduction
Neoplasmshave becomeimportant in theepidemiological scenario, as they represent one of the leading causes of deathofinthe1to19yearsagegroupinBrazil,secondonly toexternalcauses,in2010,despitetherarityofchildhood cancerwhencomparedtoadults.1
In children, tumors are usually categorized into 12 specialty groups, according to the Third Edition of the International Classification of Childhood Cancer (ICCC). Leukemias constitute Group I, which comprises the subgroups: acute lymphocytic leukemia; acute myeloid leukemia;andchronicmyeloproliferativedisorders, includ-ingchronic myeloidleukemia and unspecificor combined types. Chroniclymphocytic leukemia is extremely rare in childrenandwasthereforeincludedinthesubgroupofacute lymphocyticleukemia, the predominant typeof leukemia in children, without affecting the incidence rates in this subgroup.2
Acutelymphoblasticleukemiarepresentsthemajorityof casesamongthediagnosticgroupsoflymphocyticleukemias (99%), so that the diagnosis group of ICCC becomes syn-onymouswithacutelymphocyticleukemia.Likewise,acute nonlymphocyticleukemiasarereferredtoasacutemyeloid leukemia(representing69%)andchronicmyeloidleukemia, with6-7%representationinitsgroup.3
Leukemiashavethehighestincidenceratesamong child-hoodtumorsinBrazilandworldwide.Inastudyconducted inthe United States, of allneoplasms, leukemias showed a frequency of 26.3%. In Brazil, theywere also the most
prevalentin 20population-basedcancer registries,witha medianpercentageof29%,withthehighestincidence occur-ringintheagegroup1-4years,withamedianpercentage of31.6%.Leukemiawastheleadingcauseofdeathamong cancersinchildrenandadolescents(1-18years)from2001 to2005 inBrazil, with1,897deaths in femalesand 2,539 deathsinmales.4
Thepresentstudyaimedtoassessthetrendofmortality fromchildhoodleukemiainBrazilfrom1980to2010.
Methods
Thisisanecological,retrospective,time-seriesstudybased onsecondarydata.Theanalysisincludedcasesofdeathdue toleukemia in children upto 19years of age (inclusive), whichoccurredin Brazilandwererecordedin the Mortal-ity Information System (SIM) in the period of 1980-2010. Data were obtained from the website of the Department of Informaticsof theUnifiedHealthSystem (DATASUS)1 of theMinistryofHealth.
ThecategorizationusedwasbasedontheInternational Classification of Diseases,5 ninthand tenthrevisions, ICD-9 (used from 1980 to 1995) and ICD-10 (used from 1996 to2010), astheywere theclassifications usedduring the studiedperiod.
ICD-9. Then, the codes 206, 207, 208 were grouped in a single stratumcalled ‘‘other types of leukemias.’’ In the yearsafter1995,theICD-10 wasusedwiththecodesC91 (lymphoidleukemia),C92(myeloidleukemia),C93 (mono-cyticleukemia),C94(otherleukemiasofspecificcelltype), C95 (leukemia of unspecified cell type), grouping codes C93, C94, C95 in a single stratum called ‘‘other types of leukemia.’’
Patientswerecategorizedintoagegroupswitharange of 4 years,as recommended by the International Agency forResearchonCancer(IARC).Thereforethefollowingage groups were used:0-4; 5-9;10-14; and 15-19years.6 The firstthreegroupscorrespondtochildren;thelast,to adoles-cents.Thefemaleandmalegenderswereanalyzedtogether andseparately.
Mortality rates from leukemiaper million children and adolescentsperyearinBrazilwerecalculated.The follow-ing formula was used to calculate this coefficient in the selected period:number of deaths from leukemiaby age group, divided by the population of children and adoles-cents,multipliedby1,000,000.Thespecificmortalityrate foreachgenderandleukemiasubgroupwasalsocalculated separately.
Thedirectstandardizationmethodwasusedsothatthe mortalityratewouldnotbeinfluencedbytheagestructure ofthe population,allowing forthecomparisonwithother populations.7
Thestandardpopulationusedinthisstudywasthat pro-posedbySegie,modifiedbyDoll.8Onstandardizationbyage groupandgender,itwasconsideredthatagestructuresare thesameformenandwomen.Thus,thesamestandard pop-ulationwasusedforcalculationofthetotalcoefficientsand bygender.9
Regression adjustments wereperformed. The adjusted modelsweresemi-logandlineardefinedas:
Semi-log:InYt=ˇ1+ˇ2t+εt
Linear:Yt=ˇ1+ˇ2t+εt
In which the dependent variables are InYt and Yt, the independent (or regressor) variable is time t, which assumes values 1,2,3... 31. ˇ1 represents the intercept,
ˇ2angularcoefficient,andεtrepresentstherandomerror.
This method is widely used and recommended by the IARC.10
Inthelinearmodel,theangularcoefficientˇ2measures
absolutevariation,whereasinthesemi-logarithmicmodelit measurestheproportionalvariationorconstantrelativein
Yforagivenabsolutevariationinthevalueoftheregressor (inthiscase,thevariablet).
Iftheangularcoefficientispositive,Yshowsan increas-ing trend; if it is negative, Y shows a decreasing trend. Angular coefficients with p-value <5% in the t-test were consideredstatisticallysignificant.11
Regressions were generated: for the total in each age groupandforeach typeofleukemia;forboysandgirlsin eachagegroup;andfor eachtypeofleukemia.Atotalof 96regressionswereanalyzed.
Thebestmodelwaschosenbythelowervaluecriterionof theAkaikeInformationCriterion(AIC)andthelowervalues ofSchwarz’sInformationCriterion,alsoknownasBayesian InformationCriterion(BIC).11 Significancesoftheˇ
2model
were alsoevaluated, andin case of a draw, the simplest modelwaschosen,i.e.,thelinearone.
Excel2007(Microsoft,Washington,USA)andEviews(IHS GlobalInc.Califórnia, USA)software programswere used forthestatisticalanalysis.Thelevelofsignificancewasset at5%.
ThestudywasapprovedbytheEthicsCommitteeofthe Health Sciences Center, Universidade Federal do Espírito Santo.
Results
The population of deaths from leukemia in children and adolescents(0-19years)inBrazilconsistedof30,029cases reportedintheperiodof1980-2010.
Table 1 shows the results of the best modelsfor each combinationofthevariablesgender,agerange,andtypeof leukemia,includingthetotaldataforbothgendersandall typesofleukemias.
An annual percentagerate wasfound showinga 4.24% decreaseinmortality(forages0-4years)whenevaluating theleukemiasingeneral,withoutestablishingsubgroupsand irrespectiveofgender.
Mortality rates from lymphoid leukemias showed an increasing trend, except in boys aged 0-4 years, which showedanannualpercentagedecreaseof1.21%.
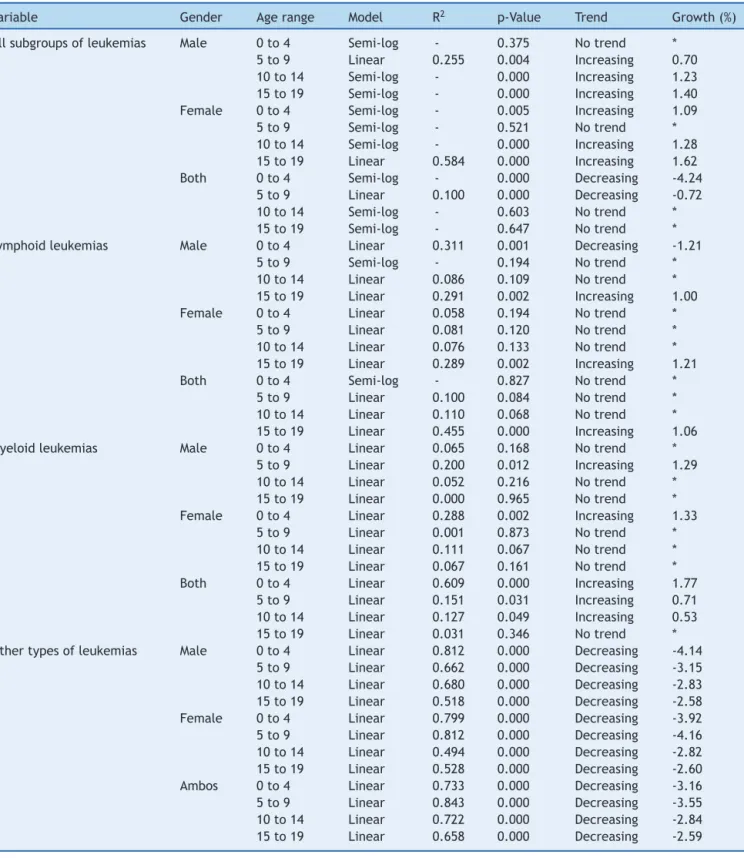
Mortalityratesformyeloidleukemiashowedan increas-ingtrend,andthe mostaccentuatedrate,withanannual percentageof1.77%wasobservedintheagegroup0-4years, analyzedinbothgenders(Fig.1).
Mortality rates for the subgroup of other types of leukemiasshowedadecreasingtrend,withthemost promi-nentamongthemobservedforfemalesintheagegroup5-9 years,withanannualpercentagedecreaseof4.16%peryear.
Discussion
Theanalysis ofhistorical trendsin mortalityis more suit-ableforassessingtheprogressofcancerthantheincidence trend.Thisassertionisbasedonthefactthatvitalstatistics, suchasmortality,arelesssubjecttochangesinsurveillance andcancerrecordingpracticesthanregistrydata(e.g.,data forcalculationofincidence).12
Table1 Resultsofregressionsofthechosenmodels.
Variable Gender Agerange Model R2 p-Value Trend Growth(%)
Allsubgroupsofleukemias Male 0to4 Semi-log - 0.375 Notrend *
5to9 Linear 0.255 0.004 Increasing 0.70
10to14 Semi-log - 0.000 Increasing 1.23
15to19 Semi-log - 0.000 Increasing 1.40
Female 0to4 Semi-log - 0.005 Increasing 1.09
5to9 Semi-log - 0.521 Notrend *
10to14 Semi-log - 0.000 Increasing 1.28
15to19 Linear 0.584 0.000 Increasing 1.62
Both 0to4 Semi-log - 0.000 Decreasing -4.24
5to9 Linear 0.100 0.000 Decreasing -0.72
10to14 Semi-log - 0.603 Notrend *
15to19 Semi-log - 0.647 Notrend *
Lymphoidleukemias Male 0to4 Linear 0.311 0.001 Decreasing -1.21
5to9 Semi-log - 0.194 Notrend *
10to14 Linear 0.086 0.109 Notrend *
15to19 Linear 0.291 0.002 Increasing 1.00
Female 0to4 Linear 0.058 0.194 Notrend *
5to9 Linear 0.081 0.120 Notrend *
10to14 Linear 0.076 0.133 Notrend *
15to19 Linear 0.289 0.002 Increasing 1.21
Both 0to4 Semi-log - 0.827 Notrend *
5to9 Linear 0.100 0.084 Notrend *
10to14 Linear 0.110 0.068 Notrend *
15to19 Linear 0.455 0.000 Increasing 1.06
Myeloidleukemias Male 0to4 Linear 0.065 0.168 Notrend *
5to9 Linear 0.200 0.012 Increasing 1.29
10to14 Linear 0.052 0.216 Notrend *
15to19 Linear 0.000 0.965 Notrend *
Female 0to4 Linear 0.288 0.002 Increasing 1.33
5to9 Linear 0.001 0.873 Notrend *
10to14 Linear 0.111 0.067 Notrend *
15to19 Linear 0.067 0.161 Notrend *
Both 0to4 Linear 0.609 0.000 Increasing 1.77
5to9 Linear 0.151 0.031 Increasing 0.71
10to14 Linear 0.127 0.049 Increasing 0.53
15to19 Linear 0.031 0.346 Notrend *
Othertypesofleukemias Male 0to4 Linear 0.812 0.000 Decreasing -4.14
5to9 Linear 0.662 0.000 Decreasing -3.15
10to14 Linear 0.680 0.000 Decreasing -2.83
15to19 Linear 0.518 0.000 Decreasing -2.58
Female 0to4 Linear 0.799 0.000 Decreasing -3.92
5to9 Linear 0.812 0.000 Decreasing -4.16
10to14 Linear 0.494 0.000 Decreasing -2.82
15to19 Linear 0.528 0.000 Decreasing -2.60
Ambos 0to4 Linear 0.733 0.000 Decreasing -3.16
5to9 Linear 0.843 0.000 Decreasing -3.55
10to14 Linear 0.722 0.000 Decreasing -2.84
15to19 Linear 0.658 0.000 Decreasing -2.59
Obs:Wheretherewasnotrend,thevalueswereomittedandreportedas*.
SincetheR2valuesofsemi-logandlinearregressionsarenotcomparable,onlyR2valuesofthelinearregressionswerereported.
years(Fig.3).Whenconsideringonlythegender,thepattern alsochanged:themortalityrates fromleukemiasinmales andfemalesshowedanincreasingtrend.
Studies performed in Latin American countries(Brazil, Chile, andthe DominicanRepublic) showed a decreasein themortalitytrend.Thisbehaviorcanbeexplainedbythe
improvementin cancerdiagnostictechniques and increas-ingly effective chemotherapy protocols, procedures that directlyreflecttheimproveddiseaseprognosis.15
1981
1980 1982198319841985198619871988198919901991199219931994199 5
199619971998198920002001200220032004200520062007200820092010
Both 0 to 4 Both 5 to 9 Both 10 to 14
0.2 0.3 0.4 0.5 0.6 0.7 0.8 0.9
Figure1 Linechartofstandardizedratesofmortalityfrommyeloidleukemia,forbothgenders,acrossstatisticallysignificant
agerangesintheperiodof1980to2010,inBrazil.
1981
1980 1982198319841985198619871988198919901991199219931994199 5
19961997199819892000200120022003200420 05
200620 07
200820092010
Both 10 to 14 Both 15 to 19 Both 5 to 9
Both 0 to 4 0
0.2 0.4 0.6 0.8 1 1.2
Figure2 Linechartofstandardizedratesofmortalityfromotherleukemias,forbothgenders,acrossstatisticallysignificantage
rangesintheperiodof1980to2010,inBrazil.
byassertingthatprotocolsforthetreatmentofadolescents andyoungadultsarenotadequateforthisagegroup,since patientssometimesaretreatedasadultsandsometimesas pediatric patients, and that special physical and psycho-logical needs for this age group arenot recognized.This inappropriatetreatment isdemonstratedasdifferencesin survivalbetween theagegroups. Itis necessary to recog-nizethedifferencesinthebiologicalcharacteristicsofthe disease, which will lead to further advances in lymphoid
leukemia therapeutic protocols for older children (older than10years).
The toxicity and mortality associated with treatment havebeendiscussedinspecificstudiesonleukemia,which can influence the increased rates of mortality in certain groups.
There have been reports that intensive chemotherapy inpatients withacute lymphoidleukemia leads tosevere neutropenia,exposingpatientstoinfectionsthatcancause
1981
1980 1982198319841985198619871988198919901991199219931994199 5
199619971998198920002001200220032004200520062007200820092010
Both 15 to 19 0.2
0.3 0.4 0.5 0.6 0.7 0.8 0.9
Figure3 Linechartofstandardizedratesofmortalityfromlymphoidleukemia,forbothgenders,acrossstatisticallysignificant
death (41% of deaths in a sample were related to sep-ticshock).16 Estimateshave describedthatdeaths related to acute lymphoid leukemia treatment in less developed countriesrange between 11% and 20%; for acute myeloid leukemia,itmayreach33%.17
Thelackofinformationabout dataqualityandpossible migrationofcases,aswellastheheterogeneityofBrazilian rates,arelimitations ofthe studyandneed tobe consid-eredwhenassessingtheconclusions.TheBrazilianMortality InformationSystem(SistemadeInformac¸õesdeMortalidade -SIM)wascreatedin1975and1976,andisoneofthefirst inBrazil.The qualityofmortalitydatahasimproved over the years,although it stillcontains flaws. It is estimated thatthecoverage ofmortalitydata in1999 was82%. The qualityshouldbeemphasized,particularlyincasesofdeath fromcancer,asthesehaveadeathcertificatethathasbeen adequatelycompleted.18
Thus,themortalityrates ofcancer maychangedue to registryartifactsovertheyears.Itispossiblethatthecases that were once classified in death certificates as ‘‘other leukemias’’orjust‘‘leukemia’’withoutspecification,have migratedovertimetothespecificcases,causingtheserates toincrease.Thismayhaveledtomoredetailedcompletion ofdeathcertificates.
As a result, there was a more pronounced decreasing mortalitytrendincasesdefinedas‘‘otherleukemias’’and increasedratesofspecificcases.Anotheraspecttobe con-sidered is the heterogeneity regarding the regions. While Brazilgenerallyshowedadecreasingtrendintheestimated meanannualgrowthratesofleukemiamortality,therewas anincreasingtrendintheNorthandNortheastregions.19
Thisstudydemonstratedthatforleukemias,ingeneral, there was a decreasing trend in mortality rates, as did other studies.19,20 However, on a more detailed analysis, whenassessingsubgroupsofleukemiasandspecifying gen-der,thesetrendschanged:whilethelymphoid(exceptfor the age group of up to four years in boys) and myeloid leukemia rates showed an increase, the subgroup classi-fiedas‘‘otherleukemias’’showedadecrease.Observingall leukemiasandconsideringgender,mortalityratesofmales andfemalesshowedanincrease.Adetailedanalysisby sub-groupofleukemia,agerange,andgendershowedtrendsnot observedin other studies,thus indicating special require-mentsfortheanalysisofeachvariable.
Conflicts
of
interest
Theauthorsdeclarenoconflictsofinterest.
References
1.Brasil. Ministério da Saúde. Instituto Nacional de Câncer (INCA) ---- Estimativa 2014: Incidência de Câncer no Brasil. Rio de Janeiro: Ministério da Saúde. [cited Mar 2014]. Available from: http://www.inca.gov.br/estimativa/2014/ estimativa-24042014.pdf
2.Steliarova-FoucherE,Stiler C,LacourB, Kaatsch P. Interna-tionalclassificationofchildhoodcancer,thirdedition.Cancer. 2005;103:1457---67.
3.SmithMA,GloecklerRiesLA,GurrneyJG,RossJA. Leukemia SEER pediatric monograph., 1999. Bethesda, Md: National Cancer Institute; 1999 [cited Dec 2013]. Available from: http://www.seer.cancer.gov/archive/publications/childhood/ childhood-monograph.pdf
4.Brasil.MinistériodaSaúde.InstitutoNacionaldeCâncer(INCA) --- Câncernacrianc¸aenoadolescentenoBrasil.RiodeJaneiro: Ministério da Saúde. [cited 23 June 2012]. Available from: http://www1.inca.gov.br/tumoresinfantis/
5.Suic¸a.WorldHealthOrganization(WHO).Classificac¸ão interna-cionaldedoenc¸as.[UnitedNations.[citedSept2011].Available from:http://www.who.int/en/
6.ParkinDM,KramárovaE,DraperGJ,MasuyerE,Michaellis J, NegliaJ,etal.Internationalincidenceofcancer,II.Lyon:IARC ScientificPublicationsNo.144;1998.
7.RouquayrolMZ,AlmeidaFilhoN.Epidemiologia&saúde.6thed.
RiodeJaneiro:MEDSI;2003.
8.BoniolM,HeanueM.Age-standardisationanddenominators.In: JensenOM,ParkinDM,MacLennanR,MuirCS,SkeetRG,editors. Cancerincidence infivecontinents,IX. Lyon:IARC;2007. p. 126---58.
9.Germany.TheInformationSystemoftheFederalHealth Mon-itoring. Definition: standard populations. [cited Nov 2012]. Availablefrom:http://www.gbe-bund.de
10.BoyleP,ParkinDM.Statisticalmethodsforregistries.In:Jensen OM,ParkinDM,MacLennanR,MuirCS,SkeetRG,editors. Can-cerregistration:principlesandmethods.Lyon:IARC;1991.p. 126---58.
11.GujaratiD.EconometriaBásica.RiodeJaneiro:Elsevier;2006. 12.FonsecaLA,ElufNetoJ,WunschFilhoV.Tendênciasda mortal-idadeporcâncernascapitaisdosEstadosdoBrasil,1980-2004. RevAssocMedBras.2010;56:309---12.
13.EsteveJ,BenhamouE,RaymondL.Statisticalmethodsincancer researchVolIV-descriptiveepidemiology.Lyon(France):IARC ScientificPublications;1994.
14.FerreiraJMO.Incidência,mortalidadeesobrevidadeleucemia elinfomanomunicípiodeFortalezaCeará.[dissertation].Rio deJaneiro:InstitutoOswaldoCruz;2010.
15.CuradoMP,PontesT,Guerra-YiME,CancelaMC.Leukemia mor-talitytrends among children, adolescents, and young adults in Latin America. Rev Panam Salud Publica. 2011;29:96---102.
16.IbagyA,SilvaDB,SeibenJ,WinneshofferAP,CostaTE, Dacore-giodJS,etal.Leucemialinfoblásticaagudaemlactentes:20 anosdeexperiência.JPediatr(RioJ).2013;89:64---9.
17.GuptaS,BonillaM,FuentesSL,CanizaM,HowardSC,BarrR, etal. Incidence and predictorsof treatment-related mortal-ityinpaediatricacuteleukaemiainElSalvador.BrJCancer. 2009;100:1026---31.
18.JorgeMH,Gotlieb SL, LaurentiR. Osistemadeinformac¸ões sobremortalidade:problemasepropostasparaoseu enfrenta-mento I - mortes por causas naturais. Rev Bras Epidemiol. 2002;5:197---211.
19.FermanS,SantosMO,FerreiraJM,ReisRS,OliveiraJF, Pombo-de-Oliveira MS, et al. Childhood cancer mortality trends in Brazil,1979-2008.Clinics.2013;68:219---24.