THIS REPORT WAS PREPARED BY TOBIAS RABENSTEIN, A MASTERS IN FINANCE STUDENT OF THE NOVA SCHOOL OF BUSINESS AND
ECONOMICS, EXCLUSIVELY FOR ACADEMIC PURPOSES.THIS REPORT WAS SUPERVISED BY ROSÁRIO ANDRÉ WHO REVIEWED THE VALUATION METHODOLOGY AND THE FINANCIAL MODEL.(SEE DISCLOSURES AND DISCLAIMERS AT END OF DOCUMENT)
See more information at WWW.NOVASBE.PT Page 1/38
%
MASTERS IN FINANCE
E
QUITY
R
ESEARCH
We initiate coverage of Verbund with a Sell rating and a YE13 target price of EUR 14.50. The stock currently trades at a P/E ratio of 17.2x – a 54% premium to the utilities sector. We see this as only partially justified given Verbund’s strong asset mix focused on long-life hydro plants and expect a downside correction in the medium-term due to low power prices in Central Europe. Key value driver: Verbund generates approx. 85% of its electricity from fixed cost based hydro plants. This makes its margins highly dependent on the power price level in Central Europe where prices have been falling by 13% this year. In our opinion the market has not yet fully priced in the downside potential from lower power prices which we forecast to drive down EBITDA by 27% over the next two years.
Leverage: Stretched debt metrics with net debt / EBITDA
forecasted at 4.1x in 2014E offer limited balance sheet flexibility for Verbund. In addition, a difficult environment for Verbund’s gas power stations in Austria / France and at its associate Sorgenia in Italy put further downward pressure on the company’s financials. Valuation: Our YE13 target price is based on a sum-of-the-parts valuation. We use a discounted cash flow analysis for
Verbund’s generation and grid segments. The company’s equity
interests are valued applying market multiples and book values for struggling associates. Our EUR 14.50 target price implies a downside of 10.5% to the current share price of EUR 16.25.
Company description
Verbund is Austria’s largest utility, operating in the generation,
transmission, trading and distribution of electricity. More than 85% of Verbund’s generation comes from hydropower plants. The company operates the Austrian high-voltage grid and holds equity interests in other foreign and domestic utility companies.
VERBUND
AG
C
OMPANY
R
EPORT
U
TILITIES
03
J
UNE2013
S
TUDENT
:
T
OBIAS
R
ABENSTEIN
[email protected]
Floating down the river
Strong asset base in a weak power market
Recommendation: SELL
Vs Previous Recommendation -
Price Target YE13: 14.50 €
Vs Previous Price Target -
Price (as of 31-May-2013) 16.25 €
Reuters: VERB.VI, Bloomberg: VER.AV
52-Week Range (EUR) 14.50-19.94
Av. Daily volume (last 3M) 227,028
Av. Daily Value (EUR mn) (last 3M) 3.75
Enterprise Value (EUR mn) 10,245
Market Cap (EUR mn) 5,604
Outstanding Shares (EUR mn) 347.4
Exp. Share Price Return (10.5%)
Exp. Dividend Yield -
Exp. Total Return (10.5%)
Source: Bloomberg, Thomson Reuters, Analyst’s estimates
Source: Bloomberg, Thomson Reuters
(Values in EUR millions) 2012A 2013E 2014E
Revenues 3,174 2,818 2,567
EBITDA 1,236 1,061 907
Net Profit 499 1,474 381
EPS (EUR) 1.12 4.16 0.87
P/E (x) 16.8 16.7 13.3
DPS (EUR) 0.60 1.00 0.43
Dividend Yield (%) 3.20 6.87 2.98
EV/EBIT (x) 12.7 13.4 17.0
EV/EBITDA (x) 9.3 9.7 11.3
Net debt 4,199 3,676 3,727
Net debt / EBITDA (x) 3.40 3.46 4.11
ROIC (%) 7.4 7.1 4.5
Source: Bloomberg, Thomson Reuters, Analyst’s estimates
10 15 20 25 30
May-12 Jul-12 Sep-12 Nov-12 Jan-13 Mar-13 May-13 Verbund
ATX (relative)
MSCI Europe (relative) 28%
26%
VERBUND AG COMPANY REPORT
PAGE 2/38
Table of Contents
INVESTMENT CASE ... 3
COMPANY OVERVIEW ... 4
SHAREHOLDER STRUCTURE ... 4
BUSINESS DESCRIPTION... 4
LEVERAGE POSITION ... 6
MARKET OVERVIEW ... 8
SUPPLY AND DEMAND ... 8
TRANSMISSION NETWORK ... 10
REGULATORY FRAMEWORK ... 11
POWER PRICES AS KEY VALUE DRIVERS ...12
FUEL PRICES ... 13
CO2PRICES ... 14
CLEAN DARK SPREAD ... 16
POWER PRICE FORECAST ... 16
SEGMENTAL FORECASTS ...17
ELECTRICITY ... 17
GRID ... 19
EQUITY INTERESTS &SERVICES ... 20
STRATEGIC OUTLOOK... 22
SWOTANALYSIS ... 23
VALUATION ...23
WACC ... 24
ELECTRICITY &GRID ... 25
EQUITY INTERESTS ... 26
SCENARIO ANALYSIS ... 26
SUM-OF-THE-PARTS VALUATION ... 28
SENSITIVITY ANALYSIS ... 29
APPENDIX ...30
APPENDIX 1:TRANSACTION SUMMARY AND PROJECT PIPELINE ... 30
APPENDIX 2:OVERVIEW ASSET SWAP WITH E.ON ... 31
APPENDIX 3:MERIT ORDER SYSTEM ... 32
APPENDIX 4:MARKET OVERVIEW GERMANY ... 33
APPENDIX 5:VALUATION BENCHMARKING ... 34
APPENDIX 6:WACCCOMPUTATION ... 35
FINANCIAL STATEMENTS ...36
VERBUND AG COMPANY REPORT
PAGE 3/38
Investment Case
1. Verbund is Austria’s largest utility with an annual electricity output of approx.
70 TWh. The company furthermore operates 95% of the Austrian high-voltage grid network and holds several domestic and foreign equity interests in energy companies. From Verbund’s current capacity of 10 GW approx. 70% are installed in run-of-river and storage hydropower plants.
2. Power prices in Central Europe have recently been driven down by falling CO2 (-42% yoy) and coal prices (-11% yoy) to a level of around EUR 40 per MWh vs. EUR 50 per MWh a year ago. Since hydro plants operate on a fixed-cost basis, lower realized prices in the market almost directly affect operating margins. We do not anticipate power prices to recover and expect an achievable price of EUR 45 per MWh in the long run which triggers downside pressure for Verbund.
3. Verbund owns three gas power plants with a capacity of 1.7 GW (approx.16% of total) and is further exposed to the gas market via its associate Sorgenia in Italy. Low power price levels and long-term oil-linked supply contracts for gas leave spreads / gross margins for those plants negative (we estimate a current negative EUR 18 per MWh). We forecast this environment to persist in the near future and expect continuing loss contributions from Verbund’s gas power plants.
4. We see three stock catalysts that would be supportive for Verbund: (i) rising wholesale power prices for instance through CO2 backing measures would result in higher margins for Verbund; (ii) the renegotiation of supply contracts for gas plants could improve the operating environment of the power stations; (iii) higher water levels would boost generation and financial performance of the company.
5. Verbund currently trades above its long-term average premium versus
European utility peers both in terms of EV/EBITDA (premium of 41%) and P/E (54%). We see this premium as only partially justified due to Verbund’s asset mix focused on hydro power plants that require low maintenance expenditures over a long lifespan when compared to other technologies. However, we expect a downward correction in the medium term due to an environment of low wholesale prices for electricity.
7. We initiate coverage on Verbund with a Sell recommendation and a
sum-of-the-parts derived target price of EUR 14.50, representing a downside of 10.5% on the current share price. Verbund’s investment case is conjoined with the development of power prices in Central Europe that we expect to remain on low levels in the future.
A difficult market for gas plants triggers losses at Verbund’s own plants and those of associated firms
We see Verbund’s current premium over the sector as unjustified and expect a correction in the medium term
We initiate coverage with a Sell recommendation and a target price of EUR 14.50
Verbund is an integrated electric utility generating approx. 70 TWh a year
VERBUND AG COMPANY REPORT
PAGE 4/38
Company Overview
Verbund AG is Austria’s largest utility with its operational focus on the generation of electricity via hydropower. The company has been listed on the Vienna Stock Exchange (Wiener Börse) since 1988 and is member of the country’s leading index, the Austrian Traded Index (ATX). The ATX is composed of 20 local stocks and Verbund currently constitutes approx. 3.0% of it.
Shareholder Structure
With the 2nd Nationalization act of 1947, Verbund was founded in order to rebuild the Austrian electricity system. In 1987 the act was amended so that Verbund could be partially privatized under the condition that the government would hold at least 51% of the shares. Since constitutional law still requires the majority ownership of the state in local utilities, the Austrian government holds 51% in Verbund. A syndicate of the local utilities EVN AG and Wiener Stadtwerke AG owns another 25% with Tiroler Wasserkraft AG (TIWAG AG) holding a 5% share.1 The remaining 19% are free float. A further legal requirement regarding
Verbund’s shareholders follows the Foreign Trade Act (amended in 2011): the
ownership of infrastructure companies by non-Europeans is limited to 25% and would need consent from the Ministry of Economy, Family, and Youth (BMFWJ) if it passes that limit.
Business Description
Verbund has a vertically integrated business structure and is active in all areas of the electricity sector from generation to (unbundled) transmission, distribution
and trading. The company’s operations are split in three segments: the
Electricity segment covers the generation business which is mainly based in Austria and the Southern German state of Bavaria. Most of the company’s generation comes from hydropower (85% of electricity output in 2012).
1 The shareholders of EVN AG are: 51% State of Lower Austria, 32.5% EnBW AG, 16.5% Free float; Wiener Stadtwerke
AG is 100% owned by the city of Vienna, TIWAG AG 100% by the state of Tyrol. 10.4
2.2 2.1 2.0 1.0 1.0 Verbund AG
TIWAG AG Wien Energie AG EVN AG KELAG AG Energie AG
51% 25%
5% 19%
Republic of Austria
Syndicate EVN AG and Wiener Stadtwerke AG TIWAG AG
Free Float
97.5% 5.7% (3.2%)
Electricity Grid
Equity Interests & Others
EUR 1.2 bn
54% 40%
4% 2%
Austria
Germany
France
Other countries
EUR 3.2 bn
Figure 3: EBITDA split by business segment (2012A) Figure 4: Sales split by region (2012A) Verbund is Austria’s
largest utility...
...with 85% of the generation coming from hydropower
Source: Company data, Analyst’s estimates Source: Company data, Analyst’s estimates
Source: Company data
Figure 2: Austrian utilities by installed capacity (in GW; 2012A) Figure 1: Shareholder structure
VERBUND AG COMPANY REPORT
PAGE 5/38 Besides generation, Verbund, over its unbundled transmission subsidiary Austrian Power Grid AG (APG), operates the Austrian high voltage grid in its
Grid segment. This is complemented by several equity interests in Austrian and
foreign electric utilities that are bundled in the Equity Interests & Others
segment. Those two areas only contribute marginally to the value of the firm as indicated in Figure 3. We will discuss all segments in more detail later on.
At the end of 2012, 85% of Verbund’s electricity was generated from hydropower while 71% of its capacity was utilized in hydro plants. This gives Verbund a unique positioning among its European peers with Finland’s Fortum only coming in second with a 47% hydro share in total capacity. The influence of this specialization on the company’s profitability will be analyzed in the chapter
‘Power Prices as Key Value Driver’.
More than 80% of Verbund’s installed capacity is located in Austria, with France and Germany being the second largest markets both representing approx. 8% of the total. In addition to the capacity illustrated in Figure 5, Sorgenia SpA in Italy, in which Verbund holds 44.9%, has approx. 5.1 GW installed (see further information on Sorgenia in the chapter ‘Equity Interests & Services’).
The average load factor for Verbund’s hydro plants was 47% in 2012, driven by
above average hydro conditions.2 Going forward, we expect this value to normalize to around 43%. In contrast, wind load factors were low at 16% (our future expectations: 20%). The load factors at thermal plants (of which 70% are gas power stations) were 18%. Here it is importatant to distinguish between technical and market-driven load factors: hydro load factors are determined by
2 Load factor:
.
71%
47% 43%
34% 31%
21% 16% 15%
13% 12% 8% 6%
0% 20% 40% 60% 80% 100%
Verbund Fortum Alpiq Endesa Enel Iberdrola EDF EVN CEZ PGE E.ON RWE
Other
Other Renewables Oil
Lignite Nuclear Coal Gas Hydro
29.2%
19.6% 12.5%
9.7% 9.5% 0.5% 8.1%
8.0% 2.1% 0.9%
AT - Run-of-river AT - Pumped AT - Storage AT - CCGT / Gas AT - Oth. thermal AT - Wind FR - CCGT DE - Run-of-river BL / RO - Wind Other - Wind
10.4 GW
Source: Company data, Analyst’s estimates
Verbund is Europe’s utility with the highest share in hydro generation
The Grid and Equity Interests segments only constitute minor parts of the overall business
Figure 6: Capacity by region (2012A)
Source: Company data
Figure 5: Peer comparison by installed capacity (2012A)
Total Cap. (in GW)
10.4 14.7 6.4 39.4 97.8 46.0 140.0 2.0 15.9 12.9 67.7 52.0
Total Gen. (in TWh)
VERBUND AG COMPANY REPORT
PAGE 6/38 the technical settings of its generating units and prevailing hydro levels – they usually range from 40% to 50%.3 This compares with CCGT4 plants where the load factors of Central European plants are currently driven by the market, i.e. dependent on electricity demand and available capacities. The 20% load factor that management guides for 2013E in Verbund’s CCGTs is below the technically possible 60%-70% level since gas plants currently are “out of the market”; they often run loss-making and are only revved up to burn gas from fixed supply contracts (see more details in the chapters ‘Electricity’and ‘Power Prices as Key Value Driver’).
Leverage Position
Verbund is currently rated A-/stable by S&P and A3/negative by Moody’s. Moody’s downgraded the company in April 2013 by one notch following concerns
about the difficult European energy market and its influence on Verbund’s
financial position.
The historical rating development of Verbund against the one of Fortum, as its main peer, is shown in Figure 8 – both companies show similar debt ratios and are rated equally by the big three rating agencies. In its strategic program
Verbund’s management tragets to to stay within the A-rating category in both
Standard & Poor’s and Moody’s ratings. This is interpreted as the “Upper
Medium”-grade for both agencies, meaning that low credit risk is expected. In
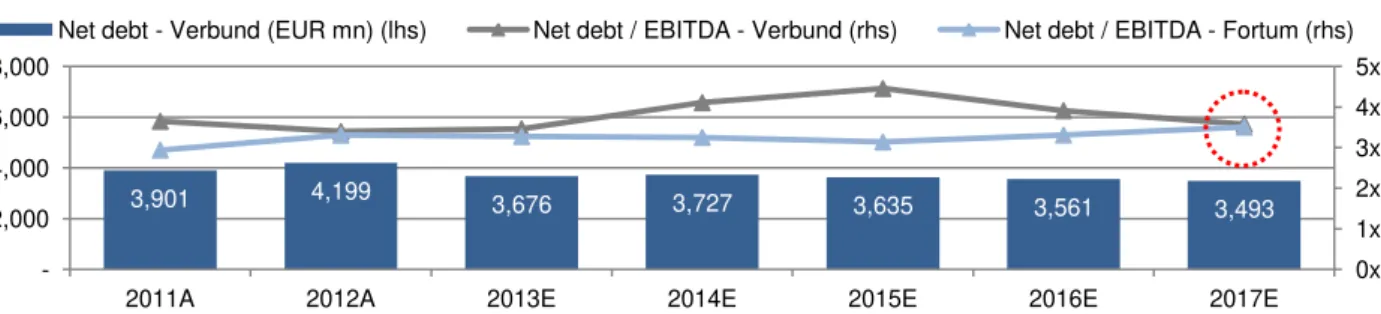
contrast, a downgrade to the BBB+/Baa1 category would already imply speculative characteristics and that the company would be subject to moderate credit risk.5 As Figure 9 illustrates, Verbund’s net debt to EBITDA ratio for FY12 stood at 3.4x and according to our estimates, should increase to 3.6x by 2017E. When compared to Fortum, we see that the Finnish company shows more capital discipline, especially over the coming few years.
3 Source: RWE Fact Book Renewable Energy March 2013, EIA
– Electric Power Annual 2009.
4 Combined Cycle Gas Turbine (CCGT) power plants produce electricity in two processes: (i) by burning natural gas; (ii)
by using heat from waste gases to drive steam turbines; the plants can so reach efficiency grades of around 60%. Source: Franco, Alessandro. 2011. Analysis of small size combined cycle plants based on the use of supercritical HRSG. Applied Thermal Engineering 31 (5): 785-794.
5Source: Moody’s.
3,901 4,199 3,676 3,727 3,635 3,561 3,493
0x 1x 2x 3x 4x 5x
- 2,000 4,000 6,000 8,000
2011A 2012A 2013E 2014E 2015E 2016E 2017E
Net debt - Verbund (EUR mn) (lhs) Net debt / EBITDA - Verbund (rhs) Net debt / EBITDA - Fortum (rhs) 86%
70% 65% 60% 40% 35% 25%
92% 80% 75% 70% 50% 40% 30%
Nuclear Biomass Coal CCGT Hydro Wind Offsh. Wind Onsh.
2002A 2005A 2008A 2011A Verbund - S&P Verbund - Moody's Fortum - S&P Fortum - Fitch
Figure 9: Net debt evolution vs. Fortum as main peer The company was recently
downgraded due to weak credit metrics
Source: Company data, Bloomberg consensus, Analyst’s estimates Note: Fortum is rated A-/negative by both Standard & Poor’s and Fitch.
Source: Bloomberg
Figure 8: Rating over time Verbund vs. Fortum
Moody’s
S&P / Fitch
Aa3
A1
A2
A3
Baa1
Baa2
AA-A+
A
A-BBB+
BBB
Figure 7: Av. technical load factors
VERBUND AG COMPANY REPORT
PAGE 7/38 However, the focus of credit rating agencies is rather on debt servicing ratios: in order to keep the current rating, Verbund should have an operating cash flow (OCF) interest coverage of 4.0x-6.0x, an OCF to net debt ratio of 20%-30%, and a retained cash flow (RCF) to net debt ratio from 15%-25%.6 However, as Table 1 shows we see Verbund’s credit metrics not significantly improving and actually worsening over the short term thus confirming the negative outlook that Moody’s put on the firm.
The company’s current high leverage results from a national and international expansion strategy that Verbund pursued over recent years. The starting point was the EUR 1.4 bn acquisition of 13 run-of-river power plants from E.ON (312 MW capacity or EUR 4.5 mn per MW with an av. load factor of 66%) in 2009. In the same year, the company’s net debt position increased by almost 50% and net debt / EBITDA jumped to 3.3x (from 2.1x a year earlier). In response, in 2010, Verbund raised EUR 1 bn in an equity offering which was supported by the Austrian government. Today, as the Austrian economy is recovering from the sovereign debt cirsis, we see the probability of the government as main shareholder backing another equity issuance as being very low. Therefore, in our opinion, Verbund will need to continue deleveraging by disposing non-core assets and / or reducing capital expenditures to improve its credit metrics.
Deleveraging via disposals was already attempted by Verbund over the course of 2012 with the most important action being the exit of its investment in Turkey’s Enerjisa which explains its improved metrics at YE12.7 In addition, following the exit of Turkey, management recently announced an approx. 30% cut in its growth capex program for the period up to 2017. The disposal program and rationale behind it will be explained in detail in the chapter ‘Equity Interests & Services’. As shown in Figure 11, Verbund’s liquidity position requires the refinancing of a EUR 500 mn bond in 2014. Despite the unfavorable leverage position, we do not see difficulties given that the company has accesss to a undrawn EUR 750 mn revolving credit line. The 51% ownership of the Austrian state, which is rated AA+/negative, should also be advantageous for this.
6 RCF measures recurring cash flow after dividends but before changes in working capital, capex or other investing or
financing activities; it thus incorporates the “need to service dividends in all but extreme circumstances” (Source: Moody’s) and factors in the company’s target to maximize shareholder value.
7
A full summary of Verbund’s recent transaction activities is given in Appendix 1, with a detailed description of the asset swap transaction with E.ON following in Appendix 2.
500 561 750
73
840
200
2013E 2014E 2015E 2016E 2017E 2018E 2019E 2020E
2011A 2012A 2013E 2014E 2015E 2016E 2017E
OCF / Net debt 20% 24% 24% 20% 19% 21% 23%
OCF interest coverage 3.6x 5.5x 4.6x 4.5x 4.0x 4.5x 4.9x
RCF / Net debt 15% 20% 18% 11% 15% 18% 19%
A3
Moody’s S&P
A-OCF / Net debt
20%-30%
OCF interest cov.
4.0x-6.0x
RCF / Net debt
15%-25% 1
2
3
OCF / Net debt
>20% 1
Bond
Avalaible Revovler
Figure 10: Rating criteria
Figure 11: Debt maturity profile 2013-20 (EUR mn)
Verbund’s leverage increased significantly after the
purchase of 13 run-of-river plants in 2009
Source: S&P, Moody’s
Source: Company information, Bloomberg
Table 1: Forecasted credit metrics
VERBUND AG COMPANY REPORT
PAGE 8/38
Market Overview
The Austrian electricity market is characterized by a high level of public ownership (as required by law) and vertical integration. With Verbund being the largest utility in the country, serving approx. 40% of the total demand, the market is less concentrated than in other European countries (e.g. in France or Czech Republic the largest suppliers have a 87% and 73% market share, respectively).8 In total, more than 130 electricity suppliers operate within Austria.
Supply and Demand
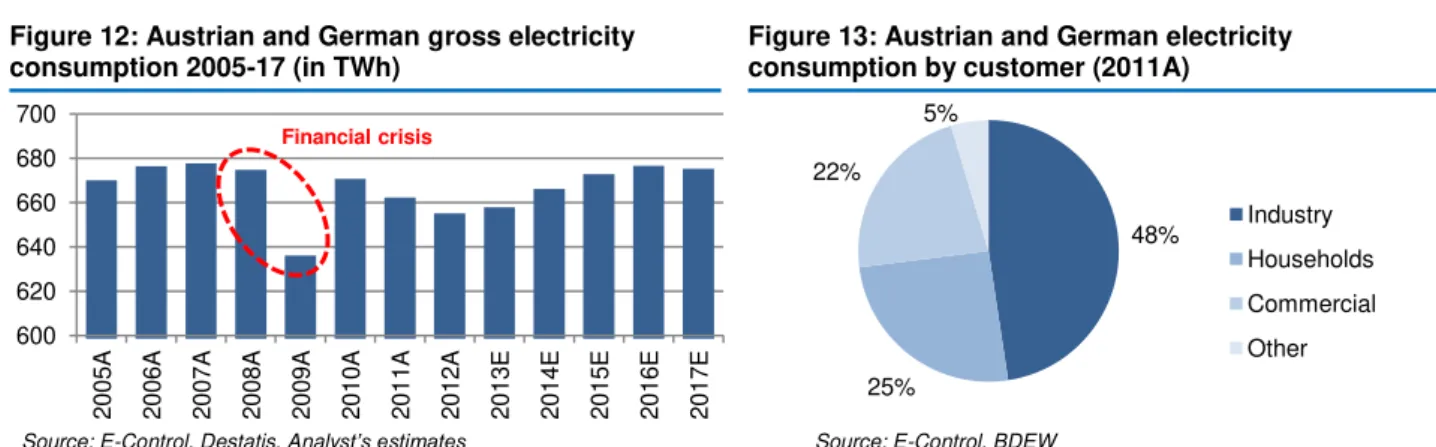
Demand. When analyzing demand relevant for Verbund, it is important not only to look at Austria but also at Germany: as the country’s largest trading partner it is responsible for 54% of electricity imports and 24% of exports. As shown before, Germany is also the second largest market for Verbund (40% of 2012A sales). Electricity consumption in the enlarged market has recovered in recent years after a drop following the financial crisis in 2009 mainly due to reduced consumption from industrial companies (-10% yoy). However, that segment - with a 48% share the largest consumer group in the market - also rebounded the strongest with a 10% increase in demand in the following year.
We expect electricity demand to increase until 2015 based on economic recovery and increased industrial activity in both countries. From 2016 onwards, we forecast decreasing demand as efficiency measures, stimulated by environmental regulation of the European Union, become effective (see chapter
“Regulatory Framework” for more details on efficiency programs). For the same
reason, we anticipate the historic relationship between electricity demand and economic growth to decouple: while we assume electricity demand to decrease by an average 0.5% p.a. up to 2020, GDP is expected to grow by an annual 1.9% in real terms.
8 Source: Eurostat.
600 620 640 660 680 700
2005A 2006A 2007A 2008A 2009A 2010A 2011A 2012A 2013E 2014E 2015E 2016E 2017E
Financial crisis
48%
25% 22%
5%
Industry Households Commercial Other
(8%) (6%) (4%) (2%) 0% 2% 4% 6% 8%
2005A 2006A 2007A 2008A 2009A 2010A 2011A 2012A 2013E 2014E 2015E 2016E 2017E
Consumption growth GDP growth Figure 14: Electr. consumption vs. real GDP growth (DE and AT)
Figure 12: Austrian and German gross electricity consumption 2005-17 (in TWh)
Figure 13: Austrian and German electricity consumption by customer (2011A)
Source: E-Control, Destatis, Analyst’s estimates Source: E-Control, BDEW
Verbund serves approx. 40% of the Austrian electricity market
VERBUND AG COMPANY REPORT
PAGE 9/38 Besides economic growth, a further driver of electricity demand is the end user price for electricity. Here, not only local prices should be taken into account, but also prices on an international level. The reason for this is that energy-heavy industries might move their production to low price countries if domestic prices for electricity are remarkably high. As Figure 15 shows, with 9 cents per kilowatt hour, prices in Austria are slightly below the EU average, especially when taking into account tax effects.9 Furthermore, prices in the country (excl. taxes) have been stable and actually decreased by 2% since 2010 while prices in the EU27 on average increased by 4% (in France they even hiked by 18%).10 We see therefore no major influence on electricity demand from that source.
Supply. On the supply side, we focus on Austria only, as the majority of
Verbund’s generation assets (>80%) are located in the Alpine state. The main
characteristic of the market is its large portion of hydropower in the total generation mix (57% in 1H12). Gas power plants, mainly in the form of CCGTs represent the second largest group with a total 18% while renewables (wind, photovoltaic, biomass) represent 8%.
When looking at the generation split over recent years, the largest increase was experienced by renewable energy with a jump from 67 GWh in 2000 to 1,985 GWh in 2011. The share of hydropower actually decreased from around 68% to 57% in the same period, mainly because of the construction of new CCGT plants and the emergence and promotion of renewable energy sources. The construction of nuclear power facilities is prohibited by law in Austria since 1978. Furthermore, the Austrian government announced a ban on the import of electricity generated by nuclear power plants that will be effective from 2015 onwards. We see this as good news for Verbund since it strengthens the
company’s local market leadership in generation and the competitive positioning
of its hydro plants in Austria.
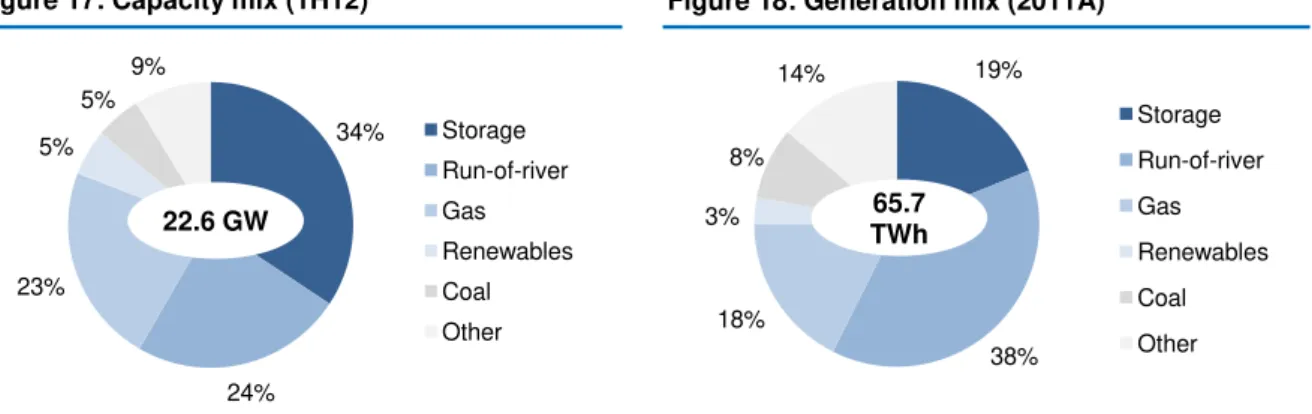
Figure 17: Capacity mix (1H12)
9 In comparison to that, electricity prices in China averaged 6-7 cents per kWh while prices for industrial consumers were
approx. 7 cents per kWh both in India and the US over 2011/12 – all excluding taxes. (Source: EIA – Key World Energy Statistics, Shenzhen Government, Government of India – Planning Commission)
10 Source: Eurostat.
34%
24% 23%
5% 5%
9%
Storage Run-of-river Gas Renewables Coal Other
22.6 GW
0.10 0.09
0.10 0.09
0.10 0.13
E
U
27
A
us
tr
ia
C
ze
ch
R
ep
.
Fr
an
ce
Ge
rm
an
y
It
aly
Tax portion Clean price
0 10 20 30 40 50 60 70 80
1995A 2000A 2001A 2002A 2003A 2004A 2005A 2006A 2007A 2008A 2009A 2010A 2011A
Run-of-river Storage Thermal Renewables
19%
38% 18%
3% 8%
14%
Storage Run-of-river Gas Renewables Coal Other
65.7 TWh Figure 15: Electricity prices for
industrial consumers (2012, in EUR/kWh)
Figure 18: Generation mix (2011A) Figure 16: Generation over time
(in TWh)
Source: E-Control, Analyst’s estimates Source: E-Control, Analyst’s estimates
VERBUND AG COMPANY REPORT
PAGE 10/38
Transmission Network
Before 2012, the Austrian transmission system was split in two control areas: the Eastern area (which covered the largest part of the country) was operated by Austrian Power Grid AG. The western state of Vorarlberg was a separated area and part of the German ENTSO-E block.11 Following a cooperation agreement between APG and Vorarlberger Übertragungsnetz GmbH, the former was named sole control area manager from 2012 on.
Since there is no congestion at the borders to Germany, the two countries pose an arbitrage-free single price zone and share a wholesale electricity market (both over-the-counter and on exchanges). In contrast, the borders to the Czech Republic, Hungary, Italy, Slovenia and Switzerland are congested and trade is limited; capacities for cross-border trade are allocated via auctions.
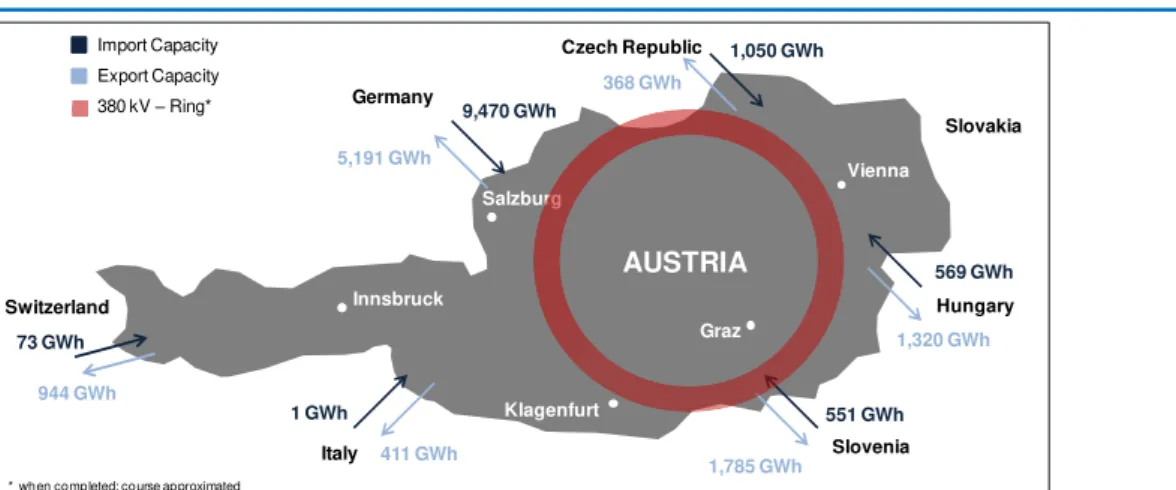
In 2011, Austria’s exports and imports amounted to 24.9 TWh and 16.7 TWh, respectively. As Figure 19 shows, while Austria historically was a net exporter of electricity, this picture changed from 2002 on. Germany accounted for 54% of imports in 2012 and Czech Republic was the second largest import source with a 40% share; the most electricity was exported to Switzerland (44%) and Germany (24%).12 Through the construction of the 380 kV line from St. Peter to the federal border to Germany – a project that will be further described in the ‘Grid’ chapter - Verbund will expand the capacity to its main trading partner. Due to Germany’s decision to phase out all of its nuclear power plants after the catastrophe in Fukushima in March 2011, the rapid expansion of offshore wind capacity in Northern Germany and the need to transport this energy to storage plants in the Alps (which work as ‘electricity batteries’), we expect trade between the two countries to expand in the future.
Figure 20: Commercial electricity imports and exports in Q4 2012
11 The European Network of Transmission Operators for Electricity (ENTSO-E) is an association representative for all
transmission system operators (TSOs) in the EU. One of its main tasks is the network planning on an EU-wide level. 12 Source: E-Control – Market Report 2012.
AUSTRIA
Vienna
Innsbruck
Graz
Klagenfurt
Germany
Czech Republic
Hungary Slovakia
Slovenia Italy
Switzerland
5,191 GWh
9,470 GWh
368 GWh
1,050 GWh
1,320 GWh 569 GWh
1,785 GWh
551 GWh
411 GWh 1 GWh
944 GWh 73 GWh
Import Capacity Export Capacity
Salzburg
380 kV –Ring*
* when completed; course approximated (10)
(5) 0 5 10 15 20 25 30
1980A 1985A 1990A 1995A 2000A 2005A 2010A
Physical exports Physical Imports Exports minus imports
Source: European Commission – Quarterly Report on European Electricity Markets, Vol.5; Analyst’s research Figure 19: Electricity Exports/
Imports (in TWh)
Source: E-Control
VERBUND AG COMPANY REPORT
PAGE 11/38
Regulatory Framework
Austria has a federal system of government. Therefore, legal responsibilities are divided between the federation and the nine federal states as set out in the constitution. While the federal legislature has the authority to enact regulations, the states can regulate electricity concerns on the basis of federal law. The Austrian energy market has been fully liberalized since October 2001 and is subject to the rules of free competition. The basis for this is the Electricity Act (ElWOG) from 1998. With the ElWOG, the European Union’s Electricity Directive for the Single European Market was implemented into Austrian law. The aim of the directive was the creation of a competitive electricity market in the EU. With the amended ElWOG 2010, Energie-Control Austria (E-Control), an institution of public law, was established as sole energy market regulator. The regulation of the grid is managed, for instance, through fixed system charges that are set based on network costs and the quantity structure of the network operator. Since 2008 an incentive-based scheme covers all grid operators with annual output >50 GWh in order to stimulate investments (through a premium on WACC for new investments). As of 2011, network regulation also provides that APG, as grid operator, is responsible for elaborating a 10-year network development plan that is approved, supervised and amended by E-Control. The third regulatory period in the country starts in 2014 and lasts for four years. In terms of environmental regulation, the so-called ‘20/20/20 goals’13 of the EU set a 34% target of renewable energy sources in Austria for 2020. Over the same time, greenhouse gas (GHG) emissions are to be reduced by 16% vs. 2005 levels. As a consequence, the Austrian government released the Energy Strategy Austria in 2010 – guidelines for the energy policy in the next 10 years. Within this context, in June 2010, Austria submitted its National Renewable Energy Action Plan (NREAP) to the European Commission under which Austria plans to stabilize its final energy consumption at 2005 levels by the year 2020 (to achieve the 34% target). To implement efficiency measures (2/3 of savings are to be realized by energy suppliers and 1/3 by businesses), the government announced in April 2013 that it will provide funds of up to EUR 300 mn by 2019 as support. We see the regulatory developments, especially regarding renewable energy sources, as positive for Verbund given the company’s market leader position and experience with the development of wind energy. Furthermore, as we will show later on, Verbund is able to profit from the regulatory incentive mechanisms to generate wealth for shareholders.
13 With the Directive 2009/28/EC, the European Union targets an overall 20% reduction in greenhouse gas emissions
below 1990 levels, a 20% share of renewables in energy consumption and a 20% increase in energy efficiency by 2020. R
E G U L A T I O N Transmission
Distribution
Trade / Supply Production
The Austrian market for electricity has been liberalized since 2001.
Figure 21: Austrian electricity market model
VERBUND AG COMPANY REPORT
PAGE 12/38
Power Prices as Key Value Drivers
As most of Verbund’s generation comes from hydro plants and this generation
form is mainly based on fixed costs, lower wholesale prices for electricity and thus lower revenues translate almost directly in EBITDA and cash margins.
We see the German pool price as key driver for Verbund given the company’s main operations in Austria and Germany and the fact that there is no congestion on the borders between the two countries. The high correlation between both the
German power price and Verbund’s stock is shown in Figure 24.
Figure 24: Verbund's stock vs. German power prices (in EUR)
The current market for electricity in Austria/Germany is a so-called “energy-only” -market, i.e. solely quantities of electricity are traded (security of supply is not subject to the market behaviour of the participating agents). Therefore, supplier and consumers trade kilowatt hours; the balance between supply and demand is taken over by the network operators. Prices in the market are built according to the merit order principle at the intercept between supply and demand. Figure 25 shows the current merit order for the German/Austrian market. A description of the pricing mechanism through the merit order scheme is given in Appendix 3. An overview of the German electricity market can be seen in Appendix 4.14
14 Our merit order analysis solely focuses on the German market given its clear dominance over the market in Austria; the
demand/supply stemming from Austria plays a negligible role in the price formation in the common price area.
20 40 60 80 100
0 20 40 60 80
May-08 May-09 May-10 May-11 May-12 May-13
Verbund (lhs) German baseload 1-year forward (rhs)
93% 88% 100% 100%
52% 79%
18% 33%
7% 12%
48% 21%
82% 67%
Wind
onsh. Wind offsh. Solar PV Hydro mass Bio- Nuclear CCGT Coal Variable cost Fixed cost
Renewables Nuclear Lignite
Coal Gas Fuel
Installed Capacity (GW)
P
o
w
e
r
p
ri
c
e
(
E
U
R
/
M
W
h
)
Base demand Peak demand Ppeak
Pbase
75 157
143
80 94 92 73
66
Wind … Wind … Solar …Hydro Bio- …Nuclear CCGT Coal
Tax Decom. Oth. fixed CO2
Fuel Fix. O&M Var. O&M Investment
Source: Bloomberg
Verbund’s stock is highly correlated to German pool power prices
Figure 23: Variable vs. fixed cost components by technology
Figure 22: Total average cost of generation technology (in EUR / MWh)
Source: EDP –DPE, EIA, Analyst’s estimates Note: Assumption CCGT working 5,000h, Coal 7,500h.
Source: EDP –DPE, EIA, Analyst’s estimates Note: Excluding taxes.
Figure 25: Merit order curve Germany
VERBUND AG COMPANY REPORT
PAGE 13/38 The wholesale price for electricity itself is composed of different layers which will be described in detail in the following subchapters. Firstly, the fuel cost of the
marginal technology in the merit order system is an important driver. For Germany, we expect coal to be the marginal technology for our forecast period.
The price for CO2 allowances constitutes the second layer. The recent fall in CO2 prices was one of the major forces behind falling power prices in Central Europe. The third and final layer is the clean dark spread, the difference between the power price and the price for coal including carbon cost.
Fuel Prices
Our previous estimations show that the price of coal is crucial for the power price in the German/Austrian market. Given that the price for ARA15 coal is set in USD, the EURUSD exchange rate plays an important role in the determination of coal prices for European companies. Since the beginning of the year, the EUR moved sideways and now stands at approx. 1.30 against the USD. For the future we expect the currency to weaken versus the USD due to ongoing economic uncertainties in the Eurozone. Our long-term fx-rate is set at 1.25, in line with market consensus, which is (c.p.) positive for coal producers since it makes commodity imports cheaper.
A key driver for the global coal price are exports from the US, whose level grew strongly with a CAGR16 >12% in the last five years (see Figure 29). The shale gas boom in the country led to higher gas extraction, lower gas prices and a switch away from coal. As a consequence the US could strongly increase its coal exports to the world markets. Furthermore, the demand from East Asian countries, in particular China where imports almost quadrupled over the last five years, is crucial. However, import growth in China slowed from an approx. 190% jump between 2008 and 2009 to 32% and 18% in the following two years. Therefore, the continuing high supply together with slower growing demand (total export five-year CAGR 3.9% vs. 2.4% for imports) caused a steep drop in coal prices since 2011. This again put pressure on power prices.
For the future, we expect coal prices to slowly recover from recent losses mainly due to an overall economic upswing and higher demand from emerging countries. For the long-term, we assume a price of USD 102.2 per tonne of coal (which translates into EUR 80.5 per tonne using our forecast of a 1.30 EURUSD exchange rate). Our full economic and commodity forecasts are given in Table 1
of the chapter ‘Power Price Forecasts’.
15 ARA is the abbreviation for Amsterdam-Rotterdam-Antwerp, the major coal importing ports in Central/Northern Europe. 16 Compounded annual growth rate.
1.10 1.20 1.30 1.40 1.50 1.60
M
ay
-08
M
ay
-09
M
ay
-10
M
ay
-11
M
ay
-12
M
ay
-13
Sideward movement in '13 0
20 40 60 80
May-11 Nov-11 May-12 Nov-12 May-13 Clean Dark Spread (residual) CO2 (0.9 t / MWh) Coal (1.86 t / MWh)
30 70 110 150 190 230
M
ay
-08
M
ay
-09
M
ay
-10
M
ay
-11
M
ay
-12
M
ay
-13
(USD/t) (EUR/t)
Figure 26: 1-year forward power price layers (in EUR / MWh)
Figure 28: Coal price development Figure 27: EURUSD exchange rate
Source: Bloomberg
Source: Bloomberg, Analyst’s estimates
Source: Bloomberg
Note: Incl. transportation and insurance cost
VERBUND AG COMPANY REPORT
PAGE 14/38 –
CO
2Prices
The price for CO2 constitutes the second largest influence factor on the Central European wholesale power price. As a consequence of coal being the marginal technology in the market, prices are higher affected by swings in CO2 prices as, for instance, in the UK where gas is the marginal technology. This is due to the CO2 intensity of coal power plants: a coal-fired plant produces approx. 0.9 tonnes of CO2 per MWh generated vs. 0.4 tonnes for gas-fired plants. Verbund profits from higher carbon prices due to its focus on hydropower, since revenues that are driven by rising power prices, increase faster than costs for fuel inputs. The EU Emission Trading Scheme (ETS) is the largest international system for trading greenhouse gas (GHG) emission allowances - it covers >11,000 plants in 31 countries. The system works on a ‘cap and trade’ basis, i.e. a cap is set on the total amount of GHG emissions that can be emitted by companies. To lower emissions, that cap is reduced over time.17 Under the cap, companies receive or buy the so-called EU allowances (EUAs) which can be traded with others states. After each year a company has to surrender enough EUAs to cover all its emissions (otherwise fines will be imposed). If a company reduces its emissions, it can keep the allowances and sell them. Each EUA counts for one tonne of CO2 produced. After the introduction of the ETS in 2005, the price for carbon licences dropped from heights of EUR 28 in mid-2008 by approx. 90% to nowadays EUR 3-4 per tonne of CO2.
17 The EU targets emissions by 2020 to be 21% below 2005 levels. 0
500 1,000 1,500 2,000 2,500
2005A 2012A
Aircraft operators Other Pulp, paper and board Pig iron or steel Mineral oil refineries Cement clinker / lime Combustion installations -8.5%
113 179 264
304 370
410 434 440
560 792
1,065
Verbund Fortum Iberdrola EDF Endesa Enel EVN E.ON CEZ RWE PGE
Indonesia: 376.0
Australia: 345.7 Russia:
152.7
South Africa: 87.1 Colombia:
98.2
USA: 119.3
Japan: 213.9
China: 212.2
South Korea: 152.3
India: 95.7
Taiwan: 81.0 Germany:
54.3
Importers (in mn mt)
Exporters (in mn mt) Last five year growth CAGR
Importers Exporters
Japan (1.5%) China 29.2% South Korea 8.0% India 7.8% Taiwan 0.3% Germany (2.6%)
Indonesia 9.7% Australia 3.1% Russia 4.3% United States 12.3% Colombia 4.4% South Africa 1.4%
Figure 31: Emissions by sector (in mt CO2 equivalent)
Figure 30: CO2 emissions vs.
peers (g/kWh; 2012A)
Source: Company data, Analyst’s research
Source: European Commission
Source: EIA, Analyst’s estimates
VERBUND AG COMPANY REPORT
PAGE 15/38 One of the main reasons behind the huge drop in prices is a current oversupply of EUAs in the market driven by several factors: firstly, there has been a high growth of renewable energy capacity in Europe promoted by subsidies that reduced electricity production from CO2-intensive power plants. Secondly, a weaker-than-expected economic outlook led to lower power consumption and generation of thermal plants (as was oppositely expected after Germany’s decision to phase out its nuclear power plants in March 2011; see price spike in Figure 32). The growth in energy demand was also abated by ongoing efficiency measures within the EU (see ‘20/20/20 targets’).
Since 2013 and until 2020, the ETS is in its 3rd phase, which is quite different from the previous two periods: allowances are now increasingly allocated via auctions and decreasingly for free. As Figure 33 shows, the excess supply of allowances accumulated over Phase II is approx. 2.0 bn tonnes and we expect this oversupply to narrow only slowly. As a consequence of this, what we see today is a CO2 price mainly driven by political decisions on carbon backing measures. An example for this was the 35% drop in prices within one day when the European Commission voted against the plan of carbon backloading on 16th
of April 2013 (at the same date, Verbund’s stock fell by approx. 7%). The plan
envisaged to reduce carbon permit auctions by 900 mt in Phase III of the ETS between 2013-15 (400 mt in 2013, 300 mt in 2014 and 200 mt in 2015) and reintroduce them again through auctions in 2019-20 to stimulate the price for EUAs. On 19th ofJune 2013, an amended version of the backloading proposal will be discussed in the Environmental Committee of the European Union. If there will be a vote in favour of backloading (we only expect this to happen with a very low probability and if at all in an alleviated version of the prior proposal) the EU Parliament might vote on it again on a meeting before its summer recess, around 3/4 of July 2013. However, an ultimate decision of the Commission, if all previous steps would be successful, is not expected before the end of this year.
Given the dependence of CO2 prices on political actions in the current environment of excess EUA supply, it is hard to forecast future price developments. In our estimates, we do not assume the CO2 price to fall to zero due to the high effort the European Union spent on introducing the trading scheme as a global prestige project. Furthermore, once the economy recovers in Europe, we expect more political support from countries that now strictly oppose the support of higher carbon prices in order to keep power prices low and reflate their local economies. In our base case, however, we take a more reserved position and forecast prices for carbon allowances to be stable at EUR 3 per tonne, at the lower end of the current trading range.
0 5 10 15 20 25 30 35 40
2008A 2009A 2010A 2011A 2012A 2013A
Fukushima
0 500 1,000 1,500 2,000 2,500 3,000
2008A 2010A 2012A 2014E 2016E 2018E 2020E
Auctions & Other (mt) Free allowances (mt) Emissions (mt)
Oversupply Phase II: ~2 bn mt
0 40 80 120 160 200 240
2000A 2002A 2004A 2006A 2008A 2010A 2012A 2014E 2016E
Photovoltaic Wind
Figure 32: CO2 price from
Apr-08 on (EUR/t)
Figure 33: ETS Suppy & Demand
Source: Bloomberg, EC, Analyst’s estimates
Figure 34: Cumulative PV and wind installations in the EU (in GW)
Source: EWEA, EPIA, EurObserv’ER
VERBUND AG COMPANY REPORT
PAGE 16/38
Clean Dark Spread
The clean dark spread is the gross profit that a coal power plant generates from selling one unit of electricity after costs for fuel (coal) and carbon (CO2 licenses) required to produce that unit. A positive clean dark spread indicates that coal plants are operating competitively and profitably. The German clean dark spread is the last layer in our power price model. Besides the cost of fuel, spreads are further determined by supply and demand for electricity in the market.
One of the main drivers behind the falling clean dark spread is the increased output from renewable energy sources, mainly from wind and photovoltaic plants. As part (2) in Appendix 3 (bullet point ) shows, increased output from renewable energy sources with low marginal costs puts pressure on the margins of coal plant operators. Figures 36-38 show the development of renewable and thermal generation output in Germany and indicate the squeezing out of conventional power plants by carbon-free sources. This is the one hand positive for Verbund since the company has the opportunity to profit from expanding its renewables portfolio and only generates approx. 16% of its electricity from thermal plants (FY12). On the other hand, the resulting lower power price reduces the company’s operating margins and affects its earnings negatively.
Power Price Forecast
Taking into account the above described developments and trends we built our commodity forecasts as summarized in Table 2.
While we expect coal prices to increase slightly by 2.3% p.a. in the coming years, we set the CO2 price fix at EUR 3 per tonne in line with its current price level and our assumptions that there will be no solution out of the carbon difficulties in the near future. Baseload pool prices, in contrast are forecasted to increase, mainly driven by the higher coal price.
0 2 4 6 8 10 12 14
Jun.11 Dec.11 Jun.12 Dec.12
250 300 350 400 450
2008A 2010A 2012A CAGR:
(4%) 20
30 40 50 60
2004A 2006A 2008A 2010A CAGR:
10%
2013E 2014E 2015E 2016E 2017E
Coal (USD/t) 84.7 91.5 97.4 98.7 102.2
CO2 (EUR / t) 3.0 3.0 3.0 3.0 3.0
Natural gas (EUR / MWh) 26.6 26.6 26.6 26.6 26.6
German baseload (EUR / MWh) 48.0 43.0 40.0 42.3 44.6
EURUSD 1.27 1.26 1.30 1.25 1.27
Inlfation (Germany) 1.9% 2.1% 2.1% 2.1% 2.1%
Inflation (Austria) 1.9% 1.9% 1.9% 1.9% 1.9%
Real GDP growth (Germany) 0.5% 1.6% 1.8% 2.1% 2.4%
Real GDP growth (Austria) 0.8% 1.5% 1.9% 2.2% 2.5%
0 5 10 15 20 25 30
2005A 2007A 2009A 2011A CAGR:
55%
Figure 36: Generation from PV plants in Germany (in TWh) Figure 35: German clean dark spread (in EUR / MWh)
Source: Company data
Table 2: Main commodity and economic forecasts (in current prices)
Source: IMF, Bloomberg, Analyst’s estimates Source: BMU (Ministry for Environment)
Source: BMU (Ministry for Environment) Figure 37: Generation from wind plants in Germany (in TWh)
Source: Eurostat
VERBUND AG COMPANY REPORT
PAGE 17/38
Segmental Forecasts
Electricity
In the ‘Electricity’ segment, Verbund bundles all operations relating to the construction, operation and maintenance of the group’s power plants as well as electricity trading and supply to consumers.
Verbund’s installed capacity in 2012 amounted to 10.4 GW (incl. power purchase
rights). Besides the majority of the plants that are located in Austria and the Southern German state of Bavaria (see Figure 6 for comparison), Verbund also owns wind parks in Bulgaria (16 MW) and Romania (99 MW, plus another 184 MW planned) and a run-of-river plant in Albania (53 MW). Since 2012 the two French CCGTs Pont-sur-Sambre and Toul (together 842 MW) had also been fully consolidated and allocated to the ‘Electricity’ segment.
In total, we expect capacity to grow by approx. 8.1% over the next five years to a total of 11.2 GW by 2017E as shown in Figure 39. At the same time our generation forecasts imply a (lower) 4.1% increase, mainly due to normalized hydro conditions (see later on in this chapter). While we expect the company’s Dürnrohr coal power plant (405 MW) to be closed in 2016, management is guiding for approx. 450 MW additions in hydro plants, 270 MW additional capacity in wind power and efficiency improvements in existing stations. An
overview of Verbund’s full project pipeline is given in Appendix 1.
At the beginning of 2012 Verbund started operations at the Mellach CCGT -
Austria’s largest power plant with a capacity of 848 MW. However, the company
had to book impairment losses of EUR 164 mn in 2011-12 (30% of capex), following a difficult market environment for gas plants. As Figure 41 shows, over recent years, oil and gas prices decoupled from their historical pricing relationship, mainly due to increased gas supply from newly explored reserves.18 Yet, supply contracts are still commonly designed on a long-term take-or-pay basis with linkage to the oil price. Given the thereby artificially high purchase prices combined with a low electricity output price in the market, CCGTs often operate loss-making. By now, Verbund managed to renegotiate some parts of its supply contracts on a short-term basis, but still has to finalize conclusive negotiations.
Apart from the dependency on the wholesale power price, the focus of Verbund on hydro generation within the ‘Electricity’ segment also brings another value
18 In the last few years, oil-linked prices for gas stopped reflecting the actual supply and demand for the resource, driven
in large part by new exploration techniques for gas - especially the discovery of shale gas reserves - that lowered the cost of production and increased global gas supply.
0 50 100 150 200 250
Jun.06 Jun.08 Jun.10 Jun.12 Crude oil front month (indexed) Natural gas front month (indexed)
6.8 7.7
0.6
0.6
0.2 0.5
2.8
2.4 10.4
11.2
2012A 2017E
Thermal
Wind / Solar
Hydro purchase rights Hydro 8.1%
27.0 28.2
3.5 3.0
0.2 0.8
4.5 4.6
35.2 36.7
2012A 2017E
Thermal
Wind / Solar Hydro purchase rights Hydro 4.1%
Figure 40: Electricity Generation 2012A-17E (in TWh)
Figure 39: Installed Capacity 2012A-17E (in GW)
Source: Company data, Analyst’s estimates
Source: Company data, Analyst’s estimates
Source: Bloomberg (Tickers: NG1, CL1) Figure 41: Oil vs. Gas price development
VERBUND AG COMPANY REPORT
PAGE 18/38 driver: hydro conditions in Southern Germany and Austria. In 2012, the hydro coefficient19 rebounded to 1.11 from a weak 2011 level of 0.89 as shown in Figure 42. For 2013, we estimate a hydro coefficient 8% above the long-term average at 1.08 driven by favourable conditions during the first quarter (hydro coefficient of 1.20). For our further forecasts we estimate the coefficient to remain stable at 1.0 to make our estimates robust to non-controllable short-term fluctuations in hydro levels.
As Figure 43 shows, we expect segment sales to decrease over the next years from the EUR 2.8 bn level in 2008. This is mainly due to lower realized power prices which we assume to be EUR 50 per MWh in 2013 (as indicated by
Verbund’s management) and EUR 43 per MWh in 2014, in line with current
forward prices. From 2015E on, we forecast a slight recovery in power prices; with a long term achievable price of EUR 45 per MWh. Table 3 summarizes our explicit forecasts for the ‘Electricity’ segment.
19 The hydro coefficient describes the actual electricity generation in one period divided by the long-term average
generation potential. The long-term average is set at 1.00. 0.8
0.9 1 1.1 1.2
2004A 2005A 2006A 2007A 2008A 2009A 2010A 2011A 2012A 2013E 2014E 2015E 2016E 2017E
2,821
2,479
2,218
2,086 2,188
2,304
40% 37%
34% 31% 33% 33%
0% 10% 20% 30% 40% 50%
1,500 2,000 2,500 3,000 3,500
2012A 2013E 2014E 2015E 2016E 2017E
Electricity sales (EUR mn) (lhs) EBITDA margin (rhs)
(in EUR mn if not stated differently) 2013E 2014E 2015E 2016E 2017E
Achieved power price (EUR) 50.0 43.0 40.0 42.3 44.6
Total electricity supply (TWh) 49,581 51,582 52,149 51,723 51,701 Revenues (from electricity sales) 2,479 2,218 2,086 2,188 2,304
Total revenues 2,600 2,345 2,214 2,307 2,425
EBITDA 921 753 643 721 769
Depreciations & Amortizations (228) (233) (236) (239) (242)
EBIT 693 520 407 482 527
Total assets 8,384 8,412 8,519 8,563 8,606
Total installed capacity 10,977 11,534 11,623 11,229 11,229
Figure 43: Electricity sales and EBITDA margin 2012A-2017E (excl. intragroup eliminations) Figure 42: Hydro coefficient
2004A-2017E
Source: Company data, Analyst’s estimates
Table 3: Electricity segment forecasts - Summary We expect segment sales to
decrease in the short- to medium term due to lower achieved power prices
Source: Analyst’s estimates
VERBUND AG COMPANY REPORT
PAGE 19/38
Grid
In the Grid segment, Verbund allocates the operations of Austrian Power Grid AG, Austria’s largest transmission system operator that controls approx. 95% of the system at the voltage levels 110, 220 and 380 kV as control area manager. APG was certified as the first Austrian independent transmission system operator (ITO) in March 2012 following the Third Single Energy Market Package of the EU. With the legislation, the EU intended to unbundle the operations from transmission operators of integrated utilities in order to prevent vertical integration in the energy market. By virtue of being certified as ITO, Verbund was able to retain ownership over the grid, while APG would operate separately from
the parent (‘legal unbundling’). In 2012, APG transported 42.1 TWh of electricity
and had a headcount of 450 employees.
In its “Master Plan” for the Austrian grid, APG defines its long-term planning for
the period up to 2020. The main focus in the next years is the completion of the 380 kV Salzburg line between Tauern and Salzburg (essential for the completion of 380 kV Austrian ring20). A total of 128 km of new lines and approx. 450 poles will be newly constructed while 256 km of old lines will be detached. Furthermore, a 380 kV connection to Germany is scheduled to be constructed in 2015-16 and the line between Dürnrohr and Vienna Southeast needs to be expanded in order to connect new renewable energy sources in the East of the country to the grid (Austria plans to triple its wind power capacity from currently 1 GW to 3 GW by 2020). For those and various smaller investments, APG estimated capital expenditures of approx. EUR 1 billion for 2013-17. We furthermore expect significant expenses in the distant future for upgrades of the existing grid to secure local energy supply with the increasingly dominant and more volatile wind and solar electricity sources.
The grid’s operating income is based on a return that the regulator defines
(WACC) on the company’s regulated asset base (RAB) which itself is computed
on adjusted book values of APG’s balance sheet.21 The tariff is reviewed each
year. For 2013E, we expect a RAB of EUR 1,150 mn with the pre-tax WACC being set at 6.42% before tax. Since the rate was suggested to be fixed for the next years, we estimate a constant return on RAB equal to the regulator’s WACC in our model. Table 3 compares the allowed return as computed by E-Control with the opportunity cost of capital as assumed in our model. As the figure
20 The Austrian high-voltage grid is arranged in a ring structure to ensure high reliability since every point on the ring is
served from two sides; please refer to Figure 20 for an illustration.
21 RAB = Intangible Assets + Tangible Assets + Leased Facilities – Construction grants – Gain from restructuring - Other corrections (Source: E-Control; for further information on the ‘Gain from restructuring’-component see Austrian Commercial Code, §202 Section 2).
Generation
ITO
Distribution / Supply
ITO is “ring-fenced” inside the enterprise
ITO takes decisions independent from utility company
Restritions on staff turnover
No common services between ITO and utility (e.g. IT, Controlling)
32 36 40 44 48
30 80 130 180 230
2008A 2009A 2010A 2011A 2012A 2013E 2014E 2015E 2016E 2017E
EBITDA (EUR mn) (lhs) Transport Volume (TWh) (rhs)
REGULATED ASSET BASE (RAB)
(x)
REGULATOR’S
(PRE-TAX) WACC
EBIT
(=)
Figure 44: ITO model
Source: BMWI, analyst’s research
Figure 46: Grid EBITDA vs. Transport Volume
Source: Analyst’s estimates
Figure 45: Computation of allowed return
VERBUND AG COMPANY REPORT
PAGE 20/38 indicates, we forecast the ‘Grid’ segment to be value supportive in the future. We will scrutinize the composition of our cost of capital computation in the Chapter ‘WACC’.
With the computation of the RAB as described above, our estimated segmental EBIT for 2013 stands at EUR 74 mn. The strong increase in RAB and consequently in EBIT is due to the management’s guidance of investing the above mentioned EUR 1,000 mn over the next five years.
Equity Interests & Services
Within the ‘Equity Interests & Services’ segment, Verbund bundles the management and control functions of its domestic and foreign equity interests. Furthermore, subsidiaries that provide corporate functions (e.g. financing, telecommunications) are part of this area. In 2012, the segment generated an overall loss of EUR 80.3 mn (2011: EUR -176.5 mn).
During the last year, Verbund sold most of its non-core equity stakes that it had accumulated on its balance sheet. The divestments, as shown in Figure 47, generated an overall cash inflow of approx. EUR 370 mn.
The most important change in this segment was the already mentioned asset swap with E.ON that was closed in April 2013: under the agreement Verbund received the ownership in eight run-of-river plants with a total capacity of approx.
680 MW. In addition, E.ON’s 50% share in three hydropower projects was
acquired by Verbund. Finally, E.ON reduced its drawing rights from the Zemm-Ziller power plant by 60% (equivalent to 237 GWh p.a.). In return, E.ON acquired
Verbund’s 50% share in the Turkish Enerjisa (total capacity of 830 MW).
(in EUR mn if not stated differently) 2012A 2013E 2014E 2015E 2016E 2017E
Revenues 550 472 476 480 483 486
Operating expenses (446) (333) (323) (308) (294) (279)
EBITDA 104 140 154 172 190 206
Depreciation & Amortization (66) (66) (72) (80) (87) (94)
EBIT 38 74 82 92 102 112
Capital expenditures (138) (374) (246) (255) (262) (269) Capex / D&A 2.1x 5.7x 3.4x 3.2x 3.0x 2.9x Regulated Asset Base (RAB) 914 1,150 1,278 1,440 1,596 1,750 Invested Capital (IC) 727 909 1,050 1,152 1,266 1,365 EBIT as % of RAB 4.2% 6.4% 6.4% 6.4% 6.4% 6.4% EBIT as % of IC 5.3% 8.1% 7.8% 8.0% 8.1% 8.2%
11 16.5
70 270
Kärtner Restmülversor-
gung GmbH …
Gletscher- bahnen Kaprun AG
(45.0%) Energie Klagenfurt GmbH (49%)
Steweag Steg GmbH
(34.6%) Utility
Utility
Glacier cable cars
Waste Incineration
Sector
Risk-free rate
Debt risk premium
Cost of debt
Market risk premium
Beta (unlevered)
Beta (levered)
Cost of equity
(after-tax) Gearing Tax
WACC (pre-tax)
WACC (after-tax)
E-Control 3.27% 1.45% 4.72% 5.00% 0.33 0.69 6.72% 60% 25% 6.42% 4.81%
Analyst's estimates 2.10% 1.02% 3.12% 5.50% 0.24 0.44 5.18% 114% 25% 4.89% 3.66%
Table 5: Grid segment forecasts - Summary Source: E-Control; Analyst’s estimates
Source: Company data; Analyst’s estimates Table 4: WACC computation E-Control vs. Analyst's estimates
Figure 47: Cash inflows from recent asset sales (in EUR mn)
VERBUND AG COMPANY REPORT
PAGE 21/38 Consequently, the company swapped growth opportunities in an emerging market against value assets in its core markets. We see the exit from the Turkish market, which was established in 2007 in a JV with the Turkish industry conglomerate Sabanci, as a good move: the business plan of Enerjisa would have required high capital expenditures in order to achieve the JV’s target to install a total capacity of 5,000 MW by 2015 that Verbund cannot afford at its current debt levels. Furthermore we see Verbund’s expertise and know-how clearly in the field of hydro energy.
By now, the domestic equity interests remaining are Österreichisch-Bayerische Kraftwerke AG (50%), Donaukraftwerk Jochenstein AG (50%), Ennskraftwerke AG (50%) and KELAG-Kärntner Elektrizitäts-AG (35.2%). The latter is by far the
largest of Verbund’s local participations: KELAG is an Austrian utility that
generated revenues of EUR 1.6 bn in 2011. In terms of interests paid to Verbund, KELAG delivered stable income of EUR 33.0 mn and EUR 33.5 mn in 2010 and 2011, respectively. We expect this contribution to remain constant around EUR 35.0 mn for the future, in line with management guidance.
After the full-consolidation of the CCGTs Toul and Pont-sur-Sambre in France and the completion of the Ashta run-of-river plant in Bulgaria, the last remaining foreign interest on Verbund’s balance sheet is the 44.9% stake in Italy’s Sorgenia SpA that was established in 1999 in cooperation with the Italian industrial holding CIR. Sorgenia is a utility with approx. 5 GW installed capacity, of which 95% are CCGTs. The company struggles with a currently difficult market environment for gas power stations and long-term gas supply contracts that are linked to the oil price. The company contributed EUR -81.2 mn in 2012 and EUR -3.3 mn to
Verbund’s earnings from equity interests. In the presentation of its FY12 results,
Verbund management described the investment in Sorgenia as non-core and that it would not inject further equity in the company. Sorgenia is currently going through a restructuring process (FY12 net debt / EBITDA 18x) in which Verbund, however, indicated to have no influence as minority shareholder.
The results from the different equity stakes enter Verbund’s balance sheet as a caption below the EBIT level as ‘Income from Equity Interests’ while revenues from subsidiaries that provide corporate functions are accounted regularly. Since, however, there is insufficient data provided by the company for the latter supporting subsidiaries, for valuation purposes we merged the revenues from this segment with the ‘Electricity’ segment and thus valued both areas in one approach. We see this as reasonable given a similar risk profile due to the dependency of the subsidiaries on operations from the generation units.
Sorgenia Holding
Manage-ment 16.9%
80.0% 1.9% 1.2%
35.0% 65.0%
Free float 35.2%
51.0%
1.0% 51.0% 49.0%
12.9%
Figure 48: Verbund and KELAG
Figure 49: Verbund in Italy
Source: Company data Source: Company data