• Nenhum resultado encontrado

E CONOMICS, EXCLUSIVELY FOR ACADEMIC PURPOSES.T HIS REPORT WAS SUPERVISED BYR OSÁRIOA NDRÉ WHO REVIEWED THE

N/A
N/A
Protected

Academic year: 2019

Share "E CONOMICS, EXCLUSIVELY FOR ACADEMIC PURPOSES.T HIS REPORT WAS SUPERVISED BYR OSÁRIOA NDRÉ WHO REVIEWED THE"

Copied!
32
0
0

Texto

(1)

THIS REPORT WAS PREPARED BY “STUDENTS NAME”, A MASTERS IN FINANCE STUDENT OF THE NOVA SCHOOL OF BUSINESS AND

ECONOMICS, EXCLUSIVELY FOR ACADEMIC PURPOSES.THIS REPORT WAS SUPERVISED BY ROSÁRIO ANDRÉ WHO REVIEWED THE VALUATION METHODOLOGY AND THE FINANCIAL MODEL. (SEE DISCLOSURES AND DISCLAIMERS AT END OF DOCUMENT)

See more information at WWW.NOVASBE.PT Page 1/32

M

ASTERS IN

F

INANCE

E

QUITY

R

ESEARCH

 The Spanish banking sector saw in the last years a quick accumulation of foreclosed assets and profits quickly fell with the international financial crisis and the real estate bubble burst. This made banks susceptible to developments in the market due to high exposures to the real estate sector, meanly through loans. ROEs has been falling below opportunities cost of capital driven by

deteriorations of the banks’ financial statements.

The acquisition of Banco de Sabadell, .S.A. (SAB) of TSB Banking Group PLC (TSB) on 2015 was financed on a capital neutral basis.

SAB’s current CET 1 ratio is 11.6% and the deal funded with €0.9

billion cash and €1.5 billion shares implied a capital neutral transaction. Synergies were one of the drivers of the acquisition. We expect SAB to substantially change TSB’s cost base

potentially leading to higher earnings from TSB, expecting for FY2016e synergies of €245 million.

 The Discounted cash flow to equity model was performed to value both, SAB prior the acquisition and TSB. The target value for the FY2016e resulted from the Sum of the parts valuation. The

target price of €2.3 per share implies an upside of 39% to the

current share price of €1.6, and our recommendation is to buy.

Company description

Banco de Sabadell, SA is Spain’s fifth largest banking group and it is structured in five areas, Commercial Banking (largest Group’s

business lines); Corporate Banking and Global Operations; Markets and Private Banking; BS America; and Bancassurance; as well as Other Businesses. Its shares are currently listed on three stock exchanges located in Madrid, Barcelona, Bilbao and

Valencia (the “Spanish stock exchanges”) and are traded on the

Sistema de Interconexión Español (SIBE), the automated quotation system of the Spanish stock exchange.

B

ANCO DE

S

ABADELL

,

S.A.

C

OMPANY

R

EPORT

B

ANKING SECTOR

08

J

ANUARY

2016

S

TUDENT

:

N

ARYARA

N

ARANJO

B

UJARDÓN

naryara.bujardon.2014@novasbe.pt

Looking back to look ahead?

Only future matters.

Recommendation: BUY

Price Target FY16: 2.3 €

Price (as of 8-Jan-16) 1.6 €

Reuters: SAB.MC, Bloomberg: SAB SM

52-week range (€) 1.54-2.42

Market Cap (€m) 8,888

Outstanding Shares (m) 5,439

Source: Bloomberg

Source: Bloomberg

(Values in € millions) 2014 2015F 2016F Net Interest Income 2,260 3,833 4,224 Gross Income 4,801 6,417 6,211

Net Income 372 884 726

Cost/Income 43% 49% 46%

Return on Equity 3% 7% 6%

Return on Assets 0.2% 0.5% 0.4%

NPLs ratio 12.3% 9.6% 9.8%

Risk-Weighted Assets 74,418 107,025 107,260 CET 1 Ratio 11.7% 11.6% 12.5%

(2)

BANCO DE SABADELL,S.A. COMPANY REPORT

PAGE 2/32

Table of Contents

Executive summary

3

Company overview

4

History

Business Strategy

Shareholders structure

5

5

5

The Sector

6

European Banking Sector

6

Spanish Banking Sector

9

Funding Structure

10

Cost of Funds

12

Profitability

13

Regulatory Capital

15

Basel II

15

Basel III

15

Stress tests

17

Valuation

19

Sabadell’

s Valuation

19

Sensitivity Analysis

24

TSB’s Valuation

26

Sum of the Parts Valuation

28

(3)

BANCO DE SABADELL,S.A. COMPANY REPORT

PAGE 3/32

Executive summary

Based on nominal GDP statistics Spanish economy is in the 5th place among the

largest economies in the European Union (EU) and the 4th largest in the

Eurozone. However, any country escaped from the International Financial Crisis of 2007-2008, the economy contracted by 1.4% in 2012 and remained in recession until the 3Q of 2013. Situation for banks became challenging with the crisis; high reduction in assets, declines in the mean sources of fund and large increases in equity (driven also due tighten regulatory requirements).

But despite of that Spain has started to show improvements in the overall economy, its nominal GDP growth rate has started to reach positive figures since the 1Q of 2014 and unemployment has begun to decline. Moreover, Standard &

Poor’s upgraded its credit rating for Spanish public debt to BBB+ with a stable

outlook.

Under this context SAB has been able to increase in terms of scale in recent years inside and outside Spain. With the latest acquisition of the bank TSB in the UK, expectable growing cash flows has been forecasted from 2016 onwards and cost savings. TSB entered to compete in a stable economy where the unemployment rate of the active population has fallen to 5.4% and wages have increased by nearly 3% YoY. Moreover great expectations regarding an increase of the interest rates sooner than in the Eurozone are arising, especially after the latest decision of the U.S Federal Reserve (Fed) to increase the interest rates by 0.25% and assured a gradual pace of increases.

SAB’s Net interest income remains resilient primarily benefit from the continued reduction in both wholesale and retail funding costs, offsetting the negative impacts of lower Euribor levels and pressure on loan yields, our forecasts resulted in an increase by 3% YoY of NII from FY2016e until FY2019e.

Trading revenues remained a key driver during the last years allowing to increase significantly the level of NPL provisioning and improving asset quality with NPL ratio falling to 9.6% (FY2015e). Moreover, we see SAB with a solid capital position with a CET 1 ratio of 11.6% for FY2015e and reaching a 12.5% CET 1 in FY2016e.

Our target price for December 2016 of €2.3 per share was obtained through the

Sum of the parts valuation, which implies an upside of 39% over the current price

(4)

BANCO DE SABADELL,S.A. COMPANY REPORT

PAGE 4/32

Company overview

Banco de Sabadell, S.A. was established in 1881 in Sabadell, it is Spain’s fifth

largest banking group by total assets (Chart 1), and holds an important position in the personal and business banking market.

The bank is the parent company of a corporate group and both together compose the Banco Sabadell Group (The Group). The group is organized into 5 business units; Commercial banking, Corporate Banking and Global Businesses, Markets and Private Banking, Asset transformation and Sabadell America.

Commercial Banking (largest group’s business lines) which the core

function is to provide financial products and services to large and medium-sized business, SMEs, retailers and sole proprietors, professional groupings, entrepreneurs and personal customers. This unit

achieved €2,210 billion as of 30.09.2015 in Gross operating income and

€498 million in Profit before tax (Chart 2).

Corporate Banking and Global Businesses, which operates

internationally and inside Spain, offer products and services to large corporate and financial institutions.

Markets and Private Banking business unit offers products and

management services related with savings accounts and investments.

The unit’s operations embrace SabadellUrquijo Private Banking;

Investment, Products and Research; Treasury and Capital Markets; and Securities Trading and Custodian Services. Chart 3 shows that as of 30.09.2015 this business unit together with its separate area;

Investment, Products and Research, were the ones on top providing

58.6% and 116.5% ROE respectively.

Asset transformation unit is divided into two areas: Banco Sabadell

Asset transformation (manages the Bank’s real estate assets) and Solvia

(provides services for real estate asset portfolios for the Group and third parties).

Sabadell America includes an international full branch, Sabadell United

Bank, Sabadell Securities USA, Inc., and other business units, affiliates and representative offices (New York since 2012). All together offer financial services in the corporate banking, private banking and commercial banking fields in the US.

Chart 1 – Largest Spanish Banks by Total Assets as of June 30, 2015 (€ Bn)

Source: Companies’ data

Chart 2 – Sabadell’s Gross operating income per business units (€ Mn)

Source: Company data

Chart 3 –Sabadell’s ROE per business

(5)

BANCO DE SABADELL,S.A. COMPANY REPORT

PAGE 5/32

History

Sabadell has undertaken an expansion policy since 1996, which in last years, its increase in scale, has been very notable (Table I). The latest acquisition by the Bank was done during 2015 (Appendix 4 - Sabadell’s landmark developments). On March 19th 2015, was approved by Sabadell’s Board of Directors the tender

offer for 100% of the shares of TSB at 340 pence per share in cash. Sabadell got control of TSB’s assets and assumed its liabilities on June 30th 2015.

Strategy

Sabadell launched in 2014 a new business plan known as ‘Plan Triple’ to put in practice from 2014 until 2016. The key themes of the business strategy are; transformation, profitability and internationalization (Chart 4). The strategy was

designed to leverage the strength of the bank’s balance sheet, its strong sales

platform and to recover the lending activity in the medium and long term. To achieve that, the following targets were settled for the FY2016; €1,000 million Income, 12% ROTE, 40% Cost to income ratio, 100% Loan-to-deposits, 1% Lending growth CAGR 2013-2016. Our estimations if Sabadell is on track to achieve the objectives mentioned before will be explained in the Valuation Chapter.

Shareholders structure

The share capital of Sabadell is €679,905,624, represented by 5,439,244,992

registered shares after its latest capital increase on October 12th 2015, with a

nominal value of €0.125 each. Sabadell’s shares were listed on April 18th 2001

on the Stock Exchange and a capital increase in 2004 placed the bank in the IBEX-35 stock market. Since 1999 the largest capital increase that Sabadell has done was on April 27th 2015 when it issued 1.1 billion shares to perform the

acquisition of TSB.

Sabadell’s shareholders structure as of September 30th 2015 is split in 45%

institutional investors and 55% retail investors (Chart 5). During 2014 Sabadell’s

management sought to engage actively with institutional investors. The

proportion of the bank’s shareholder base represented by institutional investors

increased from 38.5% in December 2013 to 48% in December 2014. The largest Shareholder of Sabadell is the Colombian Banker Jaime Gilinski Bacal, who is a real estate developer and philanthropist. He holds a 5.57% shares outstanding and the second largest shareholder is Winthrop Securities LTD, with a 3.65% outstanding and the company is located in Spain. Most of the institutional investors of Sabadell are Investment advisors (Chart 6); among them the first

Chart 7 – Shareholders structure by geographic

Source: Bloomberg Source: Company data

Table I Sabadell’s increases in scale as of 2014

2007 2010 2014 2014/ 2007

Assets (€ Mn) 76,776 97,099 163,346 2.1x

Loans and advances (€ Mn) 63,165 73,058 121,141 1.9x

Deposits (€ Mn) 34,717 49,374 94,461 2.7x Branches in Spain 1,225 1,428 2,267 1.9x

Employees 10,234 10,777 17,529 1.7x

Chart 5 Sabadell’s Shareholders structure

Source: Company data Source: Company data

Triple

Transformation

Sales Balance sheet Production model

Profitability

Leveraging greater scale into profit

Internationalization Preparing for the Group's

International expansion Entering new markets

(6)

BANCO DE SABADELL,S.A. COMPANY REPORT

PAGE 6/32 position by revenue is hold by the Norges Bank Investment Management from Norway with a 1.69% shares outstanding. The second and third positions are hold by Vanguard Group Inc and Blackrock Fund Advisors from United States, with 1.68% and 1.47% shares outstanding respectively. The fourth and fifth positions are hold by Dimensional Fund advisors LP 1.2 USA and Fidelity international, Bermuda, both with 0.47% shares outstanding.

The geographic distribution of Sabadell’s shareholders have changed during the

last three years (Chart 7), most of them continued to be unknown from 2013 to 2015 and the primary known location continues to be United States, although its representative percentage has decreased from 2013 to 2015. The second known location is Spain, which has notably increased from 2014 to 2015 by 16.31p.p. Moreover, in the composition of the bank’s shareholders we can see that most of them are asset management companies. The mean objective of these companies is to offer returns to the customers, but usually they show no intention to hold the shares for longer periods. Given the previous analysis, it can be

concluded that Sabadell’s shares are dispersed across multiple entities, although

regarding the big size of the bank, in our opinion, it is not vulnerable for a takeover.

The Sector

European Banking Sector

The EU banks continue facing important challenges and vulnerabilities in the European banking sector. The levels of private and public debt still remain high for EU countries. Chart 8 shows the aggregated values of public and private debt compared to GDP, which range from 175% and 514%. Moreover, inflation remains low, with expectations that will decrease from 0.6% in 2014 to 0.1% in 2015 (EU) and from 0.4% in 2014 to 0.1% (euro area). It is also expected that the unemployment rate will fall from 10.2% in 2014 to 9.6% in 2015 (EU, 2016 –

9.2%) and from 11.6% to 11.0% (euro area, 2016 – 10.5%). The growth on employment and the low levels of inflation rates may discourage consumers and investors spending and slowdown the pressures on economic growth.

Some countries within the euro area, such as Greece, continue facing geopolitical risk, economic and financial uncertainties. The risk arising from emerging markets and the general macroeconomic uncertainty is; increasing worries on further instability, possible effects on sovereign bond markets and major deterioration of assets quality. The pursuit for yield in a context of low

Chart 8 – Debt of general government and private sector debt as a percentage of GDP (EU–OECD countries, USA and Japan, end of 2013)

Source: OECD statistics, EBA calculations

Chart 6 – Shareholders structure by type

Source: Bloomberg

Chart 9 Common equity tier 1 ratio (Until Dec-13: tier 1 excluding hybrid instruments) – weighted average

Source: EBA KRI and EBA calculations

Table II – Tier 1 ratio, RoA, loan-to-deposit ratio – EU banks compared to US banks

2009 2010 2011 2012 2013 2014 EU

Tier 1 ratio 10.2% 11.0% 11.1% 12.5% 13.1% 13.3%

RoA 0.20% 0.30% 0.00% 0.02% 0.15% 0.21%

Loans to deposits 117.1% 117.8% 117.7% 115.7% 112.8% 108.4%

USA

Tier 1 ratio 11.4% 12.4% 12.6% 12.9% 12.7% 12.4%

RoA 0.39% 0.66% 0.65% 0.75% 0.88% 0.78%

Loans to deposits 79.5% 81.2% 74.9% 72.2% 69.9% 69.1%

(7)

BANCO DE SABADELL,S.A. COMPANY REPORT

PAGE 7/32 inflation and low interest rates may lead to potential asset price bubbles and also low interest rates impose challenges for bank’s profitability.

However, banks’ capital position has being strengthened since 2011 with the repair process of the European banking system. Chart 9 shows EU banks weighted average common equity tier 1 (CET 1) ratio’s increase from 2011 to 2014, growing from 9.2% to 12.1%. The improvements of the capital ratios are more related to increases in common equity than to decreases of RWAs. When comparing EU banks with the 20 largest US banks (Table II1), it is perceivable

the improvements of the EU banks’ capital positions, which levels are above the peers in US, since 2009 until 2014. The net capital increases, since the Lehman Brothers crisis, have been more substantial for EU banks. However, in terms of profitability (measured by ROA), EU banksare outperformed byUS banks which have better positions to keep moving forward a gradual growth of their capital base by the retention of earnings.

On the asset side, the deleveraging trend has plateaued with some signs of growth in total assets (by 5.9% - FY2014 YoY) and loan volumes (by 2.6%), at a slower peace (Chart 10 and 11). But the constant overall deleveraging tendency has stopped in the sector in the past years, even though banks continue reducing their exposures to fields such as investment banking. Everything seems to point out that banks are trying to recover their traditional business and come back to plain vanilla products. Despite there has been a progressive reduction of impairments on financial assets, there are still concerns around assets quality, associated mainly with specific geographies with action needed to move along the resolution of non-performing exposures.

Regarding funding markets and deposit bases, in the 2H 2014 and 1Q 2015, have shown positive pictures. There has been no real shortage of market funding, even though certain volatility in issuance volumes. The investors’

search for yield has positively influenced the increasing demand of subordinated debt instruments (issued by banks), especially after the publication of the quantitative easing (QE) programme by the European Central Bank (ECB). Also, in general terms, deposits bases increased supporting the overall positive of funding. During 2014 bonds and debt certificates’ share, as well as of client deposits in the overall funding mix, increased. By 2014, c50% of the funding mix was composed by customer deposits and by deposits from credit institutions (Chart 12).

1 The EU banks (55 banks considered in the EBA KRI) and the US banks (market data for the 20 biggest banks according to their total assets) – (data no adjusted for the difference in netting rules between US GAAP and IFRS).

Chart 10 - Total assets (€ Trillion)

Source: EBA KRI and EBA

Chart 13 – CoE for EU countries

Source: Bloomberg, NYU Leonard N. Stern School of Business, EBA calculation

Year end 2011 2012 2013 2014

RoE 0.0% 0.5% 2.7% 3.6% CET1 9.2% 10.8% 11.6% 12.1%

Table III Comparison of RoE and CET

1 ratio (weighted average, per

yearend)

Source: EBA KRI

Chart 12 - Funding mix (weighted average) per year end 2014

Source: EBA KRI

Chart 11 - Total loan volumes (€ Trillion)

(8)

BANCO DE SABADELL,S.A. COMPANY REPORT

PAGE 8/32 Regardless the improvements in funding conditions, financial markets continue fragile and volatile in general terms. The remaining vulnerabilities are related to funding in foreign currencies, passive cross-border interbank markets, and the liquidity worries of the trading market. The levels of asset burden remain high, as such the Central bank based funding, which means that trust across banks in the single market has not been completely restored yet, and that funding markets have not returned either to pre-crisis conditions.

In terms of profitability, the challenges remain for EU banks. It was registered on December 2014, the highest weighted average RoE of 3.6%, since 2011. This ratio has been constantly increasing on a year-to-year basis with similar increases in the CET 1 ratio (Table III), although far away from the pre-crisis levels. This modest increase has been driven mostly by the growth of the NII by

€15 billion (+5% compared to FY2013) and the sharp decline of impairments of

financial instruments (€24 billion, -20% on a year-to-year basis). The growth of total loans and debt instruments explain the positive increase of net interest income during 2014. Furthermore, the greater portion of loans that are funded by deposits in conjunction with the Central banks’ funding, have reduced cost of funding for banks and interest expenses, plus has a positive impact on net interest margins (NIMs).On the other hand, asset quality continues to be a drag due to the associated litigation costs that impose significant fee on banks’

profitability. The ROE remains thus subdued and not enough to cover the cost of equity (CoE) for many banks that might lead to disproportionate risk taking or cost cutting in an effort to increase profitability. Chart 13 shows the comparison of the CoE in 2015 with the one in mid-2011 in order to assess its evolution. The outcomes show that the average CoE for the EU in 2015 is 9.5% (excl. Greece), which is lower than the 14.6% in 2011. This difference is due to the current interest rates context that reached a peak in 2011.

There are other concerns linked to the sustainability and viability of some banks’

business models. Because it is not clear enough which are the strategies that banks are going to follow in order to return to adequate levels of profitability, while they walk away from official funding. Market analysts are considering that in the short term, shadow banking2 and technological advances are tendencies

that can highly impact the EU banking sector and banks’ business models (Chart 143). The continuing tightening of banks’ regulations together with abundant

liquidity and investors’ search for yields are issues that could be boosting a change of traditional banking activities into shadow banking. An increasing role

2 Shadow banking such as mutual funds, hedge funds, finance companies, venture capital corporations and securitisation vehicles.

3 Results obtained through Risk assessment questionnaire (RAQ): You expect that the following trends will impact European banks most in the next 6–12 months (please do not agree with more than two options).

Chart 14 - Trends that will impact European banks

Source: EBA RAQ for analysts

Chart 15 Spain’s nominal GDP (Index – Base 2010) and estimates

Source: Banco de España

Source: Banco de España

Chart 16 –Spain’s unemployment rate from March 2002- September 2015

Source: European Central Bank

Chart 17 Unemployment rate

(9)

BANCO DE SABADELL,S.A. COMPANY REPORT

PAGE 9/32 of the shadow banking and of the disintermediation of the traditionally financial activities developed by banks, can possibly impact banks’ revenues such as fees and commissions, as well as their ability to grow in other areas that could offset the weakening in net interest returns.

Spanish Banking Sector

Banco de España (BDE) is Spain’s central bank and the supervisor of its banking sector. It has established numerous measures since 2007 to increase the resilience of the sector such as; increasing provisioning and transparency4 in

relation to the banks’ exposures to the real estate development and construction segments, it has promoted mergers between saving banks, and set up the SAREB5. Moreover, information regarding the results of the stress tests

conducted by the European Banking Authority (EBA), where 90% of the banking system participated (Sabadell included), must be clearly accessible too.

Despite all the measures undertaken, the system continues having doubts about the quality of the assets on banks’ balance sheets and also about banks' level of solvency. Currently, BDE is managing a complex restructuring and recapitalisation programme, the Memorandum of Understanding (MoU) which was agreed with the European authorities in July 2012, the mean objective is to restore confidence and stabilise the Spanish banking sector and place it on a more secure footing for the future.

Before going deeper into the Spanish banking sector we would like to comment first, some points in the macroeconomic context in Spain, that in past years had major impacts in the refer banking system.

The economy in Spain was enjoying a prolonged period of expansion between the years 2000 and 2008, growing at a CAGR of 7.1% (Chart 15). Spain’s GDP

reached its biggest increased in 2008 (€1,116 trillion), which fall by 3.3% in 2009

and continue declining afterwards as of 2014. During 2008 to 2013, there were no indicators of growth in the economy, only in 2014 the GDP has shown some positive results reaching €1,041 trillion and it is expected at the end of 2015 will amount €1,078 trillion. Overall, this is a very positive indication of recovery for the Spanish economy.

The unemployment rate is another important macroeconomic variable to take into account (Chart 16), because it impacts directly the performance of; the Non-Performing Loans (NPLs), the volume of loans the banks are willing to offer to its customers and the deposits received from them as well. The refer rate has

4 Information provided by the banks to the markets.

5 Company for the Management of Assets proceeding from Restructuring of the Banking System to which non-performing real assets of banks have been transferred.

Chart 19 – Residential property prices index - Spain

Source: Banco de España

Chart 18 % of Real estate

activities/GDP

Source: Banco de España

Chart 20 Spain’s number of

employees

Source: Banco de España

Chart 21 – Spain number of branches

(10)

BANCO DE SABADELL,S.A. COMPANY REPORT

PAGE 10/32 increased since 2007 in Spain until March 2013 (26.94%), and it has started to decrease from that moment on until September 2015 to 21.18%. According to the ECB estimations (Chart 17) the unemployment rate for FY2015 will decrease to 22.3% and continue declining for the next two years, which will translate in a positive impact in the items mentioned before.

Despite the economic indicators mentioned before, the Real estate sector is very relevant for the Spanish economy. Chart 18 shows that in 2008 real estate activities accounted for 8.2% of GDP, where most of the houses were purchased and built through loans obtained from financial institutions.Housing prices grew at an incredible CAGR of 42% from 1995 until 1Q of 2008 (Chart 19), bring as result the housing bubble6. This housing bubble burst in the beginning of 2008

and house prices started to fall until the 3Q of 2015 at a CAGR of 18%.Basically the real estate activity in Spain was developing very well in the past and

Spanish’s banks were increasing their exposure to this sector in a constantly

basis. The real estate assets were used as collateral, meaning that loans were considered safe and due to long maturities the expectations of high returns were big. The incentive to increase mortgage loans was growing and therefore the sources they were allocating to this type of loan. Consequently, when the real estate crisis begun, the values of these collaterals fell considerably, the real estate market became illiquid and banks became unable to recover the expected returns from selling the collaterals in case of default.

During the restructuring process of the Spanish banking system, many employees were fired, offices were closed and the smallest and weakest banks were merged or acquired. This is part of the consolidation process this sector in Spain is facing through, where the smaller institutions are becoming large multi-regional banks. Charts 20, 21 and 22 show that from 2007 to 2014 the reduction; in the number of employees in the sector from 277,311 to 208,291 (CAGR of -4%), in the number of branches from 45,500 to 31,999 (CAGR of -5%) and in the number of institutions from 357 to 272 (CAGR of -4%).

Funding Structure

The mean reactions in the financial markets driven by the International Financial Crisis were; i) banks isolated themselves from each other (lending market slowed down) and ii) central banks started to apply monetary policies to promote economic growth and access to capital by the banks.

6 Housing bubble: Refers to the economic bubble occurred in the global real estate markets, followed by a land boom(rapid increase in valuations of real property such as housing until they reach unsustainable levels and then decline in a bubble).

Chart 25 – Total amount of deposits by type (€’000)

Source: Banco de España

Chart 22 Spain’s number of

institutions

Source: Banco de España

Chart 23 Mean Sources of funding (€'000)

Source: Banco de España

Chart 24 Total Deposits (€’000)

(11)

BANCO DE SABADELL,S.A. COMPANY REPORT

PAGE 11/32 Sources of funding are split in four groups (Chart 23); Total deposits, Equity, Securities (other than shares) and Others7. Spanish banks have always relied on

deposits as their mean source of funding. The strategy has not changed in the last times (Chart 24) especially due to the illiquid characteristics of the interbank lending market and the restrictions imposed by central banks to credit lines. Also, because despite financial institutions’ bonds have lower yield to maturity, they continue being more expensive with respect to deposits. Since 2000 up to 2008, the total amount of the mean source of funding was increasing at a CAGR of 11%, after 2008 it started to fall at a 3% CAGR up to August 2015 (consequence

of the Lehman Brothers bank’ crash).

Chart 25 shows the total amount of deposits by type, where the amount of funding coming from the General government and the Resident sector (includes non-financial institutions and households), both fall at a CAGR of 2% as of 2015 from 2008 in Spain. The deposits from the Resident sector hold the highest percentage of total deposits and it is mostly composed by savings accounts and time deposits from households. Families that were already indebted (Loans to gross disposable income in 2017 was 130% - Chart 26), after the initiation of the International Financial Crisis saw future income will be lower than expected, plus the fact that banks were being more restricted when conceding credits to customers. As a result, credits fall; families withdrawn huge amount of money from their deposits to pay debts and started also to save less. In conclusion, the main source of funds for banks was being in risk.

Another important source of funding for banks is the Equity, which is considered the most expensive one. The value of Equity in the Spanish economy has seen an increase in the last years. The outcomes of the stress in 2012 have been one the drivers of this increase due to the major changes in regulations and legislations related to the banking system. When looking at the increasing tendency of the Equity held by banks in Spain from 2007 up to now (Chart 27), we notice how severed the new regulatory capital requirements have been implemented after the crisis in order to create a better safety cushion to support the unexpected losses on their assets.

Regarding Spanish banks’ debt, when studying the behaviour of short-term and long-term debt securities in the past, we see that since the beginning of 2000 until the end of 2007 these items have being growing at 38% and 34% CAGR respectively (Chart 28). Banks, started to look for funds in the market, that were priced at lower rates than the mortgages loans with the purpose of financing their own growth through real estate loans. But after 2008, the interconnectivity

7 Others caption is composed by: Accrual and sundry accounts.

Source: Banco de España

Chart 26 Spanish Loans to gross disposable income

Chart 27 - Spanish Book Value of Equity (€'000)

Source: Banco de España

Chart 28 – Debt securities issued by the Spanish Banks (€ Mn)

Source: Banco de España

Sabadell Popular Santander BBVA 2013 BB BB- BBB

BBB-2012 BB BB BBB

BBB-2011 BBB BBB+ A+

AA-2010 A A AA AA

2009 A A AA AA

2008 A+ AA- AA AA

2007 A+ AA AA

AA-Table IV Long term credit ratings (S&P)

Source: Companies’ data and Standard

(12)

BANCO DE SABADELL,S.A. COMPANY REPORT

PAGE 12/32 between the financial institutions in the system started to face serious problems; the global financial system saw itself highly exposed to systemic risk. The worries from institutions in placing their debt securities on investors increased. Banks started to stop lending each other, also because the changes in the regulatory requirements that obliged banks to issue more equity in order to provide such loans because suddenly all the institutions were consider risky by the rating agencies (Table IV).

When in 2012 it was made public the recapitalization need of the Spanish Banking system and the Basel III accords (explained further in this report) started to be known by banks, the banks debt’ maturities structure suffered changes again. There was then an opportunity for banks to shift their short-term debt for a higher quality funding to comply with the new regulatory requirements. Long-term debt are less risky for investors (because they are more senior) and easier to place in the market.

Cost of Funds

The banks’ interest rates paid for all type of depositors and all type of maturities

were peacefully increasing over time since 2003 and reaching its peak on October 2008 (Chart 29). However, from October 2008 to October 2015, interest rates with maturity higher than or equal one year paid on households’ deposits in Spain fell by 4.3.p.p. to 0.44.p.p. and in the Euro area fell by 3.7.p.p. to 0.75.p.p. For Corporations the situation was very similar for interest rates with the same maturity. Interest rates have fallen by 4.6.p.p. to 0.40.p.p. in Spain and the Euro area by 4.3.p.p. to 0.63.p.p. The Euro Area and Spain’s interest rates follow a very

similar pattern.

From September 2008 the ECB’s refinancing rate has been decreasing and reaching its historical low in September 2014 of 0.05% as of today (Chart 30). The reasoning behind is to promote economic growth and boost Eurozone inflation rate to reach again the desire 2% by the ECB. Moreover, the Euribor 6-months, which is positive correlated with the ECB’s refinancing rate, has being following the same declining trend (Chart 31). This is because the opportunity cost of borrowing from the central bank or money market. Overall it is observed a market decrease in the interest rates used as benchmark, which means that banks’ cost

of funds is decreasing as well.

In the stock markets the situation for banks has changed. Banks’ share prices

have become cheaper, while the return demanded by shareholders increased due to lower expected cash flows. The main drivers of a stock price are; the dividends per share paid by a company and growth rate of the dividends. Ever

since shareholders’ responsibility for the good performance of the company

Source: Banco de España

Chart 30 ECB’s refinancing rate Chart 29 – Deposits' annual interest rates for households and corporations (%)

Source: Banco de España

Chart 32 – Spanish bank’s deposits market share in the Sector

Source: Banco de España and company’s data

Chart 33 –Spanish bank’s loans market share in the Sector

Source: Banco de España and companies’ data

Chart 31 – Euribor 6-month evolution

(13)

BANCO DE SABADELL,S.A. COMPANY REPORT

PAGE 13/32 became tighter, the negative results would be supported by them. This means that in order to issue additional capital to comply with the new capital requirements, banks have to retain earnings and do not distribute them among its shareholders. This increases the uncertainties around the expected dividends that are going to be paid in financial institutions and lower the expectation for the future cash flows.

Profitability

With the objective to analyse the Profitability of the sector we selected three banks that, together with Sabadell, are very influent in the Spanish Banking sector: Banco Santander S.A. (Santander), Banco Bilbao Vizcaya Argentaria (BBVA) and Banco Popular Español (Popular) all belonging to the Ibex-35 Index. The accumulated market shares for Deposits and Loans as of the 3Q of 2015 for these institutions in the Spanish market were 91% and 98% respectively (Chart 32 and 33). The market share in loans held by these institutions has been constant since 2007 up to 2013. Notable increased is perceived after 2013 in

Santander and BBVA’s case, which in 2014 and 2015 its deposits and loans

have increased considerably.

One way to measure the profitability of the sector is by applying a DuPont analysis, being especially useful when comparing two different periods to check for differences in underlying drivers.

To do that, we compared 9M 2015 results with FY2007 results, even if 2007 was a peak year for banks and not an average year. Looking at Table V, we can see that ROE decreased from 18% in 2007 to 4% in 9M2015, with negative impacts from all components.

By far the most important driver was the very significant reduction in the Profit Margin, from 35% to 13%. This can be traced mainly to 2 questions: i) the very big increase in provisions in Spain and ii) the negative impact of low interest rates on NII. The former was the most important one and was caused by the impact of the Financial Crisis (but also the end of the Spanish real estate bubble) on banks’

credit quality, which forced a major provisioning effort to reflect the marked deterioration on their credit books (Table VI). The later has been more important recently, as the very low interest rate environment in Europe has been limiting

banks’ ability to earn money through their NIMs, damaging significantly their

profitability. On top of that, the economic slowdown in Spain also affected other

P&L lines like commissions, further reducing banks’ revenues and therefore their

bottom line.

Table V – DuPont analysis of the Sector

Source: Companies’ data and Analyst’s calculations

9M 2015 2007

ROE 4% 18%

Profit Margin 13% 35% Total Asset Turnover 2% 3% Equity Multiplier 1371% 1643%

Chart 34 Net Income evolution of the 4 Spanish bank as of 9M 2015 (€ Mn)

Source: Companies’ data

Source: Companies’ data and analyst’s calculations

Table VI –Spanish banks financial analysis (€ Mn)

Popular Santander BBVA Sabadell Operating Income 3,103 34,378 17,534 4,258 Net interest income 1,760 24,302 12,011 2,240

Net Fees & Com. 512 7,584 3,442 728

Trading income 687 1,702 1,558 1,152 Other income 144 790 523 138

Net Income 302 5,106 1,702 580

Provisions for NPLs - 1,820- 7,797- 3,859- 1,955 Assets 160,028 1,320,427 746,477 205,141 Equity 12,695 98,687 53,601 12,366 REO - Dupont 2% 5% 3% 5% Operating Income 3,452 27,095 17,271 2,162 Net interest income 2,288 15,296 9,628 1,317 Net Fees & Com. 883 8,040 4,560 611

Trading income 66 2,998 1,545 95

Other income 215 761 1,538 139

Net Income 1,341 9,059 6,415 788

Provisions for NPLs - 349- 3,549- 2,138- 207 Assets 107,169 912,915 501,726 76,776 Equity 6,644 58,080 27,943 4,605 ROE - Dupont 20% 16% 23% 17%

9M 2015

(14)

BANCO DE SABADELL,S.A. COMPANY REPORT

PAGE 14/32 The equity multiplier reduction also had a negative effect, as due to regulatory reasons banks were forced to carry major capital increases to reduce their previous (too) high leverage ratios. Since banks were required to have more equity to perform the same (or less) business, it was naturally a drag on ROE (more Equity to less Return).

Moreover, emerging currencies have been working against BBVA and Santander which are placed within the six European banks8 that bet on growth on emerging

markets and now are facing a deteriorating profit outlook as chaos roils economies from Asia to South America. These both Spain’s largest lenders; have been relying on income from Latin America (LatAm) due to limits of growth at home in a low interest rates environment. Roughly 20% of the loan book value of Santander and BBVA is in LatAm and now are suffering a shift in sentiment. On August 2015, China’s yuan devaluation (Chart 35 and 36), rose concerns that the global economy is going for a slowdown, although the Fed rose interest rates on Dec 16th 2015 showing improvements in the US economy. Moreover

currencies from Malaysia to Turkey to Brazil fell on August 2015 as well, while an index of commodities fell to its lowest since 1999.

Santander, settled a strategy to transform its structure from a provincial lender into the second biggest bank in Europe by market value, it has spent, under former Chairman Emilio Botin, more than $70 billion (c€64 billion) on acquisitions which include Banco Real in Brazil. Santander generates about a fifth of profit from commodities-rich Brazil (Chart 37) that relies on the demand for metals of China and is living the worst recession since 1990. It does not seem that the political situation in Brazil is getting any better and overall the economic situation is pretty bad shape. In conclusion the bank will start cutting types of lending in Brazil that are most prone to losses.

On the other hand BBVA derived two-thirds of its operating income from Mexico, South America and Turkey in the first half of 2015. Mexico’s GDP is expected to expand 2.5% in 2015 although some economists are paring their growth forecasts for Mexico.

In Turkey, where BBVA owns c40% of Turkiye Garanti Bankasi AS (Turkey’s

largest bank), a political impasse intensified security risks and accelerating inflation pushed the lira to a record low against the euro (Chart 38).

Both banks tried to balance growth offered by emerging countries, especially in Santander’s case that enjoys stability from mature economies such as the UK and Germany. The seek to add emerging-markets revenue helped Santander

8 The six European Banks are: BBVA, Erste Bank, HSBC, Santander, Standard Chartered, and UniCredit.

Chart 35 – CNY/USD evolution from 31 Jan 2005 – 31 Jan 2016

Source: Reuters

Chart 36 – CNY/EUR evolution from 31 Jan 2005 – 31 Jan 2016

Source: Reuters

Chart 37 – How Brazil bolstered Santander earnings during Spain’s crisis

Source: Company data

Source: Reuters

(15)

BANCO DE SABADELL,S.A. COMPANY REPORT

PAGE 15/32 and BBVA to resist Spain’s five-year economic crash, however everything affecting the ability to repair their balance sheets through retained earnings, will come back to haunt them.

On the other hand, no big changes are perceived in the Asset Turnover which decreased by only 1p.p. and this is because total assets in Santander, BBVA and Sabadell have considerable increased as of 9M 2015 driven by the acquisitions made inside and outside Spain.

On Charts 39 and 40 we can see the Total revenues breakdown for the four banks as of 9M 2015 and for FY2007, respectively. NII is still the major source of revenue as of 2015, mostly because they are Retail oriented banks and also we can see how the Trading income has become a valuable source of revenues for Sabadell and Popular which is not common in retail banks. Although the increase in the item impacts positively the operating income must not be consider recurrent for the sector as a whole, because this kind of source of revenues is not sustainable over time because of its high volatile level.

Regulatory Capital

Basel II

Basel II was written with the objective of revising certain issues on Basel I (1988 Basel Accord) that were not able to control the new complications in the financial instruments and activities. Basel I was primarily focused on credit risk by creating a bank asset classification system (Table VII), but this kind of control were staying behind with the markets globalization, deregulation and technology’s

development.

Basel II, published in June 4, was organized in three pillars: The first pillar –

Minimum capital requirement, The second pillar – Supervisory review and The third pillar – The market discipline. Pillar I manages the maintenance of regulatory capital that is calculated based on the three main components of risk a bank faces: credit risk, operational risk and market risk. Pillar II aims to give regulators better tools than the ones available in Pillar I, because it deals also with so called residual risks9. Pillar III focuses on the disclosure of the information

that would allow market’s participants to measure the capital adequacy of an

institution.

9 Residual risk: systemic risk, pension risk, concentration risk, strategic risk, reputational risk, liquidity risk and

legal risk.

Chart 39 –Income’s share over Total Revenues (9M 2015)

Source: Companies’ data and analyst’s calculations

Table VII – Basel I classification system

Risk Categories Bank's Assets

0% Cash, Central bank and government debt and any OECD government debt 0%, 10%,

20% or 50% Public sector debt

20%

Development bank debt, OECD bank debt, OECD securities firm debt, Non-OECD bank debt (under one year maturity) and Non-OECD public sector debt, Cash in collection

50% Residential mortgages

100%

Private sector debt, Non-OECD bank debt (maturity over a year), Real estate, Plant and equipment, Capital instruments issued at other banks

Source: Bank for International Settlements - BIS

Basel II Basel III Capital Requirements:

Minimum Common Equity Tier 1 (CET1) 2% 4.5% Additional Tier 1 (AT1) 2% 1.5%

Additional Capital Buffers:

Capital Conservation Buffer 2.5% Discretionary Counter-Cyclical Buffer 2.5%

Tier 2 Capital 4% 2%

Table VIII Regulatory requirements comparison

Source: Bank for International Settlements - BIS Source: Companies’ data and analyst’s calculations

(16)

BANCO DE SABADELL,S.A. COMPANY REPORT

PAGE 16/32

Basel III

Basel III appeared from 2012 to fix the vulnerabilities of the exposed financial system after the international financial crisis. It would focus primarily on the risk of a run on the bank by requiring different levels of reserves according to the type of bank deposits and other borrowings. Therefore, Basel III does not displace the guidelines of Basel I and II; but it will work alongside them. The Key principles are related to Capital requirements, Leverage ratio and Liquidity requirements. Regarding Capital requirements (Table VIII), banks must hold from 2010 a minimum Common Equity Tier 1 (CET 1) ratio of 4.5% (up from 2% in Basel II) of Risk weighted assets (RWAs) and must be kept at all times by the banks. Moreover the minimum Tier 1 capital increases from 4% in Basel II to 6% over RWAs, applicable in 2015. This 6% is composed of 4.5% of CET 1, plus an extra 1.5% of Additional Tier 1 (AT 1).

Furthermore, Basel III has introduced two additional capital buffers: a mandatory

“capital conservation buffer” and a “discretionary counter-cyclical buffer”. The

capital conservation buffer is equal to 2.5% of RWAs and taking into account the 4.5% CET 1 capital ratio also required, banks must hold in total 7% CET 1 capital, from 2019 onwards. The discretionary counter-cyclical buffer would allow regulators to demand up to an additional 2.5% of capital on periods of high credit growth.

Basel III introduced as well a minimum “leverage ratio” and it is expected banks

to keep in excess a leverage ratio of 3%.

Among the Liquidity requirements it was introduced two required liquidity ratios; i) the Liquidity Coverage Ratio which obliges a bank to hold sufficient high quality liquid assets to cover its total net cash outflows over 30 days and ii) the Net Stable Funding Ratio to require the available amount of stable funding to exceed the required amount of stable funding over a one-year period of extended stress. The Tier 2 capital ratio, considered as a supplementary capital was reduced from 4% to 2% under Basel III. All the changes introduced by this latest Accord should be fulfilling by all the banks in 2019, forcing them to start issuing more shares. The amount of Equity registered in the 1stof January 2005 was €148 billion, as

expected with the changes in the minimum capital requirements, a large increased of equity in the financial and credit institutions occurred as up today. However, by looking at Chart 41 we noticed that from the middle of 2014 until June 2015 the amount of equity has decreased at a CAGR of 11% which means that even though the amount of equity continues being high with respect to 10

Chart 41 – Book Value of Equity (Index – Jan/2005)

Source: Banco de España

Source: Oliver Wyman-Asset quality review and bottom up stress test. September 28, 2012

Table X Overview of estimated capital needs at entity level under adverse scenario (€ Bn) - 2012

Financial group Projected Loss AbsorptionLoss Capital excess (pre-tax) Capital excess (post-tax)

Santander 34 59 24.4 25.3

BBVA-UNNIM 31 40 8.2 11.2

La Caixa 33 37 3.9 5.7

Kutxabank - Cajasur 7 9 1.8 2.2

Sabadell-CAM 25 26 0.6 0.9

Bankinter 3 4 0.3 0.4

Unicaja - CEISS 10 9 -0.9 0.1

BMN 9 6 -3.1 -2.2

Libercaja 16 12 -3.4 -2.1

Banco Valencia 6 2 -3.4 -3.5

Popular - Pastor 22 17 -5.5 -3.2

NCG 13 6 -6.8 -7.2

Catalunya Banc 17 7 -10.5 -10.8

BFA-Bankia 43 19 -23.7 -24.7

System 270 252 -57.3 -53.7 Source: Oliver Wyman-Asset quality review and bottom up stress test. September 28, 2012

Financial group

Market share (% of Spanish

assets)

Santander (incl. Banesto) 19% BBVA (incl. UNNIM) 15% Caixabank (incl. Banca Cívica) 12%

BFA-Bankia 12%

Banc Sabadell (incl. CAM) 6% Popular (incl. Pastor) 6% Libercaja (Ibercaja - Caja 3 - Liberbank) 4%

Unicaja - CEISS 3%

Kutxabank 3%

Catalunyabanc 3%

NCG Banco 3%

BMN 2%

Bankinter 2%

Banco de Valencia 1%

Table IX Spanish domestic financial institutions in-scope

Source: Oliver Wyman-Asset quality review and bottom up stress test. September 28, 2012

Table XI – Overview of estimated capital needs at entity level under base scenario (€ Bn) - 2012

Financial group Expected Loss AbsorptionLoss Capital excess (pre-tax) Capital excess (post-tax)

Santander 22 43 21.3 19.2 BBVA-UNNIM 20 31 10.9 10.9 La Caixa 22 32 10.2 9.4 Sabadell-CAM 18 22 4.4 3.3 Kutxabank - Cajasur 5 8 3.4 3.1 Unicaja - CEISS 7 8 1.0 1.3 Popular - Pastor 15 16 0.5 0.7 Bankinter 2 3 0.6 0.4 Libercaja 11 11 0.4 0.5 BMN 6 6 -0.4 -0.4 Banco Valencia 4 2 -1.7 -1.8 NCG 9 6 -3.6 -4 Catalunya Banc 13 6 -6.2 -6.5 BFA-Bankia 30 17 -12.2 -13.2

(17)

BANCO DE SABADELL,S.A. COMPANY REPORT

PAGE 17/32 years ago, the cleanse of balance sheet from risky assets in this institutions is being effective in general terms, which translate in less capital to be hold and another way to increase the capital ratios and comply with them.

Stress tests

The test scenarios and methodology for the 91 European credit institutions were developed between the Committee of European Banking Supervisor (CEBS) and the ECB. It was defined by the CEBS a Tier 1 capital ratio of 6% to be hold in the adverse scenario (+50% than the legally minimum required). The outcomes in 2010 revealed the capital needs in a highly stressed and unlikely scenario; however no private bank needed more capital to reach the settled Tier 1 ratio in both scenarios.

After two years in a row disclosing positive results, Spain’s savings banks

collapsed and required to ask for a bailout. It was required then in 2012 a top-down stress test exercise that it was concluded on the 21st of June and after

Oliver Wyman was commissioned to perform a bottom-up stress test analysis of the most significant financial groups in Spain (Table IX shows the 14 banks under analysis, considering the on-going consolidation processes), covering c90% of the Spanish banking assets.

This bottom-up exercise aimed to estimate the capital needs of the system and individual banks in the base and adverse scenarios10. The difference between the

top-down stress test exercise and the bottom-up stress test, were that the former analysed historical performance, the entities’ conditions at the beginning of the stress period and assets mix at an aggregate level. While in the second one supervisors had the chance to analyse bank’s portfolio more accurately, by evaluating the individual risk profiles of the different banks and resulting in an individual valuation of capital needs. The bottom-up analysis estimated first the expected credit losses and each entity’s loss absorption capacity, embedding the results from the concurrent portfolio and asset quality review. The process included three key components: Projected loss forecast, Loss absorption capacity forecast and Potential capital impact and resulting solvency position in the two scenarios. When the estimations of the bottom-up test were finished on June 2012, the results showed that the Spanish banking system had projected

losses of €270 billion and a loss absorption capacity of €252 billion (Table X)

under the adverse scenario. The total estimated capital needs (pre-tax) of the sector under the same scenario were c€60 billion (€59.3 bn), expected to be reduced to around €57.3 billion with the mergers in progress considered within

10 Base or baseline scenario reflected the consensus expectation of professional forecast in February 2009 on the depth and duration of the recession, and

the adverse scenario was designed to reflect a recession that is longer and more severe than the consensus expectation. Source: Oliver Wyman-Asset quality review and

bottom up stress test. September 28, 2012

Table XII Macroeconomic scenarios provided by the Steering Committee

2011 2012 2013 2014 2012 2013 2014 GDP:

Real GDP 0.7% -1.7% -0.3% 0.3% -4.1% -2.1% -0.3%

Nominal GDP 2.1% -0.7% 0.7% 1.2% -4.1% -2.8% -0.2%

Unemployment rate 21.6% 23.8% 23.5% 23.4% 25.0% 26.8% 27.2%

Price evolution:

Harmonised CPI 3.1% 1.8% 1.6% 1.4% 1.1% 0.0% 0.3%

GDP deflator 1.4% 1.0% 1.0% 0.9% 0.0% -0.7% 0.1%

Real estate prices:

Housing Prices -5.6% -5.6% -2.8% -1.5% -19.9% -4.5% -2.0%

Land prices -6.7% -25.0% -12.5% 5.0% -50.0% -16.0% -6.0%

Interest rates:

Euribor, 3 months 1.5% 0.9% 0.8% 0.8% 1.9% 1.8% 1.8%

Euribor, 12 months 2.1% 1.6% 1.5% 1.5% 2.6% 2.5% 2.5%

Spanish debt, 10 years 5.6% 6.4% 6.7% 6.7% 7.4% 7.7% 7.7%

Ex. Rate/USD 1.4% 1.3% 1.3% 1.3% 1.3% 1.3% 1.3%

Credit to other resident sectors:

Households -1.7% -3.8% -3.1% -2.7% -6.8% -6.8% -4.0%

Non-Financial Firms -4.1% -5.3% -4.3% -2.7% -6.4% -5.3% -4.0%

Madrid Stock Exchange Index -9.7% -1.3% -0.4% 0.0% -51.3% -5.0% 0.0%

Base case Adverse case

Source: Oliver Wyman-Asset quality review and bottom up stress test. September 28, 2012

(18)

BANCO DE SABADELL,S.A. COMPANY REPORT

PAGE 18/32 the scope of the exercise. The estimated capital needs applied to 7 out of the 14 entities (Capital excess post-tax) under the adverse scenario (38% of the exposure under consideration). The three largest institutions (SAN, BBVA, and Caixabank – 43% of the considered exposure) had an estimated capital excess

of €37 billion in the adverse scenario. Sabadell was not one of the banks under

capital needs, actually in both scenarios, adverse and base, it was counting with an excess capital post-tax of €0.9 billion and €3.3 billion respectively. The base and adverse scenarios settled a CET 1 of 9% and 6% respectively and the estimated wide pre-tax capital needs were €24 billion (base scenario) and c€57

billion (adverse scenario) (Chart 42).

The big question arising is, why the previous tests did not detect the actual shortfalls the banks were having? The answer relies on the methodology that was implemented to perform this test, which focused special attention on the credit portfolio of the 14 groups, due to the increasing concerns in the markets over the solvency and quality of the Spanish banking system. It differs mostly from the previous stress tests performed in the greater effort applied this time in the Spanish exercise. For example, 14 macroeconomic factors were considered (Table XII), being the most significant factors of the Spanish economy, such as land and housing prices, financial data of the Madrid stock exchange, etc. Moreover, the time horizon was extended for a period of three years (from 2012 to 2014), when in most of the other tests conducted the period analysed comprised two. This means that the economic recession would last for a longer period of time, which translate in higher potential losses of the analysed banks, and their potential capital needs. It was also included much more adverse assumptions or greater deteriorations of all factors: a fall in GDP of 6.5% in the adverse scenario over the three years while in 2010 and 2011 was considered a fall of 2.6% and 2.2% respectively, a maximum of 5.6% increase in the unemployment rate by the end of the time horizon (variable not considered in 2010 and 2011 stress tests), and house and land prices and the extension of credit all fall over the three years, and more markedly so in the adverse scenario. Last but not least, the capital ratios used in this stress test were much higher than the ones used in the latest similar tests, such as in the European Banking Authority (EBA) exercise where it was settled a 5% in the adverse scenario and 8% in the base scenario.

Chart 43 - Loans and Receivables by type (€ Mn)

Source: Company data

Source: Banco de España and analyst’s estimations

Chart 44 - Sabadell's market shares over the Total Loans of Credit Int. in Spain to Customers

Source: Banco de España and analyst’s estimations

(19)

BANCO DE SABADELL,S.A. COMPANY REPORT

PAGE 19/32

Valuation

The SOTP method was used to perform the valuation of Sabadell to add up TSB

divisions’ value to Sabadell’s value. It was necessary to value first; Sabadell as a

group (excl TSB) and TSB using for both the FTE method.

Sabadell’s valuation

Starting with the Commercial Activity of the bank, the Cash and balance with

Central Banks was projected under the assumption that Sabadell will aim to

keep 3% reserves over the deposits from customers. This percentage is higher than the minimum required reserves enforced by the ECB (1%) and no changes in the near future are expected.

One of the most important captions inside the BS of Sabadell is the Loans and

receivables (L&R) portfolio which is segmented into Customers, Credit

institutions and Debt securities (Chart 43). In general terms this item has experienced for all the banks in Spain a slowed down after 2008, driven mostly

by the decline in loans to customers, but in Sabadell’s case this item actually has

being increasing from 2008 as of 2014 at a CAGR of 10%.

The projection for the Total amount of L&R were based on the market shares Sabadell holds over the Total loans and advances to Customers and to

Credit Institutions over the same items in Spain. Sabadell has kept an average

of 5.1% market share in the Loans and advances to customers from 2007–2014 (increasing YoY), in 2014 the market share was 8% (Chart 44). It was projected that Sabadell would aim to keep a market share of c8% for the FY2015 and continue strengthen its position over the next years by keeping a constant market share of 8%. The reasoning behind is the restabilization of the Spanish economy, therefore families will become less indebted and able to request for more loans. Besides, because more acquisitions are expected to be done by the bank in the future and the purchase of mortgage loans is also within the business strategy of the bank11.

On the other hand the Loans and advances to Credit institutions has kept an average of market share of 1.7% from 2007-2014, in 2014 the market share was c3% (Chart 45). For the FY2015e and FY2016e was forecasted that Sabadell would have a market share of 2.2% in this item, and will gradually growing at 0.1.p.p. YoY. Based on the improvements in the Spanish economy, credit institutions must tend to start trusting each other and start increasing their lending activity again. Whilst Debt securities segment is a residual item and given the

11 Sabadell is in bid for a £13 billion portfolio of former Northern Rock mortgages from the tax payer. Source: Company data and analyst’s

estimations

Chart 46 - Available-for-sale (AFS) Financial Assets evolution (€ Mn)

Source: Company data and analyst’s estimations

Chart 47 - Tangible and Intangible assets' evolution (€ Mn)

Source: Company data and analyst’s estimations

Chart 48 - Non-current assets held for sale evolution (€ Mn)

Source: Banco de España and analyst’s estimations

(20)

BANCO DE SABADELL,S.A. COMPANY REPORT

PAGE 20/32 historical behaviour, it only appeared in 2012, it was projected to disappear as time goes by.

The Available-for-Sale (AFS) Financial Assets portfolio, which is the second

largest portfolio of Sabadell, has shown signs of growth over the past years (Chart 46). The portfolio includes mostly debt securities and other equity instruments that do not fit into the FVTPL, HTM or L&R portfolios and are held to sell when appropriate. The debt securities included in the AFS financial assets, in

2014 amounted €20,393 million, comprising government securities of which

€10,167 million were Spanish government securities, while €8,080 million were securities issued by foreign governments12. This shows that Sabadell has a

higher exposure to the Spanish Government, which makes it more vulnerable to the Spanish economy. Regarding the fact that there has been a decreased to the exposure of Credit Institutions, it seems that Sabadell is seeking for a more conservative policy in order to avoid unnecessary risk exposure to the financial sector (the government bonds yields were high and the probability of default much lower than for credit institutions, especially nowadays). This portfolio is hard to forecast in terms of evolution, because it is mostly an investment policy choice, but an increase in the item is not expected due to the fact that it impacts negatively the RWAs. Moreover during the last years the selling of the Spanish Government bonds has been generating big trading profits to the bank due to the decline in the bonds’ yields. So, it was projected for the portfolio to downsize slowly.

One of the key themes included in Sabadell’s Triple Plan is the Internationalization. Therefore, Tangible and Intangible assets captions were

forecasted to increase over the years (Chart 47). Although the Triple Plan will finish in 2016 and an acquisition was already done during 2015, it is expected, due to the improvement of the Spanish economy, that Sabadell’s tangible assets

will continue growing due to expansion in terms of branches and employees. On the other hand, intangible assets, which include goodwill, it is expected to increase for this matter as well and due to the needs of the banks to provide electronic access to its users as well as the computer software required for operations.

Certain amount of assets have been grouped in the caption Other Assets

(Appendix 1 Consolidated Balance Sheet), among them is the Non-current

assets held for sale which is composed by all the foreclosed assets of the bank.

The biggest item including in this caption is the repossessed assets, which as of

2014, amounted €3,110 million. As Chart 48 shows, non-current assets held for

12 Foreign Government Securities: Italian, US, Portuguese and Mexican governments.

Chart 53 –NII evolution (€ Mn)

Source: Company data and analyst’s estimations

Source: Company data and analyst’s estimations

Chart 50 - Revenues breakdown as a percentage of total revenues

Source: Reuters

Chart 51 – Euribor 12-month’s evolution from 1999 to 2015

Source: Reuters and analyst’s estimations

Chart 52 Euribor 12-month’s

Imagem

Table I  – Sabadell’s increases in scale  as of 2014
Table  IV  –   Long  term  credit  ratings  (S&P)
Table  VIII  –   Regulatory  requirements  comparison
Table  IX  –   Spanish  domestic  financial  institutions in-scope
+4

Referências

Documentos relacionados

However, Galp Energia has turned now its strategy to the upstream business (E&P) with a diversified portfolio of assets and activities divided across 10 different

Despite the harshening effects of the economic recession, it is highly unlikely that Portucel and other pulp and paper companies would bring its energy production to a

This costs as a percentage of total sales are expected to increase to 10% in 2018 in order to sustain its position in Kenya, Uganda and Tanzania and growth in South Sudan,

The division is divided into four sub-segments, each focusing on specific areas in the medical devices market; Imaging systems, Patient Care & Monitoring Solutions,

2006 Adidas acquired Reebok, which is now the second-most important revenue-. generating unit of the company. All other brands, like TaylorMade-adidas

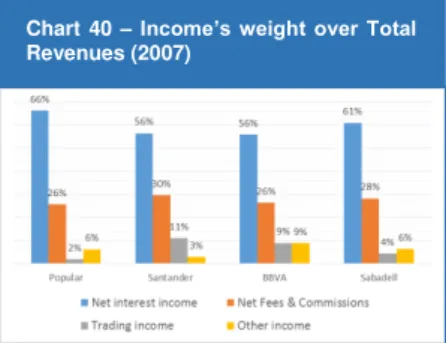
On year end 2014, Bankia held a market share of 8.4% in deposits from Spanish residents (excluding the Government and Credit Institutions) and also an 8.4% market share

Regarding its operating structure, Oceana’s core fishing business is the catching, processing, marketing and distribution of fishmeal, fish oil, canned fish,

The domestic activity (commercial banking, investment banking and others) is still the most important one, as it represents 77% 1 of the banking income of BPI, moreover,