THIS REPORT WAS PREPARED BY CATARINA VASQUES, A MASTERS IN FINANCE STUDENT OF THE NOVA SCHOOL OF BUSINESS AND ECONOMICS, EXCLUSIVELY FOR ACADEMIC PURPOSES. THIS REPORT WAS SUPERVISED BY ROSÁRIO ANDRÉ WHO REVIEWED THE
VALUATION METHODOLOGY AND THE FINANCIAL MODEL. ( D D )
North American airlines have not presented exceptional results in past years, and given the high volatility of the sector, these companies did not integrate most investors’ portfolio. With the sharp drop in oil prices, airlines were able to increase margins and profits. Several American companies are announcing share buyback programs in order to bolster investor confidence in the industry and return money to shareholders. This improved result allows many firms to have an organic growth, acquiring new aircrafts and opening new routes, without having to resort in high debt levels.
Hawaiian airlines has seen a strong growth in recent years, taking advantage of the favourable market conditions and growth in the tourism sector. Despite its lower installed capacity and brand recognition, the company presents high growth opportunities. The acquisition of 22 new aircraft will allow the operations expansion to unexplored and less competitive regions. This will let the company reinforce its positive results, and maintain a steady and moderate growth in the future.
Company description
Hawaiian Holdings, Inc. (HA) is a holding company, parent of Hawaiian Airlines, Inc. since 2002. The company is based in Honolulu as the largest Hawaiian airline and the 10th largest domestic airline in the U.S. It is engaged in the scheduled air transportation of passengers and cargo services, and carried more than 10 million passengers in 2015. The company offers flights amongst the Hawaiian Islands, to cities in the United States and to the South Pacific, Australia and New Zealand. The firm’s fleet includes currently 55 aircraft, which will be reinforced in the next years with the new A330-800neo and the A-321neo. This expansion will allow the firm to mature the existing routes and open new ones.
“
A
IRLINES
I
NDUSTRY
”
6 JANUARY 2017
S
TUDENT
:
“
C
ATARINA
V
ASQUES
”
[email protected]
U.S. Airlines with outstanding results
Low oil prices are driving the success
Recommendation: HOLD
Vs Previous Recommendation -
Price Target FY17: $60.37
Vs Previous Price Target -
Price (as of 6-Jan-17) $56.95
52-week range ($) 28.40-60.90
Market Cap ($M) 3043
Outstanding Shares (m) 53.43
Source: Bloomberg
Source:Bloomberg
(Values in $ millions) 2015 2016E 2017F
Revenues 2317.5 2409.6 2636.1
EBITDAR 587.4 716.1 709.5
EBITDAR margin 25.3% 29.7% 26.9%
Net Profit 182.7 260.9 264.4
EPS ($) 3.38 4.88 4.61
P/E 9.6x 11.7x 13.1x
Net Debt 490.6 255.7 223.9
ROIC 17.3% 23.5% 20.5%
ROE 41% 38.3% 31.1%
ROA 7.3% 10.1% 8.8%
Source: Company’s annual reports and individual analysis 80
100 120 140 160 180 200
jan-16 abr-16 jul-16 out-16 jan-17
52-week cumulative return: Hawaiian Holdings vs S&P500
HA US EQUITY SPX Index 76.3%
Table of Contents
EXECUTIVE SUMMARY ... 3
MARKET AND INDUSTRY OVERVIEW ... 4
COMPANY OVERVIEW ... 5
CORPORATE GOVERNANCE AND SHAREHOLDER STRUCTURE ... 7
OPERATIONAL ANALYSIS ... 8
REVENUES ... 8
OPERATING EXPENSES ... 8
PROPERTIES ... 9
DRIVERS AND RISKS ... 10
DEMAND AND TOURISM ... 10
OIL PRICE FLUCTUATIONS ... 12
AIRPORTS ... 13
ADVERSE PUBLICITY ... 13
STRATEGY AND COMPETITIVE ENVIRONMENT ... 14
STRATEGY... 14
COMPETITIVE ENVIRONMENT ... 15
NORTH AMERICA... 15
NEIGHBOR ISLANDS ... 16
INTERNATIONAL ... 17
VALUATION ... 18
INCOME STATEMENT ... 18
PASSENGER REVENUE ... 18
AVAILABLE SEAT MILES ... 18
LOAD FACTOR ... 19
PASSENGER YIELD ... 20
OTHER OPERATING REVENUES ... 20
FUEL EXPENSES ... 21
WAGES AND BENEFITS ... 22
EBITDAR ... 23
BALANCE SHEET ... 23
WORKING CAPITAL ... 23
CAPEX ... 24
DEBT ... 24
UNLEVERED FREE CASH FLOW ... 25
WEIGHTED AVERAGE COST OF CAPITAL AND EQUITY VALUE ... 26
MULTIPLES VALUATION ... 27
SENSITIVITY ANALYSIS ... 28
FINANCIAL STATEMENTS AND VALUATION KPIS ... 29
Executive summary
Despite the recent slowdown of the global economy, airlines’ industry is one of the fastest
growing industries, contributing directly for more than 1% of the global G.D.P. Hawaiian
Holdings is a holding company parent of Hawaiian Airlines, the largest airline in Hawaii
and the 10th largest in the U.S. In the last years, the company has been able to increase
its market position in both domestic and international markets through an organic growth,
achieving a market share of 2%. Favorable economic conditions and the increased
demand for the Hawaiian Islands, also contributed for a turnover increase of 18% over the
last 3 years. The company’s market value has also risen sharply (an increase of almost
80% in the last year), probably due the increased investor’s awareness of the company’s
growth potential. Hawaiian Airlines is still a relatively small company, but with its
expansion to other regions and its marketing alliances with other airlines, the company
can grow considerably. Return on invested capital (ROIC) reached a remarkable value of 17.34% in 2015, with the company’s earnings registering a growth of 80% from 2014 to 2015, which is mainly related to the reduction in fuel expenses. Given the company’s
current investments, ROIC is expected to remain slightly above the cost of capital in the
future, with a revenue growth between 5 to 10% until 2021, and EBITDAR margins
between 20 and 25%.
Hawaiian Airlines’ services are focused on the tourist segment, becoming more vulnerable to tourism fluctuations and demand shocks. In order to mitigate this risk the company
adjust prices, ensuring the maximum possible load factor and diluting the costs associated
with each trip. To evaluate the consequences of the occurrence of an extreme event, it
was performed a sensitivity analysis where it is possible to perceive the impact of a
permanent demand contraction -stock price would decrease to $47.
The company has financial derivative instruments to manage the exposure to changes in
jet fuel prices. However, there is no guarantee that this hedging strategy would smooth
any oil price fluctuations, which constitutes an important market risk. According to the
performed sensitivity analysis, ± 25% changes would lead to a stock price between $54
and $57, since part of the cost increase would probably be reflected in the fares growth.
Other risks such as additional airport fees or changes in wages were also analyzed and
would lead to a minimum price of $54.
In order to expand its operations, the company will acquire 22 aircraft in the coming years.
These purchases constitute large capital expenditures and will increase the company's
debt needs.
Taking into account that cash flows are expected to grow at a nominal rate of 2.5% in perpetuity, and the company’s cost of capital of 9.44%, Hawaiian Holdings’ share price is expected to be $60.4 within a year, representing a 6% return. The recent increase in the
company’s price seems to show that Hawaiian Holdings was being undervalued in the
past. My recommendation is to hold this stock, because despite the company’s growth
potential, Hawaiian Airlines operates in an extremely volatile sector. Besides, the recent
sharp rise in share prices it will hardly be sustained for a long time, and will probably begin
to stabilize. 55 54 59 57 47 38 67 67 63 64 74 73
25 35 45 55 65 75 85 95 Oil prices
Aveg. remuneration Price per avail. seat Airport rents Load factor Passenger Yield
HA share price sensitivity analysis ($) 0 10 20 30 40 50 60 70
jan-15 jul-15 jan-16 jul-16 jan-17 Hawaiian Holdings, Inc. (in $)
19622156 2315 2317 24102636
28273115 3263 3373 0 500 1000 1500 2000 2500 3000 3500 4000
Hawaiian Holdings total turnover (in million $)
158 238 287 486 277 207 0 3 6 8 3 2 0 2 4 6 8 10 12 14 16 18 20 0 100 200 300 400 500 600
2016F 2017F 2018F 2019F 2020F 2021F
U
n
it
s
Projected Net capex and acquisitions
Net Capex (in million $)
Market and Industry Overview
The world economy presented a slight slowdown in 2015, mainly due to political and financial instability and the deceleration of China’s economic activity. The slow growth in the mature markets, low oil prices and weak global trade lead to a modest economic outlook. World GDP is expected to grow at 2.9%, in an annual basis, over the next 20 years.1
The U.S. economy represents 20% of total global output, has the sixth highest nominal per capita GDP2 and is considered a “Goldilocks economy”, with moderate inflation rates and a 2-3% growth. This economy is recovering from a period of considerable turmoil, presenting now a solid labor market with low unemployment rates (4.6%, the lowest result since 2007) and rising real wages, which is boosting consumer confidence. Despite the increased pressure on business investment coming from the uncertainty of recent elections and low oil prices, the level of consumer confidence recently achieved its largest value since 2007, leading to an increased household spending. These improved consumption opportunities and strong monetary support will be translated in an average 2.3% GDP growth4 over the next 20 years, with citizens willing to increase spending on services such as travel and tourism.
Air transportation business contributes directly to 1.2% of the global GDP, and indirectly (including the contribution to employment and tourism) by 3%, with the major absolute contribution coming from the United States. This industry has an important impact on the economy by creating jobs, contributing to local economies or by connecting economies across the globe, favoring the international trade by enabling the flow of goods, people and technology. It is characterized by large costs, reduced profit margins, intense competition, considerable operating leverage, and has experienced some changes in the last decades. With the Airline Deregulation Act in 1978, air travel control partially shifted from the political to the market sphere. Before the deregulation, the investment and operating decisions were highly constrained under the Civil Aeronautics Board, imposing limits to routes and prices, and restraining the competition. As a consequence, prices were higher and load factors in the early 1970s were around 50%. Despite the boom-to-bust cycles felt since the deregulation, air travel has proved to be resilient to external shocks. Air carriers were able to develop new business models to minimize losses and increase operating revenues, attaining sustainable profits and creating a considerably different and renewed market. Now, companies compete in price and fares are much lower, flights are more frequent and present load factors around 80%.
1,3Source: Boeing – Current Market Outlook 2016-2035; 2 Source: International Monetary Fund (2015) 620 650 680 710 740 770 800 830
2005 2007 2009 2011 2013 2015 U.S. Air Transport, passengers carried
(in million) 74 76 78 80 82 84 86
U.S. Carriers Load Factor -Domestic and International flights
Domestic International
Graph II:
Graph III:
94 95 96 97 98 99 100 101 102 Oc t-0 6 Ju n -0 7 Feb -0 8 Oc t-0 8 Ju n -0 9 Feb -1 0 Oc t-1 0 Ju n -1 1 Feb -1 2 Oc t-1 2 Ju n -1 3 Feb -1 4 Oc t-1 4 Ju n -1 5 Feb -1 6 Oc t-1 6
Consumer confidence index
OECD United States
Graph I:
Source: OECD
Source: World Bank
Airline companies are also taking advantage of ancillary revenues, charging additional fees for baggage, food and other in-flight amenities as they differentiate themselves with new technological preflight or in-flight services. Air cargo services are also recovering as the global trade is expected to grow at rates of about 5% on average in the next years.
With low oil prices leading to a favorable cost environment, industry consolidation and strengthening demand, current circumstances are extremely positive for domestic U.S. airlines and net margins are improving globally. Airlines are taking advantage of this improved financial position to undertake investments that will allow future sustainable growth, such as acquisition of efficient aircraft, interior upgrades or operational improvements. This is expected to lead to a 4.5%4 global annual air traffic growth over the next 20 years,
Company Overview
Hawaiian Holdings, Inc. (HA) is a holding company that became the parent of Hawaiian Airlines, Inc. in 2002 when the company filed for Chapter 11 bankruptcy protection. Hawaiian Airlines Inc. was founded in 1929 and originally integrated under the name of Inter-Island Airways Ltd., changing its name to Hawaiian Airlines in 1941. It is engaged in the scheduled air transportation of passengers and cargo services. This is the largest airline in Hawaii and the 10th largest domestic airline in the U.S., based in Honolulu, Hawaii. The company offers different types of routes: flights amongst the Hawaiian Islands (the Neighbor Island routes); between the Hawaiian Islands and cities in the United States (the North America routes); and between the Hawaiian Islands and the South Pacific, Asia, Australia and New Zealand (the International routes). The company provides non-stop flights from the Hawaiian Islands to the main U.S. cities, offering approximately 160 daily flights between the Hawaiian Islands and a total of 212 flights per day to its 28 destinations.
Hawaiian Airlines emerged from bankruptcy ten years ago and is now presenting four times higher revenues, a doubled-size fleet still in expansion, an increased work force and consistently better results. In 2015 the company transported 10.67 million passengers, a 4.7% increase over the previous year, and registered 2,317 million in revenues, of which 1,775 million respect domestic flights.
Revenue from domestic flights increased 19% in last 2 years as a result of existing routes’ reinforcement (more frequent schedules between the islands and to the mainland). This improvement offsets the revenue decrease coming from poor international results, and led to a total revenue increase of 8% since 2013. Despite this good overall evolution, Hawaiian Airlines is responsible for only 2% Graph IV:
Source: Companies’ annual reports
of all U.S. Airlines’ traffic share. The company is deeply dependent on tourism fluctuations, since its services are focused on the leisure passengers’ segment – the largest but least profitable sector. New routes to international destinations will be launched in the next few years, taking advantage of the favorable international business’ conditions and new market opportunities, as will be clarified later. As of December 31, 2015, the company's fleet consisted of 18 Boeing 717-200 aircraft for the Neighbor Island routes, 8 Boeing 767-300 aircraft and 22 Airbus A330-200 aircraft for the North America, International and charter routes. It was also composed of 3 ATR42 turboprop aircraft for the ‘‘Ohana by Hawaiian’’ Neighbor Island service and 3 ATR72 turboprop aircraft for the expansion of the cargo service.
The firm aims to offer a unique travel experience, providing personalized services and diverse inflight amenities. It is oftentimes cited as a top quality airline, presenting over the last 5 years an average cancellation rate of 0.15%(versus an average rate from all major carriers of 1.75%), a delayed rate of 7.7%5 (versus an average rate from all major carriers of 18.1%), and zero fatality record.
Source: Information based on data submitted by reporting carriers.
5“A flight is considered delayed if it departed the gate 15 minutes or more after the scheduled d time as reflected in the Computerized
Reservation System.“
In order to maintain and improve these marks, the company is focused on operational excellence (rendering an irreproachable and unforgettable service to its customers), as well as on new contracts and agreements that will allow to a revenue increase. The fleet redesign and next years’ expansion will allow to the reinforcement of existing routes and creation of new ones, which are determinant factors in the strengthening of its business revenues that are expected to grow at a 5-10% rate in the coming years.
0% 5% 10% 15% 20% 25%
2010 2011 2012 2013 2014 2015
U
n
it
s
% of delayed flights per year
Hawaiian All Major Carriers
0,0% 0,5% 1,0% 1,5% 2,0% 2,5%
2010 2011 2012 2013 2014 2015
U
n
it
s
% of cancelled flights per year
Hawaiian All Major Carriers
Corporate Governance and Shareholder structure
Hawaiian Airlines follows an Anglo-US model of corporate governance, characterized by a well-developed legal framework defining the rights and responsibilities of three key players - management, directors and shareholders. It includes a Board of directors, four different committees - Audit, Compensation, Executive and Governance and Nominating - and an independent auditor (Ernst & Young LLP). The Board of Directors (“The Board”) is elected by the stockholders to oversee the management activity and guarantee the long term interests of the stockholders, appointing the several regulatory Committees under the direction of the Company’s Chief Executive Officer (the “CEO”), Mark B. Dunkerley. The Governance and Nominating Committee has the purpose of monitoring and overseeing matters of corporate governance, the Audit Committee is responsible for assisting the Board to ensure integrity of the company’s financial statements and other financial information and the Compensation Committee is responsible for evaluating the company’s compensation policies, plans and programs. Given that this is a large-scale business with several shareholders, it is of the utmost importance to ensure that management is acting in the best interests of the shareholders, as well as the company itself. The structure presented, with the existence of several regulatory committees, optimizes the control and success of the company’s decisions.
As of 5th December 2016, Hawaiian Airlines has 53.43 million shares outstanding. In the last 5 years, the number of shares ranged from 50.73M in Dec. 2011, to the maximum of 54.87M in June 2015. The company’s aggregate intrinsic value of stock options outstanding as of December 2015 was $3.1 M. The insiders hold 3.4% of the company’s outstanding shares of which 1% belongs to the CEO. Institutional investors and hedge funds, comprised of 314 different holders, own 89.95% of the company’s stock. The Hawaiian Holdings stock is currently traded at the Nasdaq Stock Exchange. The terms of some financing agreements restrict the company’s ability to incur in additional debt or issue preferred stock. Additionally, due to financing and aircraft lease agreements’ provisions, the company is not able to pay dividends on its common stock and does not anticipate the payment of periodic cash dividends in the foreseeable future. Nevertheless, the company is returning money back to shareholders through a share repurchase program, using part of its cash flow to buy back shares, yet still keeping an abundant amount of excess cash. This makes some investors believe that the company is renegotiating some of the lease agreements, and will start to return cash to shareholders through the distribution of steady dividend offering a 1% to 2% yield.
Institutional investors
Ow ner nam e Ow nership
VANGUARD GROUP, INC. 11%
AJO, LP 6%
BLACKROCK FUND ADVISORS 6%
DIMENSIONAL FUND ADVISORS LP 5% RENAISSANCE TECHNOLOGIES LLC 4%
Others 68%
Institutional 90% Non-Institutional
10% Graph VII Shareholder structure:
Table I:
Source: Nasdaq companies’ information
Operational Analysis
RevenuesCompany’s revenues come from the scheduled passenger traffic and the ancillary
revenues that include the cargo business and value added products. In the last
few years, these additional revenues have been gaining more relevance,
accounting for 12.5% of the total revenue in 2015, which represents an increase of
2.6% over the last 2 years. International revenues have been losing weight, with a
decrease of almost 7% since 2013. Since Japan is the most relevant international
market for the company and the Japanese demand for the Hawaiian Islands
dropped 2% last year, this contributed to the loss in international revenues.
Hawaiian Airlines carried 10 million passengers during 2014, raised this number to
10.7 million in 2015, and will probably surpass 11 million in 2016, which
represents a considerable operational growth. Company’s revenues are expected to follow this positive trend, driven by the increase on consumer’s confidence, and the willingness to spend more on travel and tourism. The demand for the Hawaiian
Islands is increasing overall (5% in 2015)6, and the market is adjusting to receive
new visitors, with a capacity increase of the accommodation units of 5% in 20157.
The passenger yield (average fare paid per mile, per passenger) suffered slight
variations in last years, ranging from $0.142 in 2013 to $0.14 in 2015, after an
increase to $0,147 in 2014. This parameter is partly related to the fuel costs
variation, demand for air travel, inflation rate and competitive pressures. It is
adjusted in order to fill the maximum amount of seats (load factor) and dilute fixed
costs. The load factor was kept approximately constant, changing from 81.5% in
2013 to 81.6% in 2015. Prices are expected to suffer a decrease caused by the
competitive pressure mainly from the Low Cost Carriers (LCC), which despite not
being a direct competitor, cause a domino effect in every airline. This affects
positively the demand for air travel and more specifically for Hawaiian Islands,
resulting in a slight higher load factor in the following years.
Operating expensesHawaiian Airlines is subject to two main operational expenses, fuel and labor
costs. Aircraft fuel expenses are highly dependent on oil cost fluctuations, which
affect jet fuel prices. In the last few years, these expenditures constituted the main
cost driver, but with the fuel price decrease of almost 50%, they accounted for
only 23% of total expenses in 2015 (not considering losses on fuel derivatives),
leading to a positive impact on the firm’s results with a cost saving of $281 million.
1943 2045 2026
213 270 292
0 500 1000 1500 2000 2500
2013 2014 2015
U
n
it
s
Passenger revenue Anciliary revenue
1,493 1,683 1,775
663 631
542
2.156 2.315 2.317
-500 1,000 1,500 2,000 2,500
2013 2014 2015
Domestic Pacific
699 678
418
2.92
2.70
1.52
-0.50 1.00 1.50 2.00 2.50 3.00 3.50 4.00
-100 200 300 400 500 600 700 800
2013 2014 2015
Aircraft fuel expenses and jet fuel price
Aircraft fuel ($ in millions) Jet fuel price ($)
Graph VIII:
Graph IX:
Graph X:
Source: Company’s annual reports
Source: Company’s annual reports
6,7 Source: Hawaii Tourism Authority – 2015 Annual Visitor Research Report
Source: Company’s annual reports and “eia”
EBITDAR margins also suffered a considerable increase, 2015 presented a
margin of 25%, and this value is expected to range from 20-30% over next
periods. In 2016, the expectation of an even greater drop in fuel prices will result
in a fuel expense reduction of more than $60 million. Since the prices are not fully
adjusted to this cost reduction, unlike what happens in the LCC segment, this
represents an opportunity for higher margins and profitability (the slight price
reduction was historically more than compensated by a higher demand and
consequent load factor growth).
The costs related with wages and benefits represented 27% of the total expenses
in 2015. The number of employees increased 6% in the last 2 years, but there was
an increase of 17% in the labor expenses due to salaries increases. Hawaiian Airlines has a cost per employee of $90,034, which is below the competitors’ average of $94,329. Given this, the normal wages growth, annual inflation and the
company’s expansion, it is expected that this expense will increase over the next
periods. Consequently, wages and benefits’ expense will constitute the main cost in the following years, as already shown by the results of several other airlines.
Maintenance materials and repairs also constitute an important source of
expense, accounting for 12% of total costs in 2015. Since 2013 these costs
experienced an increase of 10% due to fleet expansion, and are predicted to
continue growing in absolute terms over the next few years as the number of
aircraft in the fleet increases. Hawaiian Airlines has a cost per aircraft and per
available seat that is twice the competitors’ average cost, which may be partly related to the fleet’s average age of 10.2 years, slightly higher the competitors’ average of 9.7 years. This cost is expected to decrease every year, as the
company acquire new aircraft that do not need so much maintenance, and due the
centralization and reduction of some costs.
Aircraft rent related to the company’s operating leases increased 7% since 2013 due the new A330-200 agreement. These rents don’t have a material impact as the company owns most of its aircraft (only 25% of the fleet is under operating
leases), and plans to increase the fleet mainly through purchases and capital
lease agreements. As a result, this expense should not be significantly increased
over the next few years, maintaining the proportion in relation to total costs.
Airport expenses, including rentals and landing fees, increased 17% from 2013 to
2015 due to modernization of Hawaiian airports, and are expected to follow this
trend. Expenses related to the modernization are specific to companies operating
in Hawaiian Islands, and since Hawaiian Airlines has its operations centralized at
these airports is more vulnerable to these increases, which constitute a
competitive disadvantage.
427
447
500
5249
5380
5548
5000 5100 5200 5300 5400 5500 5600
380 400 420 440 460 480 500 520
2013 2014 2015 Personnel expenses and nº of employees
Personnel expenses (in million $) Nº of employees
1.6
2.0 2.2 2.3 2.3
1.0 4.2
0.0 0.5 1.0 1.5 2.0 2.5 3.0 3.5 4.0 4.5
2015
Cost per aircraft (in million $)
Alaska Airlines American Airlines Delta JetBlue United Virgin America Hawaiian Airlines
26%
27% 12%
6% 5%
24%
Breakdown of operating expenses
Aircraft fuel Wages and benefits Maintenance materials Aircraft rent Rentals and landing fees Others
FY15
Graph XI:
Graph XII:
Graph XIII:
Source: Company’s annual reports
Source: Company’s annual report
Other expenses include aircraft and passenger servicing of $117.45M in 2015,
commissions and other selling of $119.75M, purchased services of $81.84M and
other costs accounting for $114.16M. These expenses are expected to increase in
line with operations.
PropertiesHawaiian airlines owns most aircraft, but also has assets under operating (14
aircraft) and capital (3 aircraft) lease agreements. The company’s fleet increased from 47 aircraft in 2013 to 54 in 2015. This growth is the realization of the
expansion plan aiming to provide new routes and an increase in the number of
scheduled flights. The company has purchase rights to buy new aircraft in the next
years, which will introduce two new models in the fleet, the A330-800 neo and the
A-321neo. These commitments will have a positive effect on operational results,
but will also impact the contractual obligations and the company’s leverage.
Drivers and Risks
As any global industry, the aviation sector is subject to several internal and external factors that may jeopardize business growth, good operational performance and financial condition. Hawaiian Airlines is not an exception and needs to manage these features in order to ensure the business’s viability.
Demand and TourismHawaiian Airlines has its main base of operations in Hawaii, which is essentially a tourist and holiday destination. This makes the company’s operational results highly dependent on the number of travelers to Hawaiian Islands. Tourism is the largest single source of private capital into the Hawaii economy and comes essentially from the U.S. East and West coasts (21% and 41%, respectively), Canada (6%), Japan (17%), Oceania (5%) and Other Asia (5%). Demand from each one of these markets increased last year between 4-8%, with exception to the Japanese and Canadian markets that showed a contraction of approximately 2%. This negatively impacted Hawaiian Airlines' international operations since Japan is one of the company’s most significant international markets.
99% of visitors arrive by air, and the most choose the Islands as a holiday destination, constituting the main segment of company’s operations, with only 6%
Properties ow ned and under leasing agreem ents
Aircraft Leased Ow ned Leased Ow ned Leased Ow ned
A330-200 7 7 7 12 10 12
767-300 6 6 6 4 4 4
717-200 3 15 3 15 3 15
ATR turboprop 0 3 0 3 0 6
16 31 16 34 17 37
Total 47 50 54
2013 2014 2015
55 60 65 70 75 80
Hawaii Visitors - Arrivals by Air (in million)
Graph XIV:
of visitors coming for business purposes such as meetings or conventions. This type of traffic flow is more elastic than the business passengers’ segment, and essentially depends on the economic activity (employment conditions, disposable income and other macroeconomic indicators). Due the global financial crisis in 2007-2008, families’ disposable income decreased leading to a reduction in travel expenses, negatively affecting islands’ tourism level (see graph XIV). Besides, high fuel prices at those times forced up airfares, making a vacation in hawaii out of reach for many Americans. Open air services and local market conditions also constitute important demand drivers. These conditions may be related to political and economic climate, availability of accommodation units, local events, and other factors such as natural disasters, safety, security or seasonality patterns. The availability of accommodation units is increasing every year, and although most visitors opt to stay in hotels8 (more than 50%), new forms of accommodation are appearing to answer this growing demand, such as vacation rental units, condominiums or timeshare places. With these new accomodation options it is possible to mitigate some negative effects coming from adverse events, such as natural disasters that may affect the hotel units normal functioning and lead to temporary interruptions.Hawaii is considered a safe place but given its location and geological conditions, it is sometimes affected by natural disasters such as flooding, hurricanes, tsunamis, lava flows and earthquakes. Some of these events are frequent but happen in remote locations and do not have material effects, as happens with some hurricanes that are dissipated upon approaching the islands. These are some of the most frequent and devastating disasters, as the Hurricane Iselle in 2014, that led to the cancellation of several flights and closure of services, but fortunately had no significant consequences on the Island’s tourism and economic levels. In fact, 84% of tropical cyclones occur in the third quarter of the year, when the Island receive more tourists and Hawaiian Airlines’ revenue levels are higher. Tornadoes are very frequent but are often dissipated, and large earthquakes or tsunamis are quite rare. All of these events are part of the Island’s normal conditions, and are easily mitigated to avoid effects on local economy and tourism levels. Hawaiian Airlines has been able to maintain its operations, as it is possible to observe on the graph XVI, where last years’ disasters are represented. It is true that an exceptional large-scale event affecting directly the company could negatively impact short and long term results, however the probability of such event is considered to be very small, and the company's results are not expected to be affected by these type of occurrences. Besides, Hawaiian Airlines is considered one of the world’s safest airlines9, which contributes directly for the
41%
21% 17%
6%
2% 5%
5% 3%
Visitor Arrrivals by air
U.S. West U.S. East Japan Canada Europe Oceania Other Asia Latin America Other
Graph XV:
Graph XVI:
Source: Hawaii Tourism Authority
Source: Hawaii Tourism Authority
8 The statewide hotel occupancy rate for 2015 was 78.8%;
company recognition. This has a positive impact on the demand for this destination, and contributes to a satisfactory experience, with more than 80% of visitors considering the island experience as excellent, and more than 90% recommending this holiday destination. Tourism is also subject to seasonal and cyclical volatility mainly due to passenger leisure and holiday travel patterns. Demand usually decreases in the first quarter of the year and has a considerable increase between June and August. To overcome these fluctuations, airlines adjust prices and schedules to achieve optimal load factors, and maintain its operations levels.
Oil price fluctuationsOil price expenses greatly impact the company’s operating performance with the fuel expenses accounting for 23% of operating costs, in 2015. Jet fuel is a type of aviation fuel designed for use in aircraft powered by gas-turbine engines and is used in Hawaiian Airlines’ aircrafts. In 2015, the price dropped abruptly due to many factors, including the strong U.S. dollar; the overproduction of the OPEC oil Cartel, which is unwilling to stabilize the oil market; the Iran nuclear deal which allowed Iran to return to the oil market; and the oversupply of and decline in demand for crude oil, which is directly related to the deceleration of China’s economy (the world’s largest oil importer). This is probably the most volatile expense, and the one that most influences aviation companies’ results. Oil prices’ decrease positively affected the whole sector in 2015, with Hawaiian Airlines’ recording a return on invested capital (ROIC) of 18% (an increase of 100% over 2014), a return on equity (ROE) of 41% (an increase of 118% when compared to 2014) and an EBITDAR margin of 25% (an increase of more than 50% over 2014). Other aviation companies also reached record levels in terms of profitability, as is the case of Alaska Airlines that registered a ROE of 35.2%, Delta Airlines of 41.7%, JetBlue had a more modest growth and achieved a value of 21.1%, and United Airlines had a growth of more than 70% with a return on equity of 82% in 2015. On average, these companies were able to reduce fuel costs by 36% - Hawaiian Airlines was able to do a bit better and record a reduction of 38%. The company purchases aircraft fuel at prevailing market prices and manages the risk of fluctuations through implementation of a hedging strategy – entering into derivative financial instruments, such as heating oil puts and swaps, crude oil call and put options and collars. However, fuel derivatives’ effect should be insignificant in the long run, making important for the company to be able to react to oil prices’ changes by adjusting fares and costs, for example.
It is difficult to predict oil price evolution, but prices are expected to remain low in the short term and start rising slightly thereafter, leading to a margin reduction in the long run (EBITDAR margin is expected to be around 20% in 2021).
0 20 40 60 80 100 120 140 160 Ja n -0 6 S e p -0 6 May -0 7 Ja n -0 8 S e p -0 8 May -0 9 Ja n -1 0 S e p -1 0 May -1 1 Ja n -1 2 S e p -1 2 May -1 3 Ja n -1 4 S e p -1 4 May -1 5 Ja n -1 6 S e p -1 6
WTI curde oil - price p/ barrel ($) Graph XVII:
Graph XVIII:
Source: FRED Economic Data
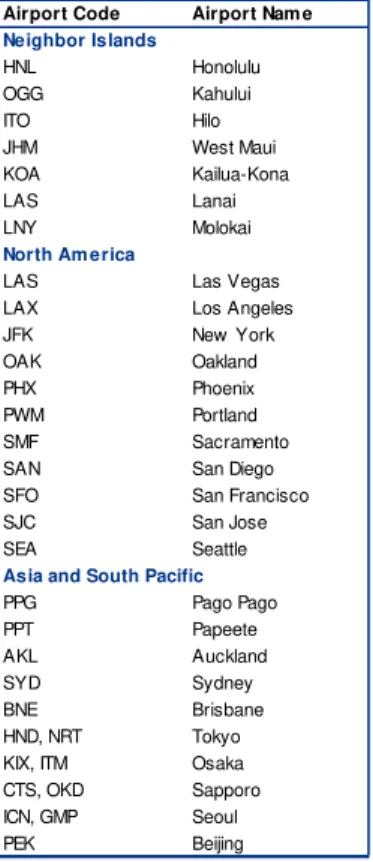
AirportsHawaiian Airlines has a considerable part of its operations dependent on the availability and conditions of the Honolulu airport, which serves as a crossing point for almost every flight (the company has 58% of the airport market share). Hawaiian airports are going through a renovation and modernization plan that implies increased landing fees and airport rent rates. These fees increased more than 30% over the last 5 years, and although they only contribute to 5% of total expenditures, this constitutes an additional expense that may affects the company’s performance because of the concentration of neighbor island operations. These renovations may also create congestions and flight delays, which may disturb the company’s regular flights and schedules. So far this has not been a problem, and the company continues to have the lowest cancellation and delayed flights rate.
In the North American routes, Hawaiian Airlines has flights to some of the world’s most crowded airports such as “LAX” in Los Angeles, “SFO” in San Francisco or the “LAS” in Las Vegas. The same happens with some of the company’s international flights for the “PEK” in Beijing, “HND” in Tokyo or the “ICN, GMP” in Seoul. Congestion in these airports may cause barriers to the company’s operational growth, but given the low number of daily flights operated to these destinations, and the creation of new routes to more remote locations, Hawaiian Airlines’ results don’t should be harmed by these congestions. However, to prevent these airport complications and efficiently operate and grow the proposed flight schedules, the firm should maintain adequate gates/facilities at the airports and reinforce its strategy of new routes’ creation to destinations with lower competition and more availability.
Adverse publicityAdverse news and events such as accidents or shortcomings in customer service or bad business conduct may negatively affect the company’s operations and the willingness of customers to purchase their products. An egregious incident may result in a temporary or permanent loss of revenue, as happened to Malaysia airlines after the incidents in 2014, or to AirAsia after the incident in the same year. Hawaiian Airlines never faced an event like this, however due its relatively small size, an accident could have short and medium-term consequences and even affect tourism levels in some places served by the company.
There are additional risks that may affect company’s results. Labor costs are a significant part of the total expenses and are dependent on labor unions requests, which makes important to maintain a good relationship with these unions to avoid work disruptions or labor costs’ increases.
Airports Serviced by Haw aiian Airlines Airport Code Airport Nam e Neighbor Islands
HNL Honolulu
OGG Kahului
ITO Hilo
JHM West Maui KOA Kailua-Kona
LAS Lanai
LNY Molokai
North Am erica
LAS Las Vegas LAX Los Angeles JFK New York
OAK Oakland
PHX Phoenix
PWM Portland SMF Sacramento SAN San Diego SFO San Francisco SJC San Jose
SEA Seattle
Asia and South Pacific
PPG Pago Pago
PPT Papeete
AKL Auckland
SYD Sydney
BNE Brisbane HND, NRT Tokyo KIX, ITM Osaka CTS, OKD Sapporo ICN, GMP Seoul
PEK Beijing
Hawaiian Airlines 58% United Airlines
16% Delta Airlines
9% American Airlines
7% Alaska Airlines
5% Others
5%
Largest Airlines at HNL Airport in 2015
Graph XIX:
Table II:
Government regulations may impose additional laws and charges, and with the business expansion to non-U.S. jurisdictions, the scope of laws that the company is subject to increases, and may result in additional expenses.
Airline companies are dependent on a limited number of suppliers for aircraft, which increases the company’s vulnerability to problems associated with the supply of these materials.
Since this business requires access to financial markets in order to finance equipment purchases and to provide liquidity in periods of weaker sales performance, the uncertainty of the global credit market may result in availability constraints or unfavorable terms and conditions, which may limit the company’s flexibility to react to business and industry changes. The significant company’s amount of debt may include covenants that impose restrictions the regular operations and may restrict the issue of common stock or dividend payments. With the international expansion of the company’s routes, fluctuations in foreign currencies can have a material impact on operations and financial results. To manage this risk the company enters into foreign currency forward contracts. Overall, Hawaiian Airlines has been able to mitigate its risks. However, there are some factors that are difficult to predict or control such as the possibility of a global economic crisis, an aviation accident, a large-scale natural disaster or even sharper fluctuations on oil price. The occurrence of one of these factors would have a great impact on company’s results, by directly affecting revenues or operational expenses. These fluctuations have a low probability of occurrence and for that reason are not incorporated in our valuation, but will be reflected in the sensitivity analysis.
Strategy and Competitive Environment
Strategy
The company is engaged in a route and network maturation strategy which includes the reinforcement of existent routes (with additional schedules and/or the inclusion of new or bigger aircraft) and creation of new ones to unexplored destinations. Capacity expansion should improve operational results and dilute some costs. However, this second effect is reduced since the major part of expenses are variable, depending on the schedules operated, and the margins are usually kept approximately constant. Larger companies don’t present higher EBITDAR margins, as is the case of American Airlines, Delta or United Airlines, that present the lowest margins of the sample, 22% 24% and 20%, respectively. This may indicate that the advantage of capacity increase lies on the revenues 31%
22%
24% 26% 20%
27% 25%
0% 5% 10% 15% 20% 25% 30% 35%
EBITDAR margin 2015 EBITDAR margin by company in 2015
Alaska Airlines American Airlines Delta JetBlue United Virgin America Hawaiian Airlines
Graph XX:
growth and improved market power rather than in the creation of economies of scale and increased margins.
More than this, to be successful it is important to understand how to use and take advantage of the increased capacity provided by the new aircraft, hire and retain skilled personnel and manage new assets in an efficient manner.
Hawaiian airlines is driven by operational excellence, receiving yearly recognitions and awards, such as “Best U.S. Airline”, “Best Food”, “Best customer service, “Best leisure airline” and even the “World’s most punctual airline”. The company will strive to maintain these recognitions, focusing on this operational quality and developing new services focused on the tourism segment. These additional services will result in ancillary revenues, which are also an important part of the recent strategy and constitute 13% of total revenues in 2015 (an increase of almost 30% in the last 3 years). With the creation and improvement of pre-flight and in-flight services, the company can stand out, provide better quality services and take advantage of these additional revenues.
Cost control is also an important matter, since it allows the company to offer competitive fares to passengers while maintaining reasonable profit margins and to take advantage of market opportunities. To do this, Hawaiian Airlines is replacing old aircraft by new and more efficient ones, and centralizing some operations, reducing the number of employees per aircraft (#102 in 2015, representing a decrease of 8% through the last 2 years).
Competitive environment
Despite the competitive environment where Hawaiian Airlines operates, it is difficult to assess the company’s direct competitors. This firm operates in a very specific niche, since do not exists other airline company offering so focused services in the Hawaiian Islands. However, it is possible to identify competing companies offering similar flights in each one of the regions operated, as well as identify their main features, strategies and business advantages.
North AmericaOn the North America routes, it is possible to highlight as main competitors companies such as Alaska Airlines, American Airlines, Delta, JetBlue, United and Virgin American. The majority of these competitors have a larger and constant market share, more financial resources and brand recognition, making the company vulnerable to their decisions and strategies. These companies can exercise its market power to influence prices, which do not vary much from company to company (see graph XXIII). Additionally, Hawaiian Airlines presents a low geographic diversification in comparison to its North America competitors, which increases company’s vulnerability to external shocks.
0% 5% 10% 15% 20% 25% 30% 35%
0 5000 10000 15000 20000 25000 30000 35000 40000 45000
Un
it
s
U
n
it
s
Revenues and EBITDAR margin per company
Total revenue (in million)
EBITDAR margin 2015
117
109 112
108
103
95 100 105 110 115 120
Employees per aircraft Nº of employees per aircraft
over the last 5 years
2011 2012 2013 2014 2015 Graph XXI:
Graph XXII:
Graph XXIII:
Graph XXIII:
Source: Companies’ annual reports
Source: Company’s annual reports
American Airlines 22%
Delta Airlines 19%
United Airlines 17% Southwest
21% jetBlue
6% Alaska
5% Hawaiian Airlines
2%
Others 8%
Companies' market share in the domestic region (2015)
Large network carriers are adjusting their routes in order to compete with the low-cost carriers (LCC) by diverting resources to Hawaii, where the LCC competition is less evident. The West Coast market is ultra-competitive, and the flights connecting the Hawaiian Islands with this coast account for about half of Hawaiian Airlines’ revenue. Companies such as Alaska Airlines are contributing to the increase in the industry capacity, expanding their operations to the Hawaiian Islands. This rapid supply growth drove down fares, but is now starting to stabilize. The acquisition of Virgin America by Alaska Airlines will improve its position in Hawaii, as Virgin America offers flights from different cities to the Hawaiian Islands. All of these companies regularly fly to Hawaii, providing an alternative to Hawaiian Airlines flights, and sometimes offering flights from cities where the company does not operate. In these cases, Hawaiian Airlines needs to rely on code-share partners to provide customers access to these destinations. The new routes created by these competitors to meet the growing demand for the Hawaiian market, constitute an additional challenge, which has led Hawaiian Airlines to increase the investment in this market through expansion in the fleet and scheduled flights. The company has been successful in this allocation, presenting a domestic market growth of 4% from 2014 to 2015.
Neighbor Islands“In Hawaii, flying is king and competition is fierce.”10 With its population spread
across the different islands, the state of Hawaii is solely dependent on air travel, andHawaiian Airlines is the original airline in this market. The company has been flying amongst the islands since 1929 and to the mainland and other international destinations since the mid-1980s. The firm has such frequent services that some routes, such as Honolulu (HNL) to Kahului (OGG), have more than 20 flights per day, providing the company with a dominant market share (90%) on these inter-island routes. Neighbor Island routes represent approximately 25% of the passenger revenue, and despite the strong competitive position in this area, other companies are introducing new routes, decreasing Hawaiian Airlines’ traffic share. Hawaiian airlines main competition comes from two airlines, Island Air and Mokulele Airlines. The first one maintains a hub in the commuter terminal at Honolulu International Airport with flights to Lihue and Kahului, two other major airports, and it is also able to serve smaller runways in Lanai. Island Air provide the cheapest inter-island flights, operating with older and less modern aircraft than Hawaiian Airlines. The second one essentially connects the main airports (Honolulu, Kahului and Kona) with the smaller ones- the islands of Lanai and Molokai and the Kapalua and Hana airports.
10 Source: Airline Reporter – The fascinating and turbulent state of Hawaii’s airlines
0.0 2.0 4.0 6.0 8.0 10.0 12.0 14.0 16.0 18.0
U
n
it
s
Passenger Yield (in cents) per company in 2015
Seats capacity by company
Com pany Total
Passenger per aircraft
Total capacity Mokulele Airlines
Cessna 208B Grand Car. 4 9 36 Cessna 208EX Grand Car. 11 9 99
15 135
Island Air
ATR 72-212 5 64 320
5 320
Haw aiian Airlines
Boeing B-717 18 128 2304
ATR 42-500 3 48 144
21 2448
Table III:
Source: Companies’ annual reports
Source: Companies’ websites and public
information
Mokulele’s has the smallest fleet, which allows for an exceptional position in the inter-island marketplace, having access to small airfields that cannot handle larger airplanes. Despite the different features of each company, Hawaiian Airlines still has a competitive advantage and a much bigger capacity to operate these routes. With the recent ATR turboprop acquisitions, the firm is able to operate in smaller airfields, capture new routes and keep its competitive position.
InternationalHawaiian Airlines’ international routes are all located in the Pacific and constituted an obstacle for the company’s results during last years, because of the falling fuel surcharges, which impacted the price negatively (yield on international routes decreased from 12.5 cents in 2014 to 10.9 cents in 2015), the strong dollar and contraction of Japanese demand
.
In 2015, the international revenue decreased14%, with only 23% of the company’s revenues coming from the international market. Nevertheless, Hawaiian Airlines has been able to keep its market share on these regions, having 6% of the pacific market operated by domestic companies. The main competitors on these routes include domestic (American Airlines, Delta and United Airlines) and foreign carriers (Qantas, China Airlines, China Eastern, Korean Air, etc.) that have joined airline alliances. Considering that the company does not integrate any of these global alliances, it needs to rely on code-share agreements to provide customers access to additional international destinations unserved by the company. Despite the recent Japanese demand contraction, the company is expanding to this destination and is planning to open new flights to Narita Airport, as well as reinforce flights to Tokyo’s Haneda Airport, which should lead to a revenue recovery in this market. Hawaiian’s most important U.S.-based competitor on international routes is Delta Airlines, which also operates the Hawaii-Tokyo and Hawaii-Osaka routes and was also affected by adverse macroeconomic conditions. Delta is dramatically cutting the capacity on these courses, which should be materialized in higher fares for all the competitors on this route. In the Australian market, airlines were increasing capacity to meet rising demand from tourists taking advantage of the strong Australian dollar. However, this demand is now falling due the weaker currency, and some companies, such as Jetstar, have already announced the suspension of some Hawaii-Australia routes. With the retirement of Jetstar capacity, Hawaiian Airlines may recover its monopoly position on flights from Brisbane to Hawaii and increase this route’s fares (international yields are currently 28% lower than domestic yields). Considering this, the opening of new routes and emergence in new markets, the company is expected to recover its international revenues and capture additional market share.
American Airlines 24%
Delta Airlines 23% United Airlines
22% Southwest
14% jetBlue
5% Alaska
4% Hawaiian
2% Others
6%
Market share of domestic companies on international routes (2015)
American Airlines 15%
Delta Airlines 32% United Airlines
47%
Hawaiian Airlines 6%
Market share of domestic companies in the pacific region
Graph XXV:
Graph XXVI: Source: Companies’ annual reports
Valuation
In order to find the “HA” price per share, it was necessary to forecast an income statement and balance sheet for every fiscal year through 2021. This is the last year considered since it is expected that the expansion program stops by then with a consequent steadying in the revenue’s growth rate. The operational margins and the CAPEX levels are also expected to be stabilized at that time. The company’s operational cash flows were estimated for the next 5 years, after that (2022 onwards), a perpetuity formula of cash flows was applied and everything was discounted for the present.
Income Statement
Revenues
The company's revenues have two main sources, passenger revenues (scheduled operations) and other operating revenues (ancillary revenues).
Passenger RevenuesPassenger revenue was estimated and forecasted using the following approach:
Where,
RPM (Revenue Passenger Miles) = Available Seat Miles (ASM) × Passenger Load Factor
ASM = Number of available seats × Average miles flown per seat
Passenger Load Factor - Represents the proportion of airline output that is actually
consumed;
Passenger Yield - Measure of average fare paid per mile, per passenger.
Available Seat MilesIn order to estimate the number of seats available, it was necessary to analyze the fleet for the next 5 years, considering the delivery of new aircraft and the disposal of aircraft in use. In 2015, Hawaiian Airlines’ fleet was composed of 54 aircraft, and this number is expected to grow approximately 37% through 2021. The company ordered 16 Airbus 321neo aircraft to be delivered between 2017 and 2020, and has orders to purchase 6 Airbus 330-800neo with expected delivery dates between 2019 and 2021. Furthermore, the firm will receive aircraft under capital and operational lease agreements in the period under analysis. Hawaiian Airlines is not planning to order additional aircrafts after 2021, at least in a short term horizon. During the next 5 years, the company will retire 1 Boeing 717-200 per year - the oldest aircraft in the fleet, used in the Neighbor Island service. The
Passenger Revenue = RPM × Passenger Yield
New aircraft delivery schedule
Aircraft 2017 2018 2019 2020 2021
A321neo 3 6 6 1
A330-800neo 2 2 2
Total 3 6 8 3 2
Table IV:
Airbus 321neo will strengthen routes to the busiest airports in North America, as well as provide direct flights to the Neighbor Islands from popular gateways on the U.S. West Coast. The Airbus 330-800neo is a fuel efficient and long-range aircraft that will complement the wide-body existing fleet - twin aisle aircraft used for long-haul flying on the North America and International routes. These acquisitions will allow the company to operate more efficiently (with a fuel saving per seat), reinforce existing routes (essentially for North America and Neighbor Islands), expand the international ones and reach new markets with lower competition, allowing the company to charge higher tariffs (mainly on the international routes) and have higher margins (EBITDAR margins are expected to remain above 20% in the next few years).
Regarding the aircraft capacity, each Airbus 330-800neo can carry 257 passengers, while the 321neo has capacity to transport 185 passengers. The Airbus 330-200 is the aircraft with the highest capacity in the fleet, with 294 seats, and the ATR turboprop is the smallest one with only 48 seats, used principally for the cargo service between Islands. The number of available seats is expected to grow from 11,418 in 2016, to 15,406 in 2021, representing a growth of 32%. The average number of miles flown by each seat was evaluated based on the last years of operations, considering that this value is quite stable, an average with slight adjustments was computed. These adjustments were only applicable to years of elevated growth on available seats (from the introduction of new aircraft in the fleet) since the company may not be able to put the aircraft in operation immediately. Overall, each seat flies an average of 1.61 million miles.
Based on these conclusions, the available seat miles are expected to increase from 18,382M in 2016 to 24,494M in 2021.
Passenger Load FactorThe airline industry is characterized by high costs and low margins, granting great
importance and impact to the load factor. This factor depends on the seats
available, the demand for those seats and average rates charged. In order to
dilute the costs associated with each flight, companies always try to fill as many
seats as possible, adjusting prices in order to adapt for demand and supply
shocks. In this sense, the load factor would always present a constant and highest
possible value. However, there are other factors that may influence price level, as
is the case of inflation or the cost per available seat. In these cases, price
fluctuations may influence the load factor constant level, as has happened
recently due the accentuated drop in oil prices. In 2016, companies greatly
reduced their prices, leading to a growth on demand and tourism levels, which
was reflected in significantly higher load factors. Hawaiian Airlines reported an
55 60 64 71 73 74
11418 12229 12953
14449 15020 15406
0 2500 5000 7500 10000 12500 15000 17500
0 10 20 30 40 50 60 70 80
2016F 2017F 2018F 2019F 2020F 2021F
U
n
it
s
Un
it
s
Projected fleet and available seats
Fleet (#) Available seats (#)
A330-200 294
767-300 258
717-200 128
ATR turboprop 48
A330-800 neo aircraft 257
A 321neo aircraft 185
Available seats per aircraft
82%
81% 81%
84%
80% 80% 81% 81% 82% 82% 83% 83% 84% 84%
2013 2014 2015 2016
Last year's average load factor for the first 3 quarters
Graph XXVII:
Table V:
Graph XXVIII:
Source: Company’s annual report and
individual analysis
Source: Aviation companies websites
average load factor for the 3 first quarters of the year of 83.6%, considerably
higher than the 81% registered last year, for the same period under analysis. Analyzing these variables’ historically impact, it was possible to adjust and forecast their effect in the future, and estimate load factor’s for the next few years. It is expected load factor increase in 2016 (related to the lower fare prices) and a
stabilization in the long run, converging to a value approximately constant (82.5%)
and above the breakeven point. This will allow to an increase in the number of
passengers carried (a growth of approximately 37% until 2021) and a consistent
revenue growth (between 4-9%).
Passenger YieldAs already mentioned, passenger yield depends on several factors, and is
constantly adjusted to answer external shocks without “damaging” the load factor.
Besides being dependent on the demand and supply of seats, it is also influenced
by the operating costs However, it is not completely elastic - the LCC tend to be
more flexible on this adjustment. Usually the shocks affecting operational
expenses are common for most competing airlines – all companies are dependent
on crude oil prices for jet fuel, operate in the same airports and rely on a restricted
number of suppliers. Due to this, when an external shock reduces airlines’
expenses (as is the case of oil prices’ decrease), companies have a greater margin to reduce fares and the competitive pressure generates a collective
decrease on prices. Since Hawaiian Airlines has a low number of direct
competitors on its routes, the competitive pressure is not so significant and the
company may charge higher prices with lower fluctuations. In fact, in the last few
years it was possible to observe a bigger gap between the cost per available seat
mile (CASM) and the passenger yield. The inflation rate reflects the overall price
increase in the economy and also impacts fare prices, even though sometimes
this effect is not so evident in this industry.
Analyzing the past relationship between these variables, and considering the new “trends” on fares charged, it was possible to estimate a passenger yield for the next 5 years, which is expected to vary between 13.7 cents in 2016 and 14.2 cents in 2021.
Other operating revenues
Ancillary revenues are mainly generated by sales of frequent flyer miles under
co-branded credit agreements and the cargo business. It also includes checked
baggage revenue, commissions and fees or inflight revenues. Since much of this
revenue is directly related to passenger revenue and passengers carried, the
other operating revenues were estimated as a growing proportion of the
passenger revenue. With the new ATR freighter aircraft in the fleet, it is possible to
82.2% 82.3% 82.4% 82.5% 82.6% 82.7% 82.8% 82.9% 83.0% 83.1% 83.2% 83.3%
0.134 0.135 0.136 0.137 0.138 0.139 0.140 0.141 0.142 0.143
2016F 2017F 2018F 2019F 2020F 2021F
U
n
it
s
Forecasted yield and load factor
Yield Load factor
2,105 2,207 2,375 2,610
2,719 2,794
313 339
377 428
460 489
0 500 1,000 1,500 2,000 2,500 3,000 3,500
2016F 2017F 2018F 2019F 2020F 2021F Breakdown of total revenues (in million $)
Passenger Revenue Anciliary Revenue
0.060 0.075 0.090 0.105 0.120 0.135 0.150 0.165
2011 2012 2013 2014 2015
Yield and CASM evolution
Yield CASM
0.060 0.075 0.090 0.105 0.120 0.135 0.150
2016F 2017F 2018F 2019F 2020F 2021F Projected Yield and CASM
Yield CASM Graph XXIX:
Graph XXX:
Graph XXXI:
Graph XXXII:
Source: Individual analysis
Source: Individual analysis Source: Company’s annual report
carry larger bulk items between the Hawaiian Islands, increasing the capacity of
the cargo business and the generated revenues. Inflight sales are becoming a
trend, granting a bigger variety of services offered, accompanied by growth in
premium seats sales. Overall, ancillary revenues are expected to grow more than
70% until 2021, constituting at that time 15% of total revenues.
Fuel Expenses
Fuel expenses include taxes and delivery costs, and are one of the most important expenses for any airliner, accounting historically for more than 30% of the Hawaiian Holdings’ total expenses and for 23% in 2015. This decrease is related with the abrupt fall in oil and jet fuel prices, but if losses in the fuel derivative contracts are taken into account, this proportion rises to 26% in 2015.
Fuel expenses were calculated as follows:
W Where,
Gallons consumed = ASM × Average consumption per seat mile
The average consumption per seat mile has presented a slight decrease recently. This trend is expected to continue in the future with the introduction of more fuel efficient aircraft, such as the Airbus 330-800neo, that promises a 14% better fuel economy per seat. Therefore, it is expected that last year’s value of 0.0132 gallons per ASM, will have a slight and steady decrease in the future to 0.0126 gallons in 2021. In 2015, 71% of the company’s fuel was based on Singapore jet fuel prices, and 29% was based on U.S. West Coast jet fuel prices. Usually, jet kerosene is not broadly covered by analysts, but its fluctuations are highly correlated with oil price changes. For this reason, the WTI crude oil price was used as a basis analysis for the jet fuel price estimation. Taking all of this into account and using World Bank forecasts, jet fuel price was considered as a fixed proportion of the WTI crude oil based on last years’ relation. In order to consider the taxes and delivery costs, an “extra-cost” was incorporated in the average cost per gallon - an almost fixed component, slightly dependent on the gallons consumed (order size). The average cost per gallon (the jet fuel price including taxes and delivery expenses) is expected to increase from $1.5 per gallon in 2016 to 2.34$ in 2021. This price increase, combined with the fleet and fuel consumed growth, represents an increase of approximately 86% in fuel expenses over the next 5 years, and leads to an EBITDAR margin reduction (that is now higher than ever) of 30% in 2016 to 20% in 2021. This margin is expected to be kept in perpetuity, corresponding to competitors’ average margin, and allowing for a steady and moderate growth in operational results. Besides, this price increase
Aircraft fuel expenses = Gallons consumed × Average jet fuel price
0 0.5 1 1.5 2 2.5
2016F 2017F 2018F 2019F 2020F 2021F Projected crude oil and jet fuel prices (in $)
Cost per gallon Jet fuel price Crude oil price 24%
19% 21% 28%
24% 26%
0% 5% 10% 15% 20% 25% 30%
U
n
it
s
Weight of fuel expenses by company (2015)
0.0110 0.0115 0.0120 0.0125 0.0130 0.0135 0.0140
Average consumption per ASM Graph XXXIII:
Graph XXXIV:
Graph XXXV:
Source: Companies’ annual reports
Source: Company’s annual report and individual analysis