Abstract
This paper studies the stiffening effects of the material strain rate sensitivity and strain hardening on the saturated impulse of elastic, perfectly plastic plates. Finite element (FE) code ABAQUS is em-ployed to simulate the elastoplastic response of square plates under rectangular pressure pulse. Rigid-plastic analyses for saturated impulse, which consider strain rate sensitivity and strain hardening, are conducted. Satisfactory agreement between the finite element models (FEM) and predictions of the rigid-plastic analysis is ob-tained, which verifies that the proposed rigid-plastic methods are effective to solve the problem including strain rate sensitivity and strain hardening. The quantitative results for the scale effect of the strain rate sensitivity are given. The results for the stiffening effects suggest that two general stiffening factors n1 and n2, which char-acterizes the strain rate sensitivity and strain hardening effect, respectively can be defined. The saturated displacement is inversely proportional to the stiffening factors (i.e. n1 and n2) and saturated impulse is inversely proportional to the square roots of the stiffen-ing factors (i.e. n1 and n2 ). Formulae for displacement and saturated impulse are proposed based on the empirical analysis.
Keywords
Saturated Impulse, Scale Effect, Strain Rate Sensitivity, Strain Hardening
Effects of the Strain Rate Sensitivity and Strain
Hardening on the Saturated Impulse of Plates
Ling Zhu a Xu He b F. L. Chen b, c, * Xueyu Bai d
a Key Laboratory of High Performance
Ship Technology of Ministry of Education, Wuhan University of Technology, P. R. China
Email: [email protected]
b Collaborative Innovation Center for
Advanced Ship and Deep-Sea Exploration, Wuhan University of Technology, P. R. China.
Email: [email protected]
c Institute of Applied Physics and
Computational Mathematics, No.2 Fenghao East Road, Haidian District, Beijing 100094,China.
d Green Ship and Marine Engineering
Equipment Technology Research Centre, Wuhan Universityof Technology, P. R. China. Email: [email protected]
*Corresponding author. Email: [email protected]
http://dx.doi.org/10.1590/1679-78253664
Notation
scale factor
defined by Equation (27)
strain
mean average strain
strain rate
e
equivalent strain rate
max
maximum strain rate
dynamic pressure ratio
i
coefficient in Equations (30), (31) mass per unit area of a plate material density
' 0
flow stress after stiffening
0
yield stress
duration of a rectangular pressure pulse
c
mean duration of a rectangular pressure pulse
i
frequency of free vibration
a length of a square plate
3
a defined by Equation(1.c)
n defined by Equation (39)
1
n stiffening factor defined by Equations (10), (11) 2
n stiffening factor defined by Equation (22)
q Cowper-Symonds coefficient, Equation(10)
t time
D Cowper-Symonds coefficient, Equation (10) E Young's modulus
t
E Tangent modulus
H plate thickness
I dimensionless saturated impulse, defined by
Equa-tion (17)
f sat
I dimensionless saturated impulse for permanent
displacement
m sat
I dimensionless saturated impulse for maximum
displacement
lower sat
I lower bound of dimensionless saturated impulse
upper sat
I upper bound of dimensionless saturated impulse
sat mNS
I
dimensionless saturated impulse for maximum displacement excluding strain rate sensitivity
sat mS
I dimensionless saturated impulse for maximum
displacement including strain rate sensitivity
0
P pressure pulse
c
P static collapse pressure
T time when motion eases
i
T period of free vibration W transverse displacement
1
W transverse displacement during the first phase 2
W transverse displacement during the second phase
f
W permanent transverse displacement
m
W maximum transverse displacement
lower sat
W lower bound of the saturated displacement
upper sat
W upper bound of the saturated displacement
f sat H
W saturated permanent displacement including
strain hardening
f sat NH
W saturated permanent displacement excluding
strain hardening
f satNS
W saturated permanent displacement excluding
strain rate sensitivity
f sat S
W saturated permanent displacement including
strain rate sensitivity
W d W dt
1 INTRODUCTION
clamped mild steel quadrangular plates of different thicknesses and varying length-to-width ratios subjected to localized blast loads of varying sizes. The experimental results they presented provide an insight into the effect of scaling of plate geometries and in particular the loading conditions for impulsively loaded quadrangular plates. Tavakolia and Kiakojouri (2014) carried out numerical simulations of nonlinear dynamic response of square stiffened steel plates subjected to uniform blast loading by FE code ABAQUS and investigated the effect of stiffener configurations, boundary con-ditions, fixing details and strain rate on the dynamic response. Trajkovski et al. (2014) conducted detailed numerical simulations of circular plates made of RHA steel under blast loading using multi material arbitrary Lagrange Euler method in the FE code LS-DYNA to investigate the influence of mesh properties (particularly mesh size, its biasing and distance of the boundary conditions from the deforming structure) on blast wave loading parameters and structural response and proposed a minimum mesh design criteria based on the results.
Saturated impulse phenomenon is a characteristic of the response of plates subjected to a pulse loading when large inelastic deformation occurs. The concept is that if a plate is subjected to a rec-tangular pressure pulse with a sufficiently long duration, then only an early part of the pulse con-tributes to the maximum and permanent deflection of the plate, and the rest of the loading pulse will cause no further increase of these deflections. Several theoretical studies on saturated impulse of structures have been published. Zhao et al. (1994) were first illustrating that a saturated impulse existed for a structure undergoing large displacement under moderate loading. Zhao et al. (1995) then extended the concept of saturated impulse to simply supported beams, simply supported and clamped square plates and cylindrical shells. Due to the limitation of the rigid-plastic model, the saturated impulse proposed by Zhao et al. (1994, 1995) was only referred to the maximum dis-placement and the saturated impulse for the permanent disdis-placement of plates could not be ob-tained. Zhu and Yu (1997) further developed the idea of saturated impulse with respect to the max-imum displacement and the permanent displacement respectively by an elastic-plastic analysis. Their analysis suggests that two saturated impulses can be defined for an elastic, plastic structure: one corresponding to the maximum displacement and the other corresponding to the permanent displacement. Zhu et al. (2016a) verified that the saturated impulse obeys scaling law through ana-lysing geometrically similar square plates made of bilinear elastic-plastic materials by FE code ABAQUS. Zhu et al. (2016b) subsequently explored the effect of aspect ratio of a plate on saturated impulse; thereby the saturated impulse phenomenon was extended to the rectangular plates. Zhu et al. (2017) investigated the influence of pulse shape on the saturated impulse. An equivalent method is proposed to predict the deflection of fully clamped square plates, which replaces the linearly de-caying pressure pulse with an equivalent rectangular pressure pulse. Bai et al. (2017) discussed the effects of aspect ratio and boundary conditions on the saturation phenomenon using a series of rec-tangular plates with various boundary conditions under recrec-tangular pressure pulse as typical exam-ples.
accu-rate solution to the analysis of large inelastic deformation it is vital to model a more realistic mate-rial property. They pointed out that the strain hardening and strain rate sensitivity are two im-portant properties which influence the large inelastic deformation of a material.
Marais et al. (2004) reported a particularly accurate and precise physical and experimental data capture and data processing system for high strain rate testing using the split Hopkinson pressure bar. They compared the actual processed test data with both the Johnson-Cook and Cowper-Symonds high strain rate materials models, as well as with other published data. Zhu, Faulkner and Atkins (1994) performed experiments on clamped metal plates made of a strain rate sensitive mate-rial struck by a rigid wedge. They developed a simple theoretical procedure based on the rigid, per-fectly plastic method by using a strain rate sensitivity factor based on the average dynamic yield stress. Good agreement was obtained between the theoretical analysis and experiments with respect to the permanent deflection of the plates. An investigation to determine the behavior of stiffened plates subjected to uniform blast loading considering the effect of strain rate sensitivity was carried out by Kadid (2008). Results showed that the inclusion of strain-rate effect results in a much stiffer response and a smaller mid-point displacement. Jones (2014) discussed the influence of the material strain rate sensitivity for structures with various shapes and gave some theoretical predictions com-paring them with experimental results. Jones (2009) discussed that material strain rate sensitivity does not satisfy the requirements of geometrically similar scaling and pointed out the influence of material strain rate sensitivity must be retained in the calculations for the absolute values at the different scales; it is only the difference between the influence of material strain rate sensitivity at the two scales which is usually not significant. Hu and Zhao (2001) analyzed some mechanical quantities and experimental results of similar models to study the influence of scale effect pertaining to plastic strain rate on the material and structural dynamic response. Alves (2000) proposed a modification of the Cowper-Symonds equation for that the Cowper-Symonds equation is not able to predict the present material behavior for a broad range of strains, unless its coefficients change. The modified equation by Alves (2000) offers an alternative, whereby any stress can be predicted rea-sonably well for any input plastic strain. It differs from the Cowper-Symonds equation by one coef-ficient. Oshiro and Alves (2004) solved the problem of non-scalability of structures under impact loads caused by strain rate effects by suggesting a methodology by properly changing the impact or blast velocity in a way that models and prototypes follow the scaling laws. Also, Alves and Oshiro (2006a) showed a procedure to obtain the model impact mass for a strain rate sensitive structure such that the model and the prototype behave the same. Alves and Oshiro (2006b) further expand-ed the methodology in Oshiro and Alves (2004) and Alves and Oshiro (2006a) to the case where the model is made of a different material from that of the prototype. By so proceeding, it is possible to predict, in an extreme case, the strain rate sensitive prototype behaviour from a non-strain rate sensitive model response.
sensi-tivity and strain hardening into account, are proposed respectively in Section 2. The scale effect of strain rate sensitivity on saturated displacement and saturated impulse is illustrated in Section 3. The quantitative stiffening effects of strain rate sensitivity and strain hardening on saturated dis-placement and saturated impulse are shown in Section 4. Sections 5 and 6 contain the discussion and conclusion.
2 RIGID-PLASTIC ANALYSIS
2.1 Theoretical Solution Considering Strain Rate Sensitivity
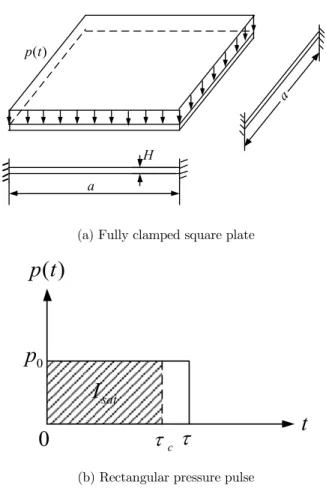
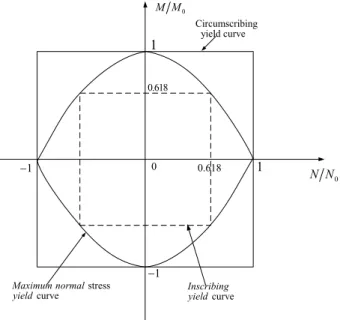
A simplified theoretical solution excluding strain rate sensitivity for a fully clamped square plate subjected to a uniform pressure pulse shown in Figure 1 was presented by Jones (2012), which uses the square yield condition in Figure 2.
H
a
a
( )
p t
(a) Fully clamped square plate
( )
p t
t
0
p
sat
I
0
c
(b) Rectangular pressure pulse
0 M M
0
N N
1
1
1
0 0.618 1
0.618
Circumscribing yield curve
curve Inscribing yield stress
curve Maximum normal yield
Figure 2: Maximum normal stress yield condition with inscribing and circumscribing square yield conditions.
For a square plate, in the first phase of motion 0 t , the transverse displacement given in
Jones (2012) is
1 1 1 cos 3
W H a t (1.a)
where
0 c
P P
(1.b)is the dimensionless pressure amplitude,
3= 1 2 ca H P
(1.c)and
2 2 0
=12
c
P H a (1.d)
is the static collapse pressure.
In the second phase of motion,
t T , where T is the time when all motion ceases, thetransverse displacement is expressed as
2 1 cos 3 cos 3 1
W H a t a t (2)
The maximum permanent transverse displacement is
123
1 2 1 1-cos 1
f
It is straightforward to show that the maximum permanent transverse displacement Wf reaches its peak when
a
3
, or
c=
a
3. The associated saturated transverse displacement is
Wf H
sat2
1 (4)which means even if the loading duration exceeds
c, the maximum permanent displacement will not increase and keep a saturated value.In fact, within this loading duration, when
t
=
c the motion stops in the first phase and the transverse displacement is
1 2 1
W H (5)
Therefore, only the first phase of motion needs to be considered when studying the saturated impulse phenomena.
For a square plate, spatially mean strain rate can be estimated as in Jones (2012)
2
=WW 4a
(6.1)
where
W
=
d W dt
(6.2)It is simple to show that has its maximum when
cos = 1 2
a t
3
2 2max=3 6Pc 1 H a
(7)
Assume that the "equivalent" strain rate throughout the response is equal to one-half of the maximum value, i.e.
e max
2
(8)It gives
2 2=3 2 6 1
e Pc H a
(9)
Consider the dynamic flow stress using Cowper-Symonds constitutive equation
1 '
0 1
0
=1 q
e
n
D
(10)
where D and q are Cowper-Symonds coefficients. It can be shown that
2 11 2
1 3 6
1 2
q
c H
P n
Da
where
n
1 is defined as the stiffening factor of strain rate sensitivity.Equation (1.a) can be also written as
2
0 0
1 2 2
0
24 1 1 cos 12
P a
W H t
H a
(12)
If the effect of strain rate sensitivity is considered, replacing flow stress
0byn
1 0
, Equation(12) becomes
2
0 1 0
2 2
1 0
24 1 1 cos 12
P a n
W H t
H n a
(13)
or
3 1
1
1 1 cos
W H a n t
n
(14)
The displacement Wreaches its maximum when
1 0 2 24n t a
(15)and the associated maximum displacement is
1 2 1 lower sat W H n
(16)
Dimensionless impulse is defined by
0 c p I Hp (17)
Expressing
c=
t
from Equation (15) and substituting it in Equation (17), the lower bound of the saturated impulse becomes1 2 lower sat I n (18)
By adopting an inscribing square yield curve, thus, replacing
0 by0.618
0, the upper boundvalue of saturated maximum displacement can be obtained
1 2 1 0.618 upper sat W H n
(19)
1
1.236
upper sat
I
n
(20)
2.2 Theoretical Solution Considering Strain Hardening
For a square plate made of rigid-linear strain hardening material, the flow stress after hardening is
'
0= 0 Et
(21)
where
E
t is the strain hardening modulus.Assume the stiffening factor of strain hardening is
n
2, defined by' 0 2
0 0
= =1 Et
n
(22)For a square plate, spatially mean strain can be estimated as in Jones (2012)
2
2
2
= W
a
(23)where W
1 1 cos
a t H3
and t ranges from 0 to
a
3, The "average" strain is expressed as
3
2 3 3
2 0
2 1 1 cos
= a
mean
a t H a
dt a
(24)which gives
2 22
3 1
=
mean
H
a
(25)
Substitute
mean into Equation (22) to obtain
2' 2
0 2
0 0
= =1 3 1 H Et
n
a
(26)Replacing
n
1 byn
2 in Equations (16) and (18), the saturated displacement and the saturated impulse retaining strain hardening are obtained2
2
1
lower sat
W H
n (16')
2
2
lower sat
I
3 SCALE EFFECT OF STRAIN RATE SENSITIVITY
3.1 Elastoplastic FEM
In this section, three fully clamped geometrically similar square plates under uniform rectangular pressure pulse are simulated using the FE code ABAQUS. 900x900x9mm square plate is the typical size of ship and platform plates and it is set as the prototype. 450x450x4.5mm and 150x150x1.5mm square plates are set as models, whose scale factor
is 1/2 and 1/6 respectively. By comparing the saturated impulse behaviour of these three different dimensions, the scale effect due to strain rate sensitivity will be studied. A rate-dependent elastic, perfectly plastic material model is adopted. The material parameters are listed in Table1. The S4R element type is used in FEM. After analysing the mesh sensitivity the mesh number of elements with 40x40 is found to be suitable to guarantee the time saving and accuracy of the calculations.Density (kg/m3
) 7800
Young’s modulus E (GPa) 207
Yield stressσ0 (MPa) 210
Cowper-Symonds Coefficient D (s-1) 40
Cowper-Symonds Coefficient q 5
Table 1: Material parameters.
The following magnitudes of dimensionless pressure pulse are used.
0
c
p p
=1.33, 2.00, 2.67, 4.00 and 6.67For each pressure amplitude, a series of loading durations (
) are applied. The maximum dis-placementW
m and permanent displacement Wf are computed for a given pressure pulse (p
0,
). To evaluate the permanent displacement, an average of the fluctuated displacements is adopted as no damping is introduced in the FE model.3.2 Scale Effect of Strain Rate Sensitivity
The dimensionless saturated permanent displacement of a fully clamped rigid-plastic square plate under uniform rectangular pressure pulse is expressed in the form of Equations (16) and (11), which takes the strain rate sensitivity into account. If a parameter
is defined as
2 12
1 q
H
Da
(27)
a relationship exists between the model and the prototype as
2 2
'' ' ''
' '' '
1 1
= a H = =
a H
It can be seen that with the decrease of square plate dimension (i.e.
1
),'' '
,i.e.
'' '
1 1
n n . Combining Equation (16) with n1'' n1' yields
''
'sat sat
W H
W H
(29)Above inequality indicates that
W H
satvaries with the scale factor, that is,
W H
satdependson the dimension of the square plate.
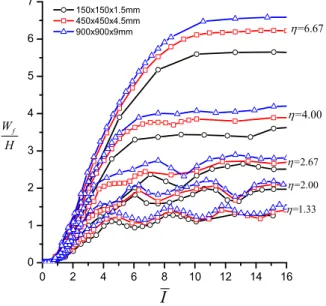
Figure 3 shows the variation of dimensionless permanent displacement with dimensionless im-pulse from FEM result. It is shown that the saturated imim-pulse still exists when retaining strain rate sensitivity. It is observed that in the high load range the strain rate sensitivity has a significant effect on the permanent displacement. The response of the plates does not obey the geometrically scaling law anymore; the 900x900x9mm square plate has the largest dimensionless displacement while the 150x150x1.5mm one has the smallest which agrees with Equation (29).
0 2 4 6 8 10 12 14 16
0 1 2 3 4 5 6 7
150x150x1.5mm 450x450x4.5mm 900x900x9mm
f
W H
I
=1.33
=2.00
=2.67
=4.00
=6.67
Figure 3: The variation of dimensionless permanent displacement vs. dimensionless impulse.
Another obvious feature from Figure 3 is that in low load range the permanent displacement has fluctuation with the impulse. This phenomenon might be related to the free vibration of the square plate. For a clamped square plate, the frequency of free vibration is
2 2
=
12 1
i i
h E
a
(30)
where
1
=35.99 =73.41 =108.27
2 3The period of free vibration is
=1
i i
T
(32)And for 900x900x9mm square plate
1
1604 ,
2786 ,
3533
T
s T
s T
s
(33)The saturated loading time is found to be close to the first order period of free vibration. The free vibration disturbs the permanent deformation, but the fluctuation of the permanent displace-ment so caused is limited. For engineering use it is reasonable to advise that in low load range an average saturated permanent displacement still exists.
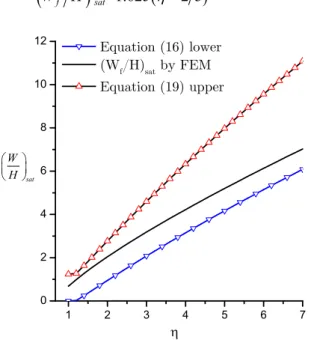
Figure 4 shows the relationship between the dimensionless saturated permanent displacement and dimensionless pressure amplitude from elastoplastic FEM and compares it with the rigid-plastic prediction presented in Section 2.1. This figure shows that the saturated permanent displacement by FEM lies between the lower bound and upper bound of the maximum displacement predicting by the rigid-plastic analysis and it is closer to the lower bound. An empirical function between
Wf H
sat and
is obtained
=1.625
2 3
0.793f sat
W H (34)
1 2 3 4 5 6 7
0 2 4 6 8 10 12
Equation (16) lower (Wf/H)sat by FEM Equation (19) upper
sat
W H
Figure 4: Relationship between dimensionless saturated permanent displacement and dimensionless pressure amplitude.
dis-placement by the elastoplastic FEM. The relationship between m sat
I and
can be expressed by the empirical function1.875
m sat
I
(35)1 2 3 4 5 6 7 0
2 4 6 8 10 12 14 16
m sat
I
Equation (18) lower Equation (20) upper by FEM
sat
I
Figure 5: Comparison between saturated impulse for maximum displacement by elastoplastic FEM and that of rigid-plastic prediction.
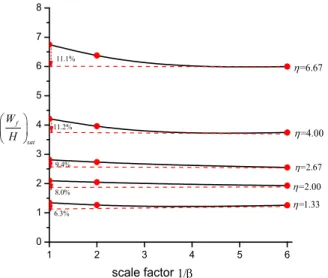
Figure 6 shows the reduction proportion for the dimensionless saturated permanent displace-ment varying with scale factor for various load amplitudes. It is shown that the dimensionless satu-rated permanent displacement decreases with the decrease of the square plate dimension. The re-duction proportion of saturated permanent displacement will also increase with the increase of di-mensionless pressure amplitude. When the model size reduces to 1/6 of prototype, the didi-mensionless saturated permanent displacement will decrease by 11.1% at
=6.67
; while it will decrease merely by 6.3% when
=1.33
.1 2 3 4 5 6
0 1 2 3 4 5 6 7 8
6.3% 8.0% 11.2%
9.4% 11.1%
=1.33
=2.00
=2.67
=4.00
=6.67
f sat
W H
1/
scale factor
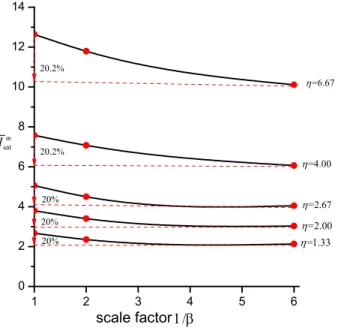
Figure 7 shows the variation of reduction proportion for the dimensionless saturated impulse of the maximum displacement with the scale factor for various load amplitudes. This impulse also decreases with the decrease of the square plate dimension. However regardless of the pressure am-plitude, the saturated impulse falls by approximately 20% when the model size is reduced to 1/6 of prototype.
1 2 3 4 5 6
0 2 4 6 8 10 12 14
scale factor
20% 20% 20% 20.2%
=1.33
=2.00
=2.67
=4.00
=6.67
satm
I
20.2%
Figure 7: Variation of reduction proportion for dimensionless saturated impulse of maximum displacement with scale factor.
4 STIFFENING EFFECTS OF STRAIN RATE SENSITIVITY AND STRAIN HARDENING
4.1 Stiffening Effect of Strain Rate Sensitivity
In this section, comparisons for saturated permanent displacement and saturated impulse are made between models considering strain rate sensitivity and excluding strain rate sensitivity for square plate of 900x900x9mm. The material parameters are the same as in Table 1 except that the materi-al with no strain rate sensitivity does not include the Cowper-Symonds coefficients D and q.
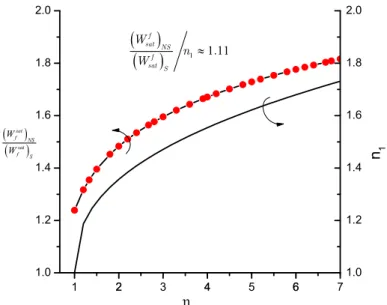
Figure 8 shows the relationship between the ratio of saturated permanent displacement, which excludes strain rate sensitivity effects to that takes strain rate sensitivity into account and dimen-sionless pressure amplitude. Curves result are both from the elastoplastic FEM analysis. The rela-tionship between ratio
n
1 in Equations (10) and (11) and the dimensionless pressure amplitude isalso shown in this figure. It is found that an approximate quantitative relationship exists
1 1.11f sat NS
f sat S
W
n
where
f sat NSW is the saturated permanent displacement excluding strain rate sensitivity;
f sat SW is
the saturated permanent displacement with strain rate sensitivity. This quantitative relationship indicates that the saturated displacement is inversely proportional to the stiffening factor
n
1 ofstrain rate sensitivity and the saturated displacement is not linearly related to the dimensionless pressure amplitude
but the power law function of
.1 2 3 4 5 6 7
1.0 1.2 1.4 1.6 1.8 2.0
11 11.f sat NS
f sat S
W n W
sat f NS
sat f S
W W
2 4 6 1.0
1.2 1.4 1.6 1.8 2.0
n1
Figure 8: Relationship between the ratio of saturated permanent displacement which excludes strain rate sensitivity to that counts in strain rate sensitivity and dimensionless pressure
amplitude and relationship between n1 and dimensionless pressure amplitude.
By a similar data processing method, the relationship between the ratio of the saturated im-pulse for maximum displacement which excludes strain rate sensitivity to that takes the strain rate sensitivity into account and n1 can be obtained. It is found that an approximate quantitative
relationship exists
1 1sat
sat m
NS m
S
I
n
I (37)
where
satm NSI is the saturated impulse for maximum displacement excluding strain rate sensitivity;
sat mS
I is the saturated impulse for the maximum displacement with strain rate sensitivity. This
4.2 Stiffening Effect of Strain Rate Hardening
Strain hardening also enhances the stiffness of plate. In this section, elastoplastic responses of 900x900x9mm square plates with various stain hardening modulus are investigated respectively. The material parameters are listed in Table 2.
Density ρ (kg/m3) 7800
Young’s modulus E (GPa) 207
Yield stress σ0 (MPa) 210
Tangent modulus Et1 E/100
Tangent modulus Et2 E/200
Tangent modulus Et3 E/500
Tangent modulus Et4 E/1000
Tangent modulus Et5 E/2000
Tangent modulus Et6 0
Table 2: Material parameters.
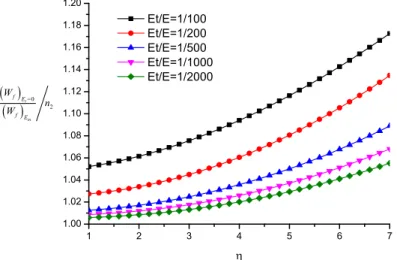
Figure 9 shows the relationship between the ratio of the permanent deflection of perfectly plas-tic plate to that of plates made of a material with strain-hardening and the stiffening factor
n
2. Itis shown that
f f
2 sat NH sat HW W n has the maximum value of 1.17 approximately.
1 2 3 4 5 6 7 1.00
1.02 1.04 1.06 1.08 1.10 1.12 1.14 1.16 1.18 1.20
Et/E=1/100 Et/E=1/200 Et/E=1/500 Et/E=1/1000 Et/E=1/2000
t=0 2
tn
f E
f E
W n W
Figure 9: Relationship between the ratio of the permanent deflection of perfectly plastic plate to that of plates made of strain-hardening material and stiffening factor n2.
has a maximum value of 1.15 in the case of Et/E=1/100 and
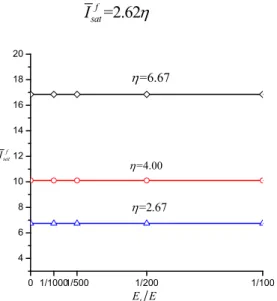
7. n2 is about 1.07 which isclose to 1. This is why no remarkable difference for saturated impulse of different strain hardening modulus can be observed. Hence it is reasonable to neglect the strain hardening effect on saturated impulse. The empirical formula for the saturated impulse with dimensionless pressure amplitude
is given by Equation (38).=2.62
f sat
I
(38)0 1/10001/500 1/200 1/100 4
6 8 10 12 14 16 18 20
=2.67
=4.00
f sat
I
t
E E
=6.67
Figure 10: Relationship between dimensionless saturated impulse for permanent displacement and dimensionless tangent modulus for various dimensionless pressure amplitude.
5 DISCUSSION
Essentially, strain rate sensitivity and material strain hardening have the same effect on the dynam-ic behaviour of a structure; they both enhance the strength of a structure and have a deformation resisting effect.
In practical engineering, materials are often strain rate sensitive and strain hardened. To quan-tify the deformation-reducing effect of the combination of strain rate sensitivity and strain harden-ing, a generalized stiffening factor
n
is suggested to be estimated by1 2
1
n n
n
(39)where
n
1 is given in Equation (11) andn
2 is given in Equation (26).For strain rate sensitive material, n1 can be calculated by Equation (11). For an elastic-plastic
material with strain hardening, stiffening factor
n
2 can be determined by Equation (26). Althoughthey are from rigid-plastic analysis, from Equations (36) and (37) and Figure 8 and Figure 9, it is still satisfactory to use Equations (11) and (26) to measure the elastoplastic stiffening factor.
To measure whether stiffening effect between strain rate sensitivity or strain hardening has a greater effect on deflection and saturated impulse, the following comparison is made.
1
2 2
2
1 2 2
0
1 3 6
1 1 = 3 1
2
q
c H t
P H E
n n
Da a
(40)
For mild steel it gives
1 1 5
5 0 8 5 8 5
1 2
0
9 2 40
1 1 = 1
3 t
a
n n H a
E
(41)
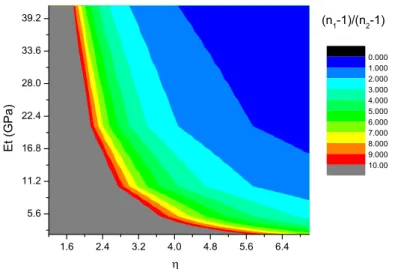
Figure 11 is contour map of
n11
n21
varying with tangent modulus and dimensionlesspressure amplitude. It is found that not until Et reaches 16GPa, that is Et/E is approximately 1/15
and dimensionless pressure amplitude reaches 7, does the strain hardening stiffening effect dominate the deformation resisting effect. That is only when the material has a very high strain hardening modulus does the strain hardening has a more significant stiffening effect than the strain rate sensi-tivity. In other common cases, strain rate sensitivity has a more obvious stiffening effect. The stiff-ening effect of the strain rate sensitivity will increase more significantly when the size of geometri-cally similar square plates decreases, whereas that of the strain hardening is not changed.
The results of this paper are of significant reference value for the evaluation of the plates’ de-formation depending on the material's stiffening effects. It is concluded from this study that a struc-ture with higher strength is easier to reach a saturated state at a lower saturated impulse.
1.6 2.4 3.2 4.0 4.8 5.6 6.4 5.6
11.2 16.8 22.4 28.0 33.6
39.2 (n1-1)/(n2-1)
Et
(G
Pa
)
0.000 1.000 2.000 3.000 4.000 5.000 6.000 7.000 8.000 9.000 10.00
6 CONCLUSIONS
This paper studies stiffening effects of the strain rate sensitivity and strain hardening on the satu-rated impulse of plates. Rigid-plastic analyses for satusatu-rated impulse, which consider strain rate sen-sitivity and strain hardening independently, are proved to be effective to estimate the saturated impulse of stiffening problem. Quantitative effects on saturated displacement and saturated impulse caused by the strain rate sensitivity and strain hardening are obtained. It is suggested that two stiffening factors
n
1 andn
2, which characterizes the stiffening effect of strain rate sensitivity and strain hardening respectively, can be defined based on detailed analysis of the results for stiffening effect of strain rate sensitivity and strain hardening. An integrated stiffening factorn
retaining both strain rate sensitivity and strain hardening is also presented. A quantitative relationship is found that the saturated displacement is inversely proportional ton
and saturated impulse is in-versely proportional to n . Some related empirical formulae for the displacement and saturatedimpulse are proposed, which can provide valuable references for anti-blast design of engineering plate structures.
Acknowledgements
The authors are grateful to the support of the general project of the National Natural Science Foundation of China (Grant No. 51579199). The author F. L. Chen would also like to thank the support of the China Academy of Engineering Physics key discipline project of "computational solid mechanics".
References
Alves, M. (2000). Material constitutive law for large strains and strain rates. Journal Engineering Mechanics 126 (2): 215–218.
Alves, M. and Yu J. L. (2005). Material influence on the response of impacted beams. Latin American Journal of Solids and Structures 2: 167-193.
Alves, M.and Oshiro, R. (2006a). Scaling the impact of a mass on a structure. International Journal of Impact Engi-neering 32:1158-1173.
Alves, M.and Oshiro, R. (2006b). Scaling impacted structures when the prototype and the model are made of differ-ent materials. International Journal of Solids and Structures 43: 2744–2760.
Bai X. Y., Zhu, L. and Yu T X. (2017). Saturated impulse for rectangular plates with various boundary conditions. Thin-walled structures, in press.
Hu, Y. Q. and Zhao, Y. P. (2001). Scale effect of plastic strain rate. Chinese Journal of Aeronautics 14(1): 37-43. Jacob, N., Yuen, S. and Nurick, G. N. et al. (2004). Scaling aspects of quadrangular plates subjected to localized blast loads-experiments and predictions. International Journal of Impact Engineering 30(8-9): 1179-1208.
Jones, N. (2009). Hazard assessments for extreme dynamic loadings. Latin American Journal of Solids and Structures 6: 35-49.
Jones, N. (2012). Structural impact Second Edition. Cambridge University Press, Cambridge, UK.
Kadid, A. (2008). Stiffened plates subjected to uniform blast loading. Journal of Civil Engineering and Management 14(3): 155-161.
Marais, S. T., Tait, R. B. and Cloete T. J. et al. (2004). Material testing using the split Hopkinson pressure bar. Latin American Journal of Solids and Structures 1: 319-339.
Oshiro, R. and Alves, M. (2004). Scaling impacted structures. Archive of Applied Mechanics 74: 130–145.
Reitsma, H. J. (2001). The explosion of a ship, loaded with black powder, in Leiden in 1807. International Journal of Impact Engineering 25: 507-514.
Tavakolia, H. R. and Kiakojouri, F. (2014). Numerical dynamic analysis of stiffened plates under blast loading. Latin American Journal of Solids and Structures 11: 185-199.
Trajkovski, J., Kunc R. and Perenda J. et al. (2014). Minimum mesh design criteria for blast wave development and structural response – MM-ALE method. Latin American Journal of Solids and Structures 11: 1999-2017.
Zhao, Y. P., Yu, T. X. and Fang, J. (1994). Large dynamic plastic displacement of a simply supported beam subject-ed to rectangular pressure pulse. Archive of Applisubject-ed Mechanics 64: 223-232.
Zhao, Y. P., Yu, T. X. and Fang, J. (1995). Saturated impulses for dynamically loaded structures with finite-deflections, Structural Engineering and Mechanics 3(6): 583-592.
Zhu, L, Faulkner, D. and Atkins, A. G. (1994). The impact of rectangular plates made from strain-rate sensitive materials. International Journal of Impact Engineering 15(3): 243-255.
Zhu, L., (1996). Transient deformation modes of square plates subjected to explosive loadings. International Journal of Solids and Structures 33: 301-314.
Zhu, L. and Yu, T. X. (1997). Saturated impulse for pulse-loaded elastic-plastic square plates. International Journal of Solids and Structures 34: 1709-1718.
Zhu, L., Bai. X. Y., Yu, T. X. (2016b). Saturated impulse for pulse-loaded elastic-plastic rectangular plates. Proceed-ings of International Conference on Impact Loading of Structures and Materials, Turin.
Zhu, L., Bai. X. Y., Yu, T. X. (2017). The saturated impulse of fully clamped square plates subjected to linearly decaying pressure pulse. International Journal of Impact Engineering, in press.