1Associate Professor, Laboratório de Geofísica Aplicada, Universidade Federal do Pampa – UNIPAMPA, Caçapava do Sul (RS), Brazil. E‑mail: [email protected] 2Associate Professor, Departamento de Geologia Aplicada, Instituto de Geociências e Ciências Exatas, Universidade Estadual Paulista “Júlio de Mesquita Filho” –
UNESP, Rio Claro (SP), Brazil. E‑mails: [email protected], [email protected]
3Geologist, Geociences PhD, Departamento de Geologia Aplicada, Instituto de Geociências e Ciências Exatas, Universidade Estadual Paulista “Júlio de Mesquita Filho” –
UNESP, Rio Claro (SP), Brazil. E‑mail: [email protected] *Corresponding author.
Manuscript ID: 20160117. Received in: 10/03/2016. Approved in: 02/20/2017. ABSTRACT: he northeast portion of the Paraná Sedimentary Ba‑ sin is distinguished by structural highs as the known Pitanga Dome, an uplifted structure identiied in the last century. It represents a ge‑ ological and evolutionary evidence of the Paraná Sedimentary Basin and has undergone inspired studies and intense exploration surveys. his study consists of a gravimetric survey in the Pitanga Dome area, State of São Paulo, Brazil. he Bouguer gravity anomalies have been identiied and related to the structural high, sedimentary thickness, and the basement morphology. Processing and enhancement tech‑ niques were used for forward modeling based on previous studies. he three models from proiles sectioning the dome have a sedi‑ mentary thickness varying from 200 to 1.250 meters. he adopted methodology has provided important results determining that the Pitanga Dome can be understood through rational 3D visualization. he area can be interpreted as an undulating basement with thinning of sedimentary rocks related to deep features (structures) in the crust/ mantle limit (Moho uplift). his characteristic is conirmed by the sedimentary layer thickening present throughout the surrounding area. he results also ofer important insights and support for further studies concerning the genesis and evolution of this and other uplif‑ ted structures of the Paraná Sedimentary Basin.
KEYWORDS: Paraná basin; Gravimetry; Modeling.
RESUMO: A porção nordeste da Bacia Sedimentar do Paraná dis‑ tingue‑se pelos altos estruturais e o conhecido Domo de Pitanga, uma estrutura de soerguimento identiicada no século passado. Representa uma evidência geológica e evolutiva da Bacia Sedimentar do Paraná sendo alvo de diversos estudos e pesquisas de exploração. Este estudo consiste em uma aquisição gravimétrica na área do Domo de Pitanga, Estado de São Paulo, Brasil. As anomalias Bouguer são relacionadas com o alto estrutural, espessura de sedimentos e morfologia do embasa‑ mento. Técnicas de processamento e realce foram usadas para modela‑ gem direta com base em estudos anteriores. Três modelos foram gerados em peris seccionando o domo e apresentam espessuras de sedimentos variando de 200 a 1.250 metros. A A metodologia adotada forneceu importantes resultados estabelecendo o entendimento através da visual‑ ização 3D racional do Domo de Pitanga. A área pode ser interpretada como uma ondulação do embasamento com ainamento na espessura dos sedimentos associado a estruturas em profundidade no limite cro‑ sta/manto (soerguimento da Moho). Esta característica é conirmada pelo espessamento das camadas sedimentares em toda área circundante. Os resultados também fornecem importantes subsídios e apoio a novos estudos sobre a gênese e evolução deste e de outros altos estruturais na Bacia Sedimentar do Paraná.
PALAVRAS-CHAVE: Bacia do Paraná; Gravimetria; Modelagem.
Gravimetric survey and modeling of the
basement morphology in the sedimentary
thickness characterization, NE portion of
Paraná Sedimentary Basin – Brazil
Aquisição gravimétrica e modelagem da morfologia do
embasamento na caracterização da espessura sedimentar,
porção NE da Bacia Sedimentar do Paraná – Brasil
Maximilian Fries1*, Walter Malagutti Filho2,
João Carlos Dourado2, Mariana Aparecida Fernandes3
INTRODUCTION AND OBJECTIVES
In recent decades, important studies at a regional scale analyzed and characterized the geological and structural context of the Paraná Sedimentary Basin and its relation to the origin and development of the South American plat‑ form Fulfaro (1971), Fulfaro et al. (1980, 1982), Almeida (1980), Ferreira et al. (1981), Ferreira (1982), Soares et al.
(1982), Cordani et al. (1984), Zalán et al. (1987, 1990), Soares (1991), Quintas (1994) and Milani (1997).
Such studies were driven and sponsored due to the desire, at the time, to discover and deine potential hydrocarbon producing areas. In a period of development of alternative fuels across the world, and the oil crisis in the 1970’s, the newly created Consortium CESP‑IPT/Paulipetro caused an intense mobilization of geoscientists. hen, a period of geological and geophysical surveys and research on a regio‑ nal scale in the Paraná Sedimentary Basin were funded (IPT 1980, 1981, Paulipetro 1981).
his consortium provided an opportunity to explore via‑ ble and economic target areas in the Paraná Basin (Paraná, Santa Catarina and São Paulo States). Potential areas were identiied, analyzed and characterized, resulting in a great improvement in the knowledge of the evolution of the geo‑ logy and structure of the basin. Domains and structural lineaments were outlined and identiied through magneto‑ metric, seismic and electrical resistivity surveys.
In this context, structural highs in the northeastern portion of the basin were identiied. hese potential hydro‑ carbon reservoir structures, located near Piracicaba and Rio Claro, São Paulo, Brazil, are known as Pitanga, Artemis, Pau D’Alho and Jibóia. he Pitanga structure, irst recog‑ nized by Washburne (1930), is identiied and recognized as a dome shaped structure, being also a peculiar and inte‑ resting structure as an exploration target then and until the present day as an important reward and feature of the basin evolution studies.
he choice and purpose of this study were strongly inluen‑ ced by studies of Soares (1971, 1973), Soares and Landim (1973), Bósio (1973), Castro (1973), Souza Filho (1983), Hasuiu et al. (1989), Landim et al. (1980), Morales et al.
(1997), Riccomini (1989, 1992, 1995, 1997), Rostirola
et al. (2002) and Dourado (2004). Among these studies,
Sousa (1997) and Sousa (2002) detailed the geology and structural framework, as well as a reined characterization of lineaments and limits of the Pitanga Dome, which ser‑ ved as the main motivation to reine this structure. he goal of this work is to use regional gravity data constrained by geological and previous geophysical data to determine the basement morphology, deining the higher and lower areas
of the Precambrian basement (sedimentary thickness), based on forward 2.5D modeling.
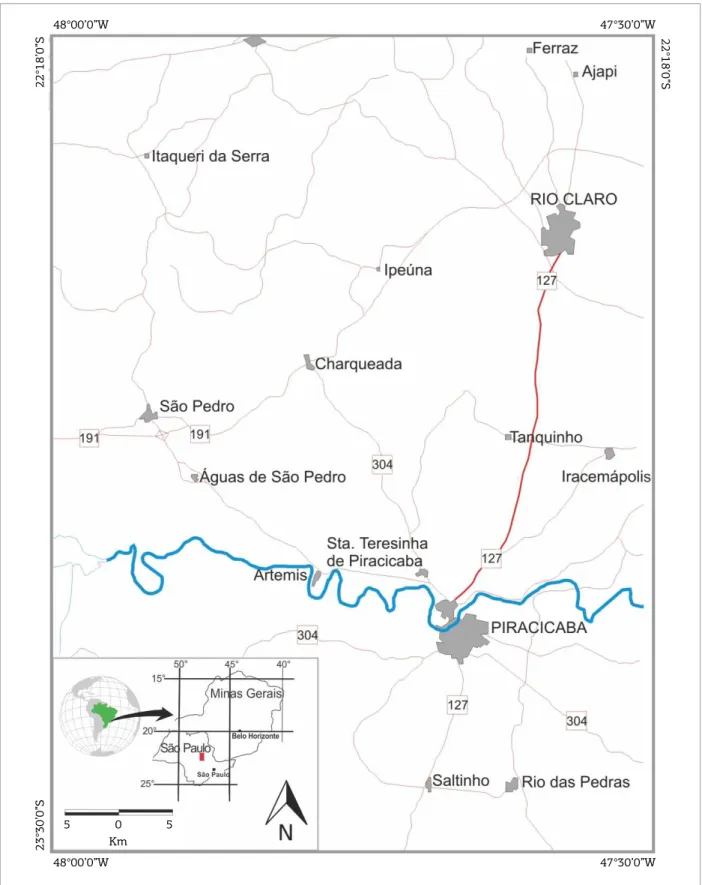
he study area is located in the São Paulo State, mid‑ dle‑eastern part and northeast lank of the Paraná Sedimentary Basin. he region comprises the known structural uplifts of Pitanga, Artemis, Pau D’Alho, and Jibóia, and it cov‑ ers an area of 4,000 km2. heir main cities are Rio Claro,
Piracicaba, São Pedro and Águas de São Pedro (Fig. 1).
PARANÁ SEDIMENTARY BASIN:
EVOLUTION AND GEOLOGICAL SETTING
he Paraná Sedimentary Basin has an area of about 1.2 million km2 and comprises the southern part of Brazil,
the eastern half of Paraguay, the Mesopotamian region of Argentina, and the western half of Uruguay. he basin has an elongated shape to NNE‑SSW directions, approximately 1,700 km long, with an average width of 900 km (Zalán
et al. 1990). It presents basaltic lava lows in two‑thirds
of Brazil’s portion, reaching up to 1,700 m thick which, adding the sills, comprises up to 2,000 m thick of igneous rocks. he maximum thickness of sedimentary and volca‑ nic rocks is around 8,000 m at the geometric center of the basin (Zalán et al. 1987) (Fig. 2).
Its present location is a response to Mesozoic/Cenozoic orogenic events, and its axis would have migrated over time, probably from west to east. he rock packages of the South America convergent margin generated a lexural arch loca‑ ted farther inland of the continent during compressional and sedimentary processes. Zalán et al. (1987) argues that in the main Paraná Basin alignments there is a strong pat‑ tern in these linear features (X form). hese features can be divided into three groups, according to its NW‑SE, NE‑SW and E‑W direction.
he two most important trends are NW‑SE and NE‑SW, which can be simple or extensive fault zones (hundreds of kilometers long and a few tens of kilometers wide). hese two groups of tectonic elements are old zones of weakness, which were recurrently active during basin evolution.
Figure 1. Location map of the study area, main highways, access roads, and cities.
22°18’0”S
48°00’0”W 47°30’0”W
22°18’0”S
23°30’0”S
48°00’0”W 47°30’0”W
5 0 5 Km
the evolution of the basin, and the areas with NW trend are intensively intruded by diabase dykes, while NE trends are remarkably devoid of these features. Zalán et al. (1990)
Study Area: Geological
and Structural Setting
he age of the rocks that compose the geological setting in the area vary from Carboniferous to Permian (Itararé Group, Tatuí Group and Irati Formation); Upper Cretaceous inclu‑ ding the basaltic lava lows intruded within the sedimentary rocks, Pirambóia, Botucatu and Itaqueri Formations; and the Neocenozoic sediments present in the latter regions in the basin (Fig. 3A). hese rocks units and their related Groups and Formations are described in detail by Soares and Landim (1973), Soares (1974), Riccomini (1992), Sousa (1997, 2002).
In terms of structural characterization, Soares (1974), and more recently Sousa (1997, 2002), recognized the fault system in Passa Cinco — Cabeça and Ipeúna — Piracicaba. he tectonic and structural framework in the area is condi‑ tioned through the stratigraphic units distribution as uplif‑ ted, tilted and mainly controlled by faulting. In this way, the younger units emerge side by side the older ones.
Rocks layer inclinations generally gently present 2° to 5° dip, although locally, dip values can be higher, reaching 75° related to the fault limited blocks. According to the known lineaments (Fig. 3B), the area is strongly inluen‑ ced by lineaments oriented in NW, EW and NE directions that are related to the normal faults. he NW‑SE direction fault bundle is characterized by tilted blocks, conditioning the structural uplift geometry from Pitanga, Artemis, Pau D’Alho, and Jibóia.
Sousa (1997, 2002) argue that the array and structu‑ ral subdivision (compartmentation) from these structural highs are associated with the stratigraphic units, and block movements are controlled by faulting, considering that the recent units juxtapose older rocks units.
he morphotectonics in the area can be described as a distensional regime, producing the normal faults generation (NE‑SW) directly related to the Gondwana partioning, as well as a strike‑slip fault regime that reactivated previous discon‑ tinuities, probably fault zones originating in the basement.
Figure 2. (A) The Paraná Sedimentary Basin within the South American Continent and study area location (red
dot); (B) Paraná Basin simpliied geological map, geographic references, basement depth, and study area (red dot).
Adapted and modiied from Zalán et al. (1990) and Milani & Ramos (1998).
(A) (B)
1.200 km
200 km 0
5.000 Basement depth (m)
Structural arc
Chaco and Pantanal (Cenozoic) Bauru Supersequence Gondwana III Supersequence Gondwana II Supersequence Gondwana I Supersequence Paraná Supersequence Rio Ivaí Supersequence Basin boundary International boundary
Study area
A B
1.200 km
200 km 0
5.000 Basement depth (m)
Structural arc
Chaco and Pantanal (Cenozoic) Bauru Supersequence Gondwana III Supersequence Gondwana II Supersequence Gondwana I Supersequence Paraná Supersequence Rio Ivaí Supersequence Basin boundary International boundary
Figure 3. (A) Main geological units and structural uplits located in the Paraná Basin NE portion according CPRM (2001); (B) lineaments recognized according to Sousa (2002) and Pitanga Dome location in the area (green ellipse 1)
and Artemis (2), Pau D’Alho (3), and Jibóia (4) minor structural highs.
47°30’0”W
48°60’0”W Paleozoic
Corumbataí Fm Irati Fm Tatuí Fm
Itararé Group (Permian)
Paleozoic
Sedimentary covering Alluvial deposits Main faults
Mesozoic
Itaqueri Fm Serra Geral Fm Botucatu Fm Pirambóia Fm
22°18’0”S
48°60’0”W
23°60’0”S
48°60’0”W Main cities
Aerial photo lineaments
Inferred fault/covered
Defined fault
Diabase filled fault
48°60’0”W
22°18’0”S
47°30’0”W
B A
23°60’0”S
0 2,5 5 10
Km 0 2,5 5 10
Km
METHODS
Gravimetric Survey
and Data Processment
For gravimetric data acquisition, a La Coste Romberg — model G, number 987 — was used. he equipment belongs to the Applied Geology Department from São Paulo State University (IGCE/UNESP), Rio Claro, São Paulo.
he relative gravity measurements and the absolute gravity values were tied to the International Gravity Standardization Network (IGSN71) using the absolute Base Station from the Secondary Gravity Network from São Paulo State (Rede Gravimétrica Secundária do Estado de São Paulo), deployed by the Geophysics Department of São Paulo University (IAG/USP). Both the secon‑ dary gravimetric — in the State of São Paulo — and the Brazilian Fundamental Networks are referenced to IGSN71. he base station is located in downtown Rio
Claro at Latitude22°24.63’ S and Longitude47°33.67’ W. he altitude is 624 m.
he gravity data, which totaled 595 stations, have an ave‑ rage station spacing of 2 km and were acquired along major highways, local roads and accesses. All the data were merged and reduced using the 1967 International Gravity Formula. Free Air and Bouguer gravity corrections were made using sea level as a datum and 2.67 g/cm3 as a reduction density.
Corrections and data reduction processing (latitude, tide, drift, free‑air and terrain corrections) were performed using the Oasis montaj software, GEOSOFT Inc. — Gravitytoolkit.
Gravity station georeferencing was achieved using a pre‑ cision GPS receiver according to the data diferential correc‑ tion technique(DGPS) to minimize the reference ellipsoid/ topography diference error (Fairhead & Odegard 2002, Fairhead et al. 2003).
(1:10,000 scale) from the Geographic and Cartographic Institute of São Paulo (Instituto Geográico e Cartográico de
São Paulo – IGC), and Altitude Reference Stations (Referência
de Nível – RNs) from Instituto Brasileiro de Geografia e
Estatística (IBGE) located in the survey area. he coordinates
and elevations were acquired using a Trimble GPS receiver (model: Pathinder ProXR), with an accuracy GPS receiver, with nominal horizontal precision of 0.005 m ± 1 ppm, and vertical accuracy of 0.01 m ± 2 ppm. For Roverdata acquisition in the ield, the TerraSync (Trimble Inc.) sof‑ tware was used.
For the post‑correction processing, a GPS base station was used, comprising the DGPS Network from Santiago & Cintra Geotechnologies Company, and was located in the IGCE/UNESP, Rio Claro, São Paulo. he Base Station iles and Rover iles(GPS data survey) were corrected using the Pathinder software. he average time of GPS rover data acquisition for the measured gravity station was 15 min, with a maximum of 20 min.
Gravimetric Maps
he Bouguer anomaly map (Fig. 4A) was generated using the Oasis montaj software with the minimum curvature interpolation method (Briggs 1974). With a regular grid of 77 X 97 points (X and Y respectively) and 1,000 X 1,000 m grid cell size, respecting the minimum value of one fourth of the observation station data spacing. he coordinate sys‑ tem used in the maps is the Universal Transverse Mercator (UTM), Zone 23 South. The reference ellipsoid South American Datum (SAD 69) was adopted respecting the cartographic system from previous geological and geophy‑ sical studies (CPRM 2001, IPT 1980).
RESULTS
Gravimetric Data Analysis
Semi-Quantitative Analysis
Causative source depths from gravimetric data and frequency analysis were obtained by converting the ori‑ ginal grid from spatial to frequency domain, by using the Fast Fourier Transform (FFT) technique (Cordell & Grauch 1982). he frequencies and related source depths according to frequencies are displayed in the Radially Averaged Power Spectrum (Spector & Grant 1970, Ofoegbu & Hein 1991, Cowan & Cowan 1993, Hildenbrand & Kucks 1983).
Spectral methods have been commonly used in the analysis of potential ield data to provide irst‑order depth
estimates to density and magnetic susceptibility interfaces (for example, Dorman & Lewis 1970, Shuey et al. 1977, Tselentis et al. 1988, Blakely 1988). he spectral method assumes that the density or magnetic susceptibility boun‑ daries are essentially horizontal interfaces.
The calculated results represent the log of Radial Power Spectrum of gravity potential ield as a function of wave number/frequency (1/km). he depth estimates are used to constrain gravity/magnetic source solutions, allowing the separation of shallow, intermediate and deep sources depth from the gravity data. his analysis con‑ sists of a semi‑quantitative technique for causative sour‑ ces (magnetic and gravimetric), and is interpreted in the frequency domain.
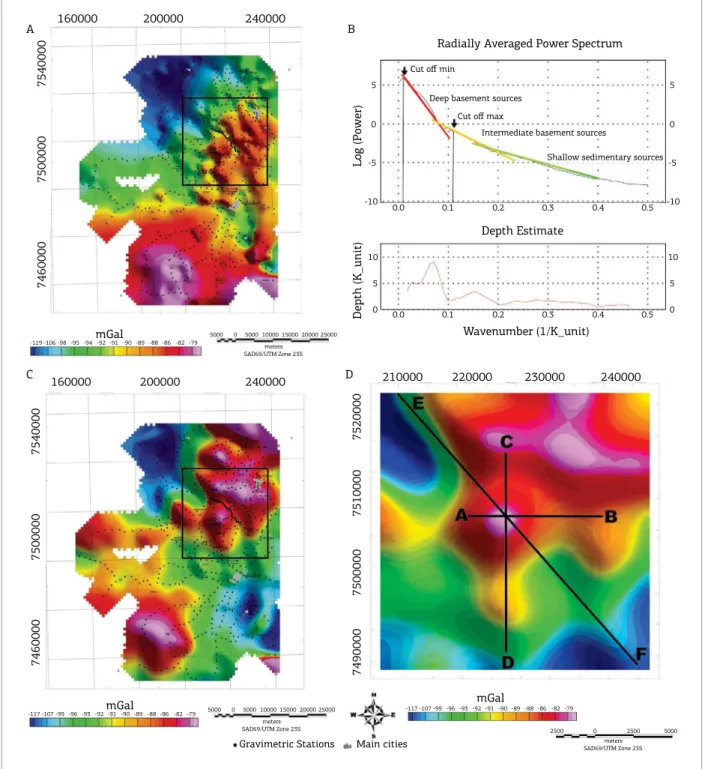
To estimate spectrally determined depths, a radially ave‑ raged 2D power density spectrum is calculated over a region. In this case, we used the Bouguer anomaly results (Fig. 4B).
After analysis of the plot representing the radial average of the energy spectrum versus the radial frequency, we can determine three major segments and their respective slo‑ pes. he energy spectrum exhibits three linear equivalent source depths:
■ Deep basement sources;
■ Intermediate basement sources;
■ Shallow sedimentary sources.
In order to enhance the gravimetric anomalies (deeper fea‑ tures of interest), Radially Averaged Power Spectrum analysis and cut‑of frequency values (Band Pass ilter) were applied. In this manner, a deep source Bouguer gravity anomaly map was generated. For the purpose of this study, cut of values of 0.01 and 0.11 (minimum and maximum) — denominated here as Band Pass Filter – Deep Sources Anomalies — were generated according to Fig. 4C. Considering the litholo‑ gies and structure limits, three proiles (Fig. 4D) sectioning the main anomalies of interest related to the uplifted area (structural high — Pitanga Dome) were determined for the 2.5D gravity modeling.
Quantitative Analysis: Gravity Modeling
he geophysical forward modeling in this study was per‑ formed using the software GM‑SYS, a toolkit within the Geosoft Oasis montaj platform. he model calculates theo‑ retical responses of a pre‑designed geological model based on the known geology and basement depths from earlier studies, and comparing the responses to observed gravimetric data.
Figure 4. Shaded relief Bouguer anomaly maps (45º azimuth and 45º inclination) and Pitanga structural high
uplit area limits (black rectangle): (A) Bouguer anomaly map and gravity stations; (B) Semi‑quantitative analysis,
anomalous sources depth (RAPS); (C) Bouguer anomaly map, Band Pass Filter – Deep Sourcesand Pitanga Dome
limits (black rectangle); (D) Pitanga Dome detailed map with selectedproiles used for gravity forward modeling.
A B
7460000 7500000 7540000
7460000 7500000 7540000
160000 200000 240000
160000 200000 240000
SAD69/UTM Zone 23S meters Radially Averaged Power Spectrum Log ( Po w er) Deep basement sources Cut off min Cut off max Intermediate basement sources Shallow sedimentary sources Depth Estimate Depth (K_unit) Wavenumber (1/K_unit) C Gravimetric Stations Main cities D 7490000 7500000 7510000 7520000
210000 220000 230000 240000
mGal mGal
mGal
-119 -106 -98 -95-94-92-91 -90 -89 -88 -86 -82 -79
5000 0 5000 10000 15000 20000 25000
SAD69/UTM Zone 23S meters
5000 0 5000 10000 15000 20000 25000
SAD69/UTM Zone 23S meters
2500 0 2500 5000 -117 -107 -99 -96-93-92-91 -90 -89 -88 -86 -82 -79 -117 -107 -99 -96-93-92-91 -90 -89 -88 -86 -82 -79
5
0
5 10
0
5 10
0 -5
-10
5
0
-5
-10 0.0 0.1 0.2 0.3 0.4 0.5
0.0 0.1 0.2 0.3 0.4 0.5
(Z‑axis). Perpendicular to the main direction determined for the model (strike) is the Y‑axis that can be changed, directly inluencing the response of the calculated inal curve. Considering the regional nature of this study, the length of the Y‑axis was set to ininity for the modeled prisms — both for crust and sediments. Considering the local geological
context, for the basic rocks, the length was adjusted to a maximum of 10 km.
Figure 5. W‑E direction modeled proile A – B in the structural area (Pitanga Dome). (A) Observed gravity data,
calculated curve and adjustment (error). (B) Crustal modeling with sediments and basic rocks.
A
Gravity mGal
ERR=0.401
B
Depth (m)
Basement Basic Rocks Sediments Observed Calculated Error
A B
-75
-80
-85
-90
-95
0
1.000
2.000
3.000
0 15 km
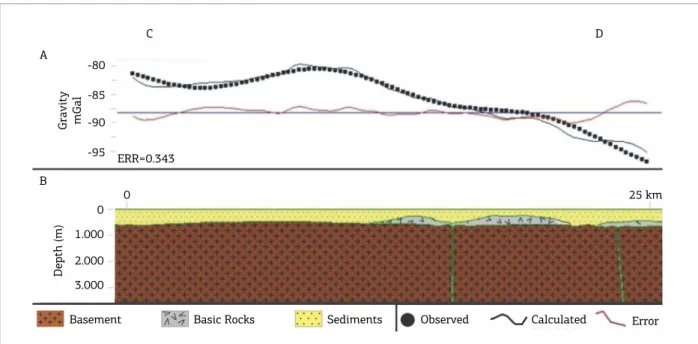
Figure 6. N‑S direction modeled proile C – D in the structural high area (Pitanga Dome). (A) Observed gravity data, calculated curve and adjustment (error). (B) Crustal modeling with sediments and basic rocks.
Basement Basic Rocks Sediments Observed Calculated Error
B
Depth (m)
0
1.000
2.000
3.000
0 25 km
A
Gravity mGal
ERR=0.343
C D
-80
-85
-90
-95
according the mean density values from igneous and sedi‑ mentary rocks from Telford et al. (1990) (Tab. 1).
Models A‑B (Fig. 5) and C‑D (Fig. 6) are proposed from two proiles sectioning the Pitanga Dome.
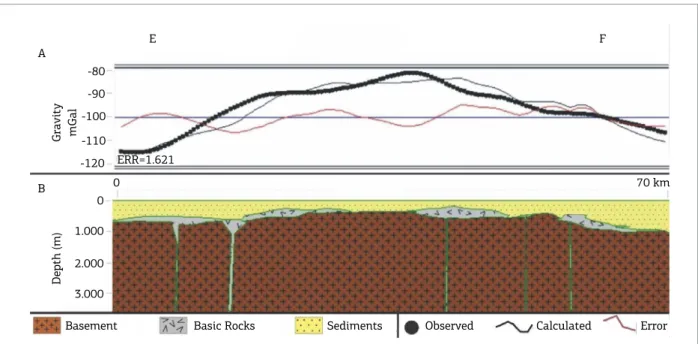
he proile E‑F, a cross‑section throughout the entire gra‑ vimetric survey area (NW‑SE strike direction), was chosen to obtain a visualization and characterization of the inluence of surrounding rocks near the uplift structure of Pitanga Dome (a regional feature), as shown in Fig. 7.
Table 1. Geophysical modeling density values used in
this study. Mean values are from Telford et al. (1990)
for sedimentary, basic and basement rocks.
Model Lithology Density ‑ g/cm3 (SI)
Paraná Basin Sediments 2.4 Basic rocks 2.85 Basement 2.67 Upper/Lower Crust 2.80
Figure 7. Modeled proile E – F in the structural high area (Pitanga Dome). (A) Observed gravity data, calculated
curve and adjustment (error); (B) crustal modeling with sediments and basic rocks.
A
Gravity mGal
ERR=1.621
B
Depth (m)
Basement Basic Rocks Sediments Observed Calculated Error
E F
-80
-90
-100
-110
-120
0
1.000
2.000
3.000
0 70 km
DISCUSSIONS
Previous studies in the Paraná Sedimentary Basin argue that sediment thickeness in the center of the basin can reach 8,000 m in the northeast portion of the basin and, according to isopach maps (Milani & Ramos 1998), the depths are 1,000 to 2,000 m in the region near the basement (studied area). Considering this, the forward generated models from the observed gravimetric responses relied primarily on these geological and structural results recognized in published stu‑ dies and also in recent local studies on and nearby the pro‑ posed area (Riccomini 1992, Sousa 1997, 2002).
However, geophysical results are important benchmarks in the quantiication of physical parameters of the rock packa‑ ges and actual thicknesses, considering that deep drilling soundings, deep water wells, seismic and other crustal stu‑ dies were not performed in the area.
Basement and sediment depth‑limit parameters in the forward gravity modeling, obtained using the Band Pass Filter – Deeper Sourcesfrom the observed gravity data, are coherent and supported when compared to the previous geophysical studies performed by IPT (1980) and Dourado (2004). hese previous information also helped to reduce interpreter bias during model generation.
he seismic receiver function method (Dourado 2004) indicates that the crust‑mantle depth limit varies appro‑ ximately 38 km to the SW and 43 km for the azimuth N 168° in the Pitanga Dome area. he decrease in depth to the SW, associated with the tangential Receiver Function analysis shows a NE dip, suggesting that the structural high
(Pitanga Dome) has its origin in deep phenomena, which also afected the crust/mantle interfaces and the structu‑ ral pattern in diferent tectonic phases. his same azimuth analysis indicates a thickening of the basin sediments to the west, where the thickness of the sediments may exceed 1 km in some areas.
IPT (1980) in DC resistivity (Vertical Deep Sounding technique) and magnetometric surveys in São Pedro and Piracicaba region have distinguished the crystalline rocks from basement and provided information about the overlaying sedimentary rocks and structural framework in deeper levels. It has also provided a morphological understanding in the covered area. Near Piracicaba and São Pedro, the sedimen‑ tary units have an average thickness of 1,000 m. In the area, which extends up to Charqueada city and Piracicaba River, the thickness of this sediment cover reaches up to 1,472 m.
he basement depth and morphology results, calculated using the DC Vertical Deep Soundings, provide a sedimen‑ tary contour map where the highest basement areas (thin‑ ner sediments coverage) are 500 m deep (studied area) and the lowest ones (thicker sediments coverage) reach 952 m, getting deeper toward northeast.
not only an observed versus calculated curve adjustment. A concentrated presence of intruded basic rocks (Serra Geral Formation), exhibiting diferent shape geometries (batholi‑ ths, sills and dikes) within the sediments, represents a noise source and complicating factor with regards to an ideal it. his presence of high density material produces intense higher frequency anomalies in the shallower and deeper zones of the investigated area.
hese characteristics, considering the high responses from gravimetric sources, represent spurious noise for the proposed study (Fries 2008). Lower magnitude source rocks anomalies (residuals) or high frequencies were also analy‑ zed using the fourth normal form (4Fn) applied to the raw data. he analysis showed the presence both for the high frequencies raw data generated directly from the survey and the fourth diference calculated in the database. Considering these characteristics, deeper anomalies or lower source fre‑ quencies were used. It represents the regional anomalies or regional sources, which are the main object of analysis and interpretation for the modeled proiles.
CONCLUSIONS
In this paper we applied recognized and widely used geophysical acquisition methods and data processing/inter‑ pretation techniques both for geological mapping and for a better understanding of basement morphology by using indirectly obtained depth information associated with pre‑ vious geological and geophysical studies in the region.
he generated gravity anomaly map present features related to the geologic and structural context in the area. Considering the limitations of the gravity method applied to such sources, such as lateral and depth lithologic and stratigraphic variations, unconformities, non‑conformities and small scale intrusions, the results considering the main objective, were satisfactory.
he geophysical forward modeling sectioning the struc‑ tural high (Pitanga Dome) adopting the Band Pass – Deeper Source Anomalies method to observed data allowed cohe‑ rent assessment, correlation and analysis for comparing the diferent anomaly features observed in the Bouguer anomaly map. he sediment depth limits and basement morphology adopted for the generated model are also coherent and res‑ pect the limits recognized in previous studies.
Based on the results of gravity analysis using the Radial Power Spectrum, the Bouguer anomaly map and
Band Pass – Deeper Sources Anomaliesand 2,5D gra‑
vity forward modeling along three proiles (N‑S, E‑W and NW‑SE), the Pitanga Dome can be understood in a rational 3D visualization. he area can be interpreted as an undulating basement with thinning of sedimentary rocks related to deep features (structures) in the crust/ mantle limit (Moho uplift). his characteristic is conir‑ med by the sedimentary layer thickening present throu‑ ghout the surrounding area.
he proposed method also provides a better overview of the structural framework, gaps in understanding and support for further studies about this structural high (Pitanga Dome) and other similar structures in the eastern portion of the Paraná Sedimentary Basin.
ACKNOWLEDGEMENTS
The authors would like to thank: Fundação de Amparo a Pesquisa do Estado de São Paulo (FAPESP) process 04/00235‑9, Francisco Barreira (Paco) (in memorian) for the field survey support, and Marieli Machado Zago for helping in map editing. We also thank the Applied Geology Department (Departamento de Geologia Aplicada) from the São Paulo State University (UNESP) — Campus Rio Claro, São Paulo — for all the support (equipment and vehicles).
Almeida F.F.M. 1980. Tectônica da Bacia do Paraná no Brasil.
Instituto de Pesquisas Tecnológicas do Estado de São Paulo. São Paulo: IPT. 187 p. Relatório 14.091.
Blakely R. 1988. Curie temperature isotherm analysis and tectonic
implications of aeromagnetic data from Nevada. Journal of
Geophysical Research, 93(10):11817-11832.
Bósio V.J. 1973. Geologia da área de São Pedro, SP. PhD Thesis,
Faculdade de Filosoia, Ciências e Letras de Rio Claro, Rio Claro, 125 p.
Briggs I.C. 1974. Machine Contouring Using Minimum Curvature.
Geophysics, 39(1):39-48.
REFERENCES
Castro P.R.M. 1973. Contribuição ao estudo da estrutura do Pau
d’Alho (Piracicaba, SP). PhD Thesis, Faculdade de Engenharia de Limeira, Universidade de Campinas, Campinas, 87 p.
Cordani U.G., Brito Neves B.B., Fuck R.A., Porto R., Thomaz Filho A., Cunha F.M.B. 1984. Estudo preliminar de integração do Pré‑Cambriano com os eventos tectônicos das bacias sedimentares brasileiras. Rio de Janeiro: PETROBRAS. 70 p. Série Ciência – Técnica – Petróleo, Seção: Exploração de Petróleo da Petrobras.
Cowan D.R. & Cowan S. 1993. Separation iltering applied to
aeromagnetic data. Exploration Geophysics,24:429-436.
CPRM – Serviço Geológico do Brasil. 2001. Mapa geológico do
Brasil, escala 1:2.500.000. In: Bizzi L.A., Delgado I.M., Abram
M.B., Leão Neto R., Matos G.M.M., Santos J.O.S. Geologia,
Tectônica e Recursos Minerais do Brasil: Sistema de Informações Geográficas ‑ SIG e Mapas na escala 1:2.500.000.Brasília: CPRM. CD-ROM 3.
Dorman L. & Lewis B. 1970. Experimental isostasy, 1, Theory of the determination of the Earth’s isostatic response to a concentrated load. Journal of Geophysical Research, 75:3357‑3365.
Dourado J.C. 2004. Estruturação crustal da região de Rio Claro
através da sismologia. PhD Thesis, Universidade Estadual Paulista, Rio Claro, 104 p.
Fairhead J.D., Green C.M., Blitzkow D. 2003. The use of GPS in gravity surveys. The Leading Edge, 22:954‑959.
Fairhead J.D. & Odegard M.E. 2002. Advances in gravity survey resolution. The Leading Edge, 21:36-37.
Ferreira F.F.J. 1982. Integração de dados aeromagnéticos e geológicos: coniguração e evolução tectônica do Arco de Ponta Grossa. MS Dissertation, Instituto de Geociências, Universidade de São Paulo, São Paulo, 169 p.
Ferreira F.J.F., Moraes R.A.V., Ferrari M.P., Viana R.B. 1981. Contribuição ao estudo do Alinhamento Estrutural de
Guapiara. In: Simpósio Regional de Geologia, 3., 1981. Atas...,
p 226-240. v. 1.
Fries M. 2008. Estudo dos altos estruturais de Pitanga, Artemis,
Pau D’Alho e Jibóia (lanco nordeste da Bacia Sedimentar do Paraná) através dos métodos geofísicos da gravimetria e magnetometria terrestres. PhD Thesis, Universidade Estadual Paulista, Rio Claro, 262 p.
Fulfaro V.J. 1971. A evolução tectônica e paleogeográica da Bacia
Sedimentar do Paraná pelo “Trend surface analysis”. Boletim da
Escola de Engenharia de São Carlos da USP, 14:1-112.
Fulfaro V.J., Gama Jr. E., Soares P.C. 1980. Revisão estratigráica
da Bacia do Paraná. São Paulo, PAULIPETRO, Consórcio IPT/CESP. Relatório 008/80.
Fulfaro V.J., Saad A.R., Santos M.V., Vianna R.B. 1982. Compartimentação e evolução tectônica da Bacia do Paraná.
Revista Brasileira de Geociências, 12(4):233‑256.
GM-SYS. 2000. Gravity magnetic modeling software user’s guide
for version 4.6. Corvallis, Northwest geophysical associates, Inc., 100 p.
Hasuiu Y., Haralyi N.L.E., Campanha V.A., Hamza V.M., Galli V.A.,
Frangipani A., Puleghini F.P. 1989. Compartimentação estrutural e
evolução tectônica do Estado de São Paulo. São Paulo, IPT. Relatório 27394 – Pró-Minério.
Hildenbrand T.G. & Kucks R.P. 1983. Regional magnetic and
gravity features of the Gibson Dome area surrounding region, Paradox Basin Utah: a preliminary report: US Geological Survey
Open‑File Report 83 – 359. Denver, Colorado: US Dept. of the
Interior, Geological Survey.
IPT – Instituto de Pesquisas Tecnológicas do Estado de São
Paulo. 1980. Prospecção geofísica (sondagens elétricas verticais e
magnetometria) em apoio aos estudos geológicos na região de São Pedro e Piracicaba – bloco 47, Divisão de Minas e Geologia Aplicada.
São Paulo, IPT. Relatório IPT n. 14.481. 55 p.
IPT – Instituto de Pesquisas Tecnológicas do Estado de São Paulo. 1981. Mapa Geológico do Estado de São Paulo, escala 1:500.000. São Paulo, Divisão de Minas e Geologia Aplicada.
Landim P.M.B., Soares P.C., Gama Jr. E. 1980. Estratigraia do
nordeste da Bacia do Rio Paraná. Rio Claro: IPT/UNESP. 45 p.
Curso de Especialização.
Milani E.J. 1997. Evolução tectono‑estratigráica da Bacia do Paraná
e seu relacionamento com a geodinâmica fanerozóica do Gondwana sul – ocidental. PhD Thesis, Universidade Federal do Rio Grande do
Sul, Porto Alegre, 255 p.
Milani E.J. & Ramos V.A. 1998. Orogenias Paleozóicas no Domínio Sul-Ocidental do Gandwana e os ciclos de subsidência
da Bacia do Paraná. Revista Brasileira de Geociências,
28(4):473-484.
Morales N., Perinotto J.A.J., D’afonseca F.M. 1997. Evidências de
tectônica distensiva sindeposicional à Formação Tatuí na região de Limeira S.P. In: Simpósio de Geologia do Sudeste, 5., 1997. Anais...,
p. 60-61.
Ofoegbu C.O. & Hein K. 1991. Analysis of magnetic data over part
of the younger granite Granite Province of Nigeria. Pure Applied
Geophysics, 136:173-189.
Paulipetro – Consórcio CESP/IPT. 1981. Metodologia da Paulipetro
para prospecção geofísica na Bacia do Paraná. In: Seminário sobre Exploração do Petróleo no Brasil, Rio de Janeiro.
Quintas M.C.L. 1994. O embasamento da Bacia do Paraná:
reconstrução geofísica de seu arcabouço. PhD Thesis, Universidade de São Paulo, São Paulo, 218 p.
Riccomini C. 1989. O Rit Continental do sudeste do Brasil. PhD
Thesis, Universidade de São Paulo, São Paulo, 256 p.
Riccomini C. 1992. Estilos estruturais da região do Domo de Pitanga,
Bacia do Paraná, SP. Boletim do Instituto de Geociências da USP,
12:93-94.
Riccomini C. 1995. Tectonismo gerador e deformador dos depósitos sedimentares pós‑gondwânicos da porção centro‑oriental do Estado de São Paulo e áreas vizinhas. Thesis (livre docência), Universidade de São Paulo, São Paulo. 100 p.
Riccomini C. 1997. Arcabouço estrutural e aspectos do tectonismo gerador e deformador da Bacia Bauru no Estado de São Paulo.
Revista Brasileira de Geociências, 27(2):153‑162.
Rostirola S.R., Assine M.L., Fernandes L.A., Arthur P.C. 2002. Reativação de paleolineamentos durante a evolução da Bacia do
Paraná exemplo do Alto Estrutural de Guatiguá. Revista Brasileira
de Geociências,30(4):639-648.
Shuey R., Schellinger D., Tripp A., Alley L. 1977. Curie depth
determination from aeromagnetic spectra. Geophysical Journal of
the Royal Astronomical Society, 50:75‑101.
Soares P.C. 1971. Elementos estruturais da parte nordeste da
Bacia do Paraná: classiicação e gênese. In:Congresso Brasileiro de Geologia, 1971. Anais...v. 1, p. 107-121.
Soares P.C. 1973. O mesozóico Gondwânico no Estado de São Paulo.
PhD Thesis, Faculdade de Filosoia, Ciências e Letras de Rio Claro, Rio Claro, 152 p.
Soares P.C. 1974. Elementos estruturais da parte nordeste da
Bacia do Paraná: classiicação e gênese. In: Congresso Brasileiro de Geologia, 1974. Anais... v. 30, p. 107-121.
Soares P.C. 1991. Tectônica Sinsedimentar cíclica na Bacia do
Paraná – Controles. Thesis (concurso ao cargo de professor titular), Universidade Federal do Paraná, Curitiba, 131 p.
Soares P.C., Barcellos P.E., Csordas S.M. 1982. Lineamentos em imagens de landsat e radar e suas implicações no conhecimento tectônico da
Bacia do Paraná. In: Simpósio Brasileiro de Sensoriamento Remoto,
Soares P.C. & Landim P.M.B. 1973. Aspectos Regionais da Bacia do
Paraná no seu lanco nordeste. In: Congresso Brasileiro de Geologia, 1973. Anais... v. 1, p. 243‑256.
Sousa M.O.L. 1997. Caracterização Estrutural do Domo de Pitanga –
SP. MS Dissertation, Universidade Estadual Paulista “Júlio de Mesquita Filho”, Rio Claro, 116 p.
Sousa M.O.L. 2002. Evolução Tectônica dos Altos Estruturais de
Pitanga, Ártemis, Pau D’ Alho, e Jibóia – Centro de Estado de São Paulo. PhD Thesis, Universidade Estadual Paulista, Rio Claro, 206 p.
Souza Filho E.E. 1983. Tectônica da região de Rio Claro-Piracicaba, Domo de Pitanga. In: Simpósio Regional de Geologia, 1983. Atas... p. 191-196.
Spector A. & Grant F.S. 1970. Statistical models for interpreting aeromagnetic data. Geophysics, 35:293-302.
Talwani M., Heirtzler J.R. 1964. Computation of magnetic anomalies caused by two-dimensional bodies of arbitrary shape In: Parks G.A. (ed.). Computers in the mineral industrie. Part I, 9, San Francisco, Stanford University Publications, Geological Sciences. p. 464-480.
Talwani M., Worzel J.L., Landisman N.M. 1959. Rapid gravity
computations for two-dimensional bodies with application to
the Mendocino submarine fracture zone. Journal of Geophysical
Research, 64:49‑59.
Telford W.M., Geldart L.P., Sherif R.E. 1990. Applied Geophysics. Cambridge, Cambridge University Press, 2nd edition, 770 p.
Tselentis G., Drakopoulos J., Dimitriadias K. 1988. A spectral approach to Moho depths estimation from gravity
measurements in Epirus (NW Greece). Journal Physics of the
Earth, 36:255‑266.
Washburne C.W. 1930. Petroleum Geology of the State of São Paulo.
Boletim do Instituto Geográico e Geológico, 22:272 p.
Zalán P., Wolf S., Conceição J., Vieira I.S., Appi V.T., Zanotto O.A.P.
1987. Tectônica e Sedimentação da Bacia do Paraná. In: Simpósio
Sul Brasileiro de Geologia, 1987. Atas..., p. 441-477.
Zalán P.V., Wolf S., Conceição J.C.J., Marques A., Astoli M.A.M., Vieira
I.S., Appi V.T., Zanotto O. 1990. Bacia do Paraná. In: Gabaglia G.P.R., Milani E.J. (eds.), Origem e evolução de bacias sedimentares. Rio de
Janeiro, PETROBRAS, p. 135‑168.