Bol. Ciênc. Geod., sec. Artigos, Curitiba, v. 21, no 2, p.433-441, abr-jun, 2015.
Comunicação
A NOTE ON THE CONVENTIONAL OUTLIER DETECTION TEST
PROCEDURES
Considerações sobre testes convencionais de detecção de ouliers
JIANFENG GUO
Info Engineering University, P.O.Box 603, 62 Kexuedadao Rd, 450001, Zhengzhou, China
Email: [email protected]
Abstract:
Under the assumption of that the variance-covariance matrix is fully populated, Baarda’s w-test is turn out to be completely different from the standardized least-squares residual. Unfortunately, this is not generally recognized. In the limiting case of only one degree of freedom, all the three
types of test statistics, including Gaussian normal test, Student’s t-test and Pope’s Tau-test, will be invalid for identification of outliers: (1) all the squares of the Gaussian normal test statistic coincide with the goodness-of-fit (global) test statistic, even for correlated observations. Hence, the failure of the global test implies that all the observations will be flagged as outliers, and thus the Gaussian normal test is inconclusive for localization of outliers; (2) the absolute values of the Tau-test statistic are all exactly equal to one, no matter whether the observations are contaminated. Therefore, the Tau-test cannot work for outlier detection in this situation; and (3)
Student’s t-test statistics are undefined.
Keywords: τutlier; Gaussian normal test; Student’s t-test; Tau-test; RAIM.
Resumo:
Assumindo que a matriz Variância-Covariância das observações foi obtida, a análise dos resíduos obtidos pelos mínimos quadrados não corresponde ao teste w de Baarda. Geralmente, esta consideração não é aceita na comunidade. Em casos especiais, onde os graus de liberdade são igual a 1 (um), todos os 3 (três) tipos de testes estatísticos, incluindo o teste de normalidade de Gauss, o teste t-Students e o teste Tau-Pope, não podem ser aplicados para detecção de
Bol. Ciênc. Geod., sec. Artigos, Curitiba, v. 21, no 2, p.433-441, abr-jun, 2015.
teste Tau não é eficiente para detecção de outliers, e (3) as estatísticas do teste t-Student são indefinidas.
Palavras-chave: Oultier; Teste de normalidade de Gauss; Teste t-Student; Teste Tau; RAIM.
1. Introduction
Least-squares (LS) estimation is the predominant technique for geodetic data processing. However, LS estimation is sensitive to outliers (Wolf and Ghilani, 1997; Koch, 1999; Leick, 2004). One way to circumvent this difficulty is to adopt the conventional outlier detection test procedures (see e.g., Baarda, 1968; Pope, 1976; Kok, 1984). In these procedures, the test
statistics used for outlier identification include those of the Gaussian normal test, Student’s t-test
and Pope’s -test. All these test statistics can be based on Baarda’s w-test or the standardized LS residual.
It should be pointed out that Baarda’s w-test statistic coincides with the standardized LS residual under the diagonality assumption of the weight matrix. However, these two kinds of test statistics may be completely different in the case of correlated observations. Unfortunately, this is not generally recognized (Guo et al., 2010).
Baselga (2011) presented an angular resection problem with one redundancy, in which the observations were supposed to be uncorrelated. Numerical results state that the standardized LS residual flags all observations. One interesting problem is that of determining whether the conventional outlier detection test procedures, for uncorrelated or correlated observations, can work in the limiting case of only one degree of freedom.
The paper is organized as follows: Firstly, the conventional outlier detection test procedures are briefly overviewed. Under the condition of one redundancy, limitations of three types of test statistics used for outlier identification are addressed. An example associated with a GPS baseline RAIM (Receiver Autonomous Integrity Monitoring) scheme concludes the investigations.
2. Model description
Consider the linear Gauss-Markov model defined by Koch (1999)
where L is the n x 1 vector of normally distributed observations, A the n x u design matrix with full column rank, X the u x1 vector of unknowns, P the weight matrix of L and σ2 the a-priori variance factor of unit weight.
The weighted LS estimator of the unknowns in model (1) is obtained as
Bol. Ciênc. Geod., sec. Artigos, Curitiba, v. 21, no 2, p.433-441, abr-jun, 2015.
where R=I - A(ATPA)-1ATP. The matrix R plays a pivotal role in linear adjustment techniques since it contains extremely useful information (Huber and Ronchetti, 2009; Guo, 2014).
The formulation for the most fundamental test statistic in LS estimation is given by
Under the assumption of normality, based on this statistic, the goodness-of-fit test (Wolf and Ghi lani, 1997; Leick, 2004) can be performed to find out whether the adjustment results are valid.
3. Mean-shift outlier detection model
In conventional outlier detection test procedures, it is usually assumed that there is only one (possible) outlier exists in the observations (see Baarda, 1968; Pope, 1976; Baselga, 2011). Let us assume that an outlier exists in the i th observation so that the mean-shift outlier model should have read (Chatterjee and Hadi, 1988)
where [A ci] has full column rank and ci is the i th canonical unit vector with all zeros except for a one as its i th entry.
By employing the LS principle, one obtains the estimates
since
Therefore, the residual vector of the above mean-shift outlier model is given by
It follows that
in which
Bol. Ciênc. Geod., sec. Artigos, Curitiba, v. 21, no 2, p.433-441, abr-jun, 2015.
4. Three kinds of test statistics used for outlier detection
Three different test statistics, including those for the Gaussian normal test, Pope’s -test and
Student’s t-test, are used in conventional outlier detection procedures.
With the aid of the mean-shift outlier model (Chatterjee and Hadi, 1988; Guo, 2013), the problem of outlier identification in model (1) can be carried out in terms of the following hypothesis in model (5)
The test statistic
defines the uniformly most powerful test for testing H0i versus Hai at a given level of significance (Baarda, 1968; Kargoll, 2007; Guo et al., 2010), provided that no other outliers exist.
In practice, it is more convenient to use the square root of the test statistic Ti, namely, the
Baarda’s w-test statistic wi (Baarda, 1968). If the variance factor is unknown, the parameter involved in the w-test may be replaced by its estimate. This will lead to either Pope’s -test statistic
or to Student’s t-test statistic
with
The standardized LS residual
has been extensively employed to test whether the i th observation is an outlier, both in the geodetic and the statistical literature, always assuming that the variance factor is given.
If the variance factor is unknown, either the so-called internally Studentized residual
or the externally Studentized residual
Bol. Ciênc. Geod., sec. Artigos, Curitiba, v. 21, no 2, p.433-441, abr-jun, 2015.
5. Limitation of conventional outlier detection test procedures
Conventional outlier detection test procedures have been used in many geodetic applications. However, can these procedures still work if there is only one degree of freedom, namely n - u = 1?
In this limiting case, there is no redundancy in the mean-shift outlier model (5). This implies immediately that
which, in combination with (9) and (12) yields
and thus
since n u 1.
By virtue of (9), (20) can be rewritten as
Since these two quadratic forms coincide for any realization of the random observation vector L, and since both RTPciciTPR and PR are symmetric, one can obtain
It follows immediately that
and
Therefore, with the definition of v% it follows that i
which in combination with (21) yields
Bol. Ciênc. Geod., sec. Artigos, Curitiba, v. 21, no 2, p.433-441, abr-jun, 2015.
Substituting (21) into (13) gives
Analogically, the following result can be obtained
With (21), and (27) - (29) one can conclude that, in the limiting case of only one degree of
freedom, (1) the Student’s t-test statistics are undefined (degenerate); (2) all the squares of Gaussian normal test coincide with the goodness-of-fit (global) test, even for correlated observations. That is, the failure of the global test implies all the observations will be flagged as outliers, and thus the Gaussian normal test is invalid for localization of outliers; and (3) the τ -test also becomes inappropriate, because the absolute values of the τ -test statistics equal to one no matter whether the observations are contaminated by outliers.
These results can be used in GPS Receiver Autonomous Integrity Monitoring (RAIM) scenario. The GPS receiver needs at least four satellites to yield a three-dimensional position (latitude, longitude, and altitude) and time solution. In order for a GPS receiver to perform RAIM or fault detection function, a minimum of five visible satellites with satisfactory geometry must be visible to it. However, six or more satellites are required to identify the faulty satellite and exclude it from the navigation solution (Parkinson and Axelrad, 1988; Brown, 1992; Langley 1999).
6. An illustrative example
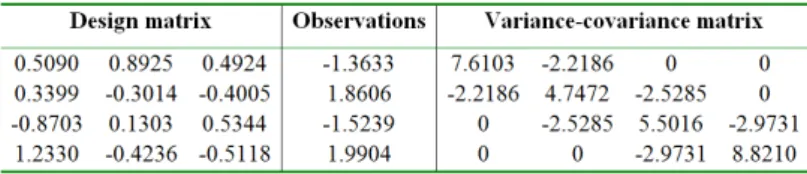
The differential GPS positioning technique (Leick, 2004) has been widely used to cancel all error sources common to two GPS receivers on a short baseline. A static experimental data set was collected with a sampling interval of 1 second and a cut-off elevation angle of 15° on 3 August 2005, in Wuhan, China. The length of the baseline is approximately 6 km. At a special measurement epoch, only five satellites were visible. The satellites were PRN 19, 27, 8, 11 and 28. The numerical details of the linearized GPS double-differenced (DD) pseudorange equations are presented in Table 1.
Table 1: Numerical details of the linearized GPS DD pseudorange equations
The calculated value of the goodness-of-fit test statistic (0.1637) is less than the critical value that corresponds to the 0.01 significance level. Therefore, the underlying adjustment appears
Bol. Ciênc. Geod., sec. Artigos, Curitiba, v. 21, no 2, p.433-441, abr-jun, 2015.
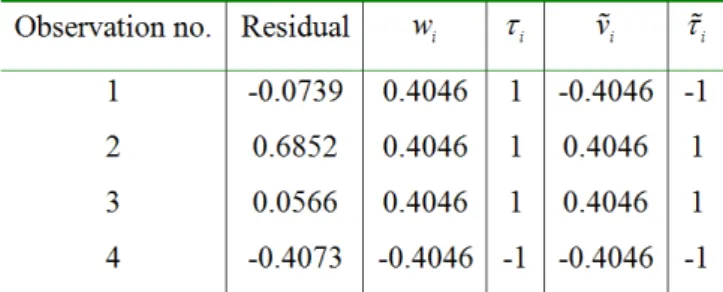
Table 2: Calculated values of some one-dimensional test statistics
For purposes of illustration, an artificial outlier of +20 (m) is introduced to the first observation. In this situation, the calculated value of the goodness-of-fit test statistic of 10.5651 is clearly unacceptable; for, 6.6349 is the critical value at the 0.01 significance level. All the observations are flagged as outliers by using the Gaussian normal test at the 0.001 significance level (cf. Table 3).
Table 3: Results after outlier simulation of +20 m in obs. #1
As demonstrated before, in this limiting case of only one redundancy, neither Baarda’s w-test statistic nor the standardized LS residual can be used to identify the single outlying observation.
Worse still, the calculated value of Pope’s τ-test statistic is equal to either 1 or -1, no matter whether the observations are contaminated by outliers or not.
7. Conclusions
Following the pioneering work by W. Baarda, conventional outlier detection test procedures have been extensively adopted and investigated in geodesy. The test statistics involved in these
test procedures include those of Gaussian normal test, Student’s t-test, and Pope’s τ-test. All
these test statistics can be based on Baarda’s w-test or the standardized LS residual.
However, in the situation of only one redundancy, (1) Student’s t-test statistics are undefined; (2)
Pope’s τ-test statistics are also invalid, because their absolute values equal to one no matter whether the observations are contaminated by outliers or not; and (3) failure of the global test implies that all the observations will be flagged as outliers and, thus, the Gaussian normal test is inappropriate for the localization of outliers.
Bol. Ciênc. Geod., sec. Artigos, Curitiba, v. 21, no 2, p.433-441, abr-jun, 2015.
As a result, without additional information or new observation(s), it is unrealistic to expect that the deteriorating effect of an observation with outlier on the parameter estimates can be reduced in the case of only one degree of freedom.
ACKNOWLEDGEMENT
This research was sponsored by National Key Basic Research Program of China (2012CB825604), and the Natural Science Foundation of China (Grant Nos. 41474029 and 40874007). The author is also supported by the China Scholarship Council (File No. 2011317045).
REFERENCES
Baarda W. A testing procedure for use in geodetic networks. Netherlands Geod. Comm., Publ. on Geodesy, 1968, New Series, 2(5), Delft, The Netherlands.
Baselga, S. “Nonexistence of rigorous tests for multiple outlier detection in least-squares adjustment.”Journal of Surving Engineering, 137(2011): 109-12.
Brown, R. “A baseline GPS RAIM scheme and a note on the equivalence of three RAIM methods.”Navigation, 39(1992): 301-6.
Chatterjee, S., and Hadi, A. Sensitivity analysis in linear regression. New York: Wiley, 1988. Guo, J. “Analytical quality assessment of iteratively reweighted least-squares (IRLS) method.”
Boletim de Ciencias Geodesicas, 20(2014): 132-41.
Guo, J. “The case-deletion and mean-shift outlier models: equivalence and beyond.” Acta Geodaetica et Geophysica, 48(2013): 191-7.
Guo, J., Ou, J., and WANG, H. “Robust estimation for correlated observations: two local sensitivity-based downweighting strategies.”Journal of Geodesy, 84(2010): 243-250.
Huber, P., and Ronchettie, M. Robust statistics, 2nd Ed. New York: Wiley, 2009.
Kargoll, B. “On the theory and application of model misspecification tests in geodesy.” PhD diss., University of Bonn, 2007.
Koch, K. Parameter estimation and hypothesis testing in linear models, 2nd Ed. Berlin: Springer, 1999.
Kok, J. On data snooping and multiple outlier testing. NOAA Technical Report, NOS NGS. 30, U.S. Department of Commerce, Rockville, MD, 1984.
Langley, R. “The integrity of GPS.”GPS World, 10(1999): 60-3. Leick, A. GPS satellite surveying, 3rd Ed. New York: Wiley, 2004.
Parkinson, B., and Axelrad, P. “Autonomous GPS integrity monitoring using the pseudorange residual.”Navigation, 35(1988): 255-74.
Bol. Ciênc. Geod., sec. Artigos, Curitiba, v. 21, no 2, p.433-441, abr-jun, 2015.
Wolf, P., and Ghilani, C. Adjustment computations: statistics and least squares in surveying and GIS, 3rd Ed. New York: Wiley, 1997.