Abstract— In this work, a simple strategy to design wideband low
power consumption Raman amplifiers is demonstrated for a three-pump configuration using a low water peak optical fiber. The approach is based on the introduction of a novel numerical measure, which quantifies and isolates pump-pump interaction contribution to gain profile and analyzes its correlation to amplifier minimum ripple. The method tailors the amplifier gain spectrum over 80nm bandwidth with a ripple smaller than 1dB, a gain on the order of 4dB for up to 75km fiber length, and a total pump power consumption smaller than 300mW.
Index Terms— Optical Communications, Raman Amplifiers, Raman Amplifier Optimization
I. INTRODUCTION
Recent advances in Internet-based applications accessible for both commercial and residential
customers as well as evolving social networks still increases the traffic growth throughout the
network. Additionally, low price mobile services, are also forcing a huge increment on the capacity
demand [1]. Among the key technologies to respond to these needs are low loss modern fibers, which
make possible 40THz optical window (the O, E, S, C and L bands) system operation, and wideband
Raman optical amplifiers.
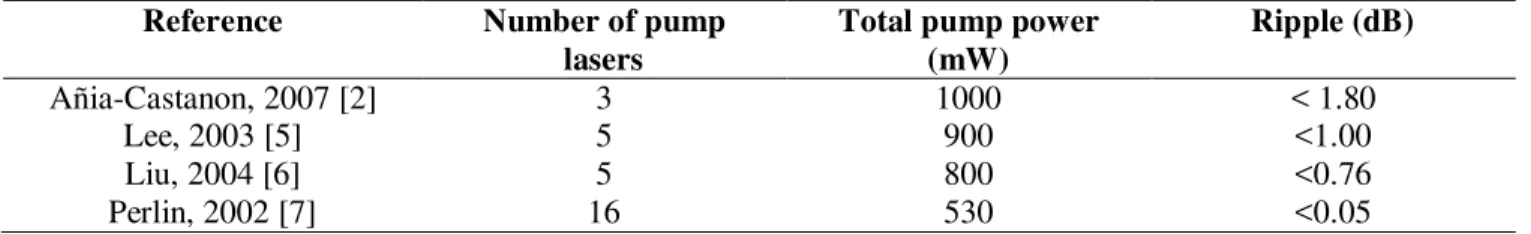
Over the past years, techniques and methodologies to design wideband Raman amplifiers
have been reported in the literature [2-8]. These techniques use multiple pumps, around five to eight,
to achieve an 80 nm bandwidth with a ripple better than 0.1dB. The drawback of such approaches is
the high power consumption in the Raman amplification module, and the use of complex and time
consuming numerical optimization routines to find the best combination of pump power and
wavelengths [9-10]. Table I shows previous works reported in the literature regarding the number of
pumps lasers, total power consumption and ripple for Raman amplifiers with approximately 80 nm
bandwidth.
A simple strategy to design broadband low
power consumption distributed Raman
amplifier
Renan S. Santos, Maria Aparecida G. Martinez,
Centro Federal de Educação Tecnológica Celso Suckow da Fonseca, Photonics Lab, Electrical Engineering Department, Avenida Maracanã, 229, Rio de Janeiro, Brazil, 20271-110,
[email protected], [email protected]
Maria Thereza M. R. Giraldi
Table I: RAMAN AMPLIFIER PUMP SETUPS REPORTED IN LITERATURE
Reference Number of pump
lasers
Total pump power (mW)
Ripple (dB)
Añia-Castanon, 2007 [2] 3 1000 < 1.80
Lee, 2003 [5] 5 900 <1.00
Liu, 2004 [6] 5 800 <0.76
Perlin, 2002 [7] 16 530 <0.05
In addition, since the interest concerning environmental issues is intensifying, the use of low
power consumption devices and systems will be a necessity in the near future. Consequently, future
networks should have the capacity to provide a massive quantity of bandwidth in an energy efficient
way [1]. Another concern in modern long-haul broadbandfiber optic communication systems using
wavelength division multiplexing (WDM) is the minimization of the amplifier ripple [11-12]. In this
work, we introduce an approach to design wideband low power consumption Raman amplifier over an
80nm band. It lies on isolating the pump-pump interaction contribution to wideband Raman amplifiers
spectrum and studying its relation to the amplifier ripple, through the introduction of a novel design
strategy. In section II, the approach along with the scenario of interest are introduced, accompanied by
a discussion on minimum total power conditions for pump-pump interaction to affect gain profile. In
section III, the results and analysis are conducted for counter and co-propagating configuration for
fiber lengths up to 75km; up to 80nm bandwidth and total pump power smaller than 300mW. Finally,
the conclusions are reported in section IV.
II. DESCRIPTIONOFTHEAPPROACH
The scenario of interest is shown in Fig.1. It consists of three pump lasers in co or
counter-propagating configuration. The fiber span length, L, ranges from 25km up to 75km. The signals are
within the S, C and L (from 1510 to 1590 nm) fiber communication bands, and at 0.1mW/channel.
The three equally spaced pumps wavelength are 1 = 1420nm, 2 = 1450 nm and 3 =1480nm, and its
power values are denoted by P1, P2 and P3, respectively.
In broadband Raman amplifier the ripple is greatly affected by pump-pump interaction [13].
For the scenario described in Figure 1, pump-pump interaction dominates the amplifier ripple for
equal pump power levels greater than a certain threshold value (P1=P2=P3 > Pth). Pump-pump
interaction signature is the typical spectrum tilt, with higher gain in the longer wavelength side than in
the shorter wavelength side of the amplification band (roughly ranging from 1515nm up to 1585nm).
Therefore, the amount of pump-pump interaction contributing to gain ripple can be estimated through
∆� − ��, a gain difference, defined as:
∆� − ��= � − ��− � − ��− �� .
(1)
In equation (1), � − �� is the amplifier on-off gain and � − ��− �� is the amplifier on-off
gain in the absence of pump-pump interaction effect. ∆� − �� is calculated through the solution of
the Raman coupled nonlinear equations previously reported in the literature [14-16]. The model
accounts for pump-signal interaction, pump-pump interaction, signal-signal interaction, Double
Rayleigh Backscattering (DRB) and Amplified Spontaneous Emission (ASE). Further, all fields in the
optical fiber were considered depolarized. The equations used can be found in the Appendix, where a
parameter � is introduced in the Raman coupled equations (equations 2 and 3 in the Appendix) where
it can assume either 0 or 1 value. If � = pump-pump interaction effects are accounted in the
amplifier simulation performance, and if � = otherwise.
The design approach is based on targeting ∆� − to zero, controlling just one design
parameter, namely, the power value of the central pump (2). The central pump efficiently controls
pump-pump interaction mitigating its harmful effects to gain ripple. The approach is valid for Pi > Pth
where i=1, 3 and P1=P3. Further, the correlation between the amplifier ripple and ∆� − is
monitored with the introduction of the relative difference between the amplifier ripple and the
maximum absolute value of ∆� − in the amplifier band, defined as
∆= [�� − ��|��� −� |] ��⁄ .
III. RESULTS
The analysis is conducted using a True Wave (TW) Reach fiber from OFS Fitel. The TW fiber
Raman gain efficiency spectrum is shown in Fig. 2 and its peak is about 2 times greater than the SMF
peak value. The effective area of the TW fiber at 1450nm and 1550nm are 49.09µ m2 and 56.06µm2,
respectively, a 20% reduction compared to SMF fibers. Further, the attenuation coefficient is smaller
than 0.3dB/km around 1400nm making it a good choice to wideband distributed Raman amplification.
Raman spectrum, effective area, Rayleigh coefficient and non-linear index, are input parameters to the
numerical solutions of the nonlinear equations.
Fig.2– TW and Standard SM fiber Raman spectrum for a pump wavelength at 1453nm
Pump-pump interaction effect in Raman amplifers leads to a power transfer from the shorter to
the longer wavelength within the amplifier gain band [13]. For the scenario under consideration this
signature is depicted in the set of curves in Fig. 3, where solid and dashed lines correspond to G − ff
and G − ff− ff, respectively. For signals below 1543nm, G − ff− ff > G − ff indicating the amount of
energy taken from the shorter wavelengths due to pump-pump interaction. The energy transferred to
the longer wavelengths is noticeable above 1543nm where G − ff− ff < G − ff. The power transfer
Fig.3– On-Off gain with (solid lines) and without (dashed lines) pump-pump interaction for co-propagating pumps and a 75 km fiber span. The circle set corresponds to P1=P2=P3=50mW, the square set to P1=P2=P3=100mW, and the triangle set to
P1=P2=P3=200mW.
In this scenario, there is a minimum power per pump, Pth, for which pump-pump interaction
affects gain profile. The threshold dependence with co and counter- propagating configurations is
shown in Fig. 4 and 5, respectively, where ∆G − ff curves are shown for different pump power
values for each configuration. For co-propagating configuration, ∆G − ff is negative below around
1537 nm and positive above it, depicting a transfer of energy for power values as low as 20mW per
pump. The energy transfer contributes to around 1.5dB gain difference for pump powers of 100mW.
On the other hand, for the counter-propagating configuration, ∆G − ff negative to positive transition
is observed only for power values above 60mW per pump. Furthermore, the threshold power is
independent of fiber length for co-propagating configuration and grows exponencially for the
counter-propagating configuration, as shown in Fig.6. The counter-counter-propagating configuration exponencial
behavior is a consequence of the power being launched at the end of the fiber. The longer the fiber
Fig.5– On-Off gain difference for counter-propagating pumps, ∆� − �� , and a 75 km fiber span. The power per pump in the curves are : circles – 20mW, squares – 40mW, diamond – 60mW, triangle - 80mW and star – 100mW. P1=P2=P3 for
each curve.
In Fig. 7, the central pump power, P2, is reduced to half the value of P1 and P3, for the
counter-propagating case discussed in Fig.5.A simple reduction by half leads to a decrease in pump power
threshold, and consequently pump-pump interaction contribution to gain profile. Before the reduction
the total threshold power was about 240mW total (80mW per pump), and after 200mW total (80mW
for P1 and P3 and 40mW for P2).
Fig.7 – On-Off gain difference for counter-propagating pumps, ∆� − ��, and a 75 km fiber span. The power per pump in the curves are : circles – 20mW, squares – 40mW, diamond – 60mW, triangle – 80mW and star – 100mW. P1= P3 and P2=
(1/2)P3 for each curve.
The correlation between gain ripple and ���|��� −���| for the scenario described in Fig. 7 is
better viewed by the corresponding relative difference parameter, as a function of P2/P3 power
ratio as presented, in Fig.8. The minimum occurs for a P2/P3 on the order of 0.6 for P1 and P3
values ranging from 60mW up to 100mW and 0.7 for P1 and P3 on the order of 40mW. For a 75km
fiber length at minimum is on the order of 10%. Nonetheless, it decreases with fiber length
reaching about 1% for L = 25km [17].
The relative difference, dependency with fiber length for P2/P3 = 0.4, 0.6 and 0.8 for P1 and
P2/P3 = 0.8, and on the order of 19% and 27% respectively. Otherwise, for P2/P3 = 0.6, it shows a
considerable dependency on fiber length, decreasing as total length varies from 20km up to 45km. A
minimum relative difference of 1% is reached at 45km fiber length. Then, it increases for lengths up
to 85km. Therefore, there is an optimum P2/P3 ratio and fiber length for which the values of ripple and
���|∆� − ��| have an agreement of about 1%. In summary, Fig. 9 shows a strong relation between
ripple and pump-pump interaction for fiber lengths from 30km up to 80km (smaller than 5%) when
the central pump power is reduced by 40% with respect to the value of P1 and P3.
Fig.8– as a function of P2/P3 power ratio and a 75 km fiber span. The power per pump P1 and P3 in the curves are :
Fig.9– as a function of fiber span length. The P2/P3 power ratio in the curves are: 0.4 (square), 0.6 (triangle) and 0.8
(circle). P1 and P3 are set equal to 100mW. Counter-propagating configuration.
In Fig. 10 it is shown simultaneously the on-off gain and gain ripple as a function of P2/P3 ratio,
for values of P1 and P3 equal to 60, 80 and 100mW for 75km. The highlighted area depicts the below
1dB ripple area, with minimum ripple of 0.67dB for a 3.77 dB gain, and a total pump power of
Fig.10 – Gain ripple (left axis and solid curves) and on-off gain (right axis and dashed curves) as a function of P2/P3 power
ratio and a 75 km fiber span. The power per pump P1 and P3 in the curves are: 60mW (diamond) , 80mW (triangle), and
100mW (star).
IV. CONCLUSIONS
A novel strategy was introduced in order to simplify the design of a broadband, medium level
power and low power consumption (300mW maximum) Raman amplifier. It isolates pump-pump
interaction contribution to gain profile, and its relation to the amplifier gain ripple, allowing for ripple
minimization by tailoring pump-pump interaction through a single design parameter, the relative
central pump power level. When the maximum value of the on-off gain difference is compared with
the ripple values, the results also show that the relative difference between them is lower (e. g.: they
have a better agreement) for central pump power values between 40 and 70% of the external pumps.
The approach was applied to a low water peak fiber, in co and counter-propagation configurations and
fiber lengths up to 75km. A reduction in central pump power around 40% relative to the external ones
reduces pump-pump interaction and consequently the gain ripple as well. The results demonstrated a
4dB gain over an 80nm band, with a ripple better than 0.70 dB. Finally, the approach described here,
although simplistic for a full design of practical amplifiers, could be used as initial step of a complex
robust optimization routine to limit the solution space, and possibly achieve a faster conversion
APPENDIX
The Raman nonlinear equation used to simulate the amplifier performance takes into account the
Raman effect as well as signal-signal interaction, pump-pump interaction, Double Rayleigh
Backscattering, and Amplified Spontaneous Emission (ASE). The following equations are built-in
into the code:
(2)
(3)
(4)
(5)
(6)
In equations (2) to (6), ��, is the signal power at wavelength �, ��, is the forward pumping
power at wavelength �, ��, is the backward pumping power at wavelength �, �� , is the Rayleigh
scattered signal power at wavelength �, ��� , is the Double Rayleigh scattered signal power at
wavelength �, �, is the Raman gain coefficient of a pump at wavelength � in a signal at wavelength
�, � is the Rayleigh Scattering coefficient, � is the Rayleigh Backscattering capture factor, ��, is
the fiber attenuation coefficient for a signal at wavelength �, � , is the fiber attenuation coefficient
for a pump at wavelength �, � is the noise power at wavelength �, ��, is the frequency of the
signal at wavelength �, � , is the frequency of the pump at wavelength � and � is a parameter
which value is either equal to 1 ( pump-pump interaction effects area accounted in the simulation) or 0
(pump-pump interaction effects are not accounted in the simulation).
ACKNOWLEDGMENT
The authors wish to acknowledge the Coordenação de Aperfeiçoamento de Pessoal de Nível Superior
(CAPES), Conselho Nacional do Desenvolvimento Científico e Tecnológico (CNPq) and Fundação
Carlos Chagas Filho de Amparo à Pesquisa do Estado do Rio de Janeiro (FAPERJ) for partially
supporting this work.
REFERENCES
[1]
A. Jirattigalachote, “Provisioning Strategies for Transparent Optical networks ConsideringTransmission Quality, Security, and Energy Efficiency”, PhD Thesis in Microelectronics and
Applied Physics, Royal Institute of Technology (KTH), Sweden, 2012.
[2]
J. D. Añia-Castañon et al, “Simple design method for gain-flattened three- pump Ramanamplifiers”. Optical and Quantum Electronics, 39, issue 3, pp. 213-220 .Springer, 2007.
[3]
J. Hu, B. S. Marks, C. R. Menyuk; “Flat-Gain Fiber Raman Amplifiers Using Equally SpacedPumps”. Journal of Lightwave Technology, 22(6), pp. 1519-1522, 2004.
[4]
S. M. Bilal, M. Zafrullah, M. K. Islam., “Gain Flattening of DWDM channels for the entire C& L bands”. Journal of Optical Technology, 75, n. 9, pp. 557-560, September 2012.
[5]
B. Lee, X. Liu, “Optimal Design for Ultra-Broad-Band Amplifier”. Journal of Lightwave Technology, 21, n. 12, pp 3446-3455, December 2003.[6]
X. Liu et al, “Optimizing gain profile and noise performance for distributed fiber Ramanamplifiers”. Optics Express, 12, n. 24, pp. 6053-6066, November 2004.
[7]
V. E. Perlin and H. G. Winful, “Optimal Design of Flat-Gain Wide-Band Fiber RamanAmplifiers”. Journal of Lightwave Technology, 20, n. 2, pp. 250-254, February 2002.
[8]
Z. LI et al, “Raman amplifier design using geometry compensation technique”. Optics Express, 12, nº 3, pp. 436-441, February 2004.[9]
G. C. M. Ferreira et al, “Optimization of Distributed Raman Amplifiers Using a HybridGenetic Algorithm With Geometric Compensation Technique”. IEEE Photonics Journal 3, n.
[10]
C. J. A. Bastos-Filho, “Simple Design of Raman Fiber Amplifiers using a Multi-objectiveOptimizer”. 11th International Conference on Intelligent Systems Design and Applications, pp. 1128-1133, November 2011.
[11]
F. Emami, M. Akhlaghi, “Gain Ripple Decrement of S-Band Raman Amplifiers”. IEEE Phot. Tech. Letter, 24 n. 15, pp. 1349-1352, August 2012.[12]
F. M. Mustafa, A. A. M. Khalaf, F. A. El-Geldawy, “Multi-pumped Raman Amplifier for Long-Haul UW-WDM Optical Communication Systems: Gain Flatness and BandwidthEnhancements”. 15th International Conference on Advanced Computing Technologies (ICACT), pp. 122-127, 2013.
[13]
H. Kidorf, K. Rottwitt, M. Nissov et al, "Pump interactions in a 100-nm bandwidth Ramanamplifier", IEEE Phot. Tech. Letter, 11, pp. 530- 532, May 1999.
[14]
L. A. M. Saito et al, "Multi-pump discrete Raman amplifier for CWDM system in theO-band", Optical Fiber Technology, 14, pp. 294-298, October 2008.
[15]
Stolen and E. P. Ippen, "Raman gain in glass optical waveguides". Appl. Phys. Lett., 22, pp.276-279, 1973.
[16]
R. F. R. de Farias et al, “Study of the quantitative impact of pump-pump interaction inwideband Raman amplifiers in the S, C and L bands”. Proceedings of SPIE, 7721. April
2010.
[17]
R. S. Santos et al, “On the Relation Between Gain Ripple and Pump-Pump Interaction in theDesign of Broad Band Raman Amplifiers”. 16º SBMO - Simpósio Brasileiro de Micro-ondas e Optoeletrônica e 11º CBMag - Congresso Brasileiro de Eletromagnetismo (MOMAG 2014),